. 2024 Jun;28(12):e18489.
doi: 10.1111/jcmm.18489.

Senescence induces miR-409 to down-regulate CCL5 and impairs angiogenesis in endothelial progenitor cells

Affiliations

Senescence induces miR-409 to down-regulate CCL5 and impairs angiogenesis in endothelial progenitor cells

Yen-Hung Chou et al. J Cell Mol Med. 2024 Jun.

Abstract

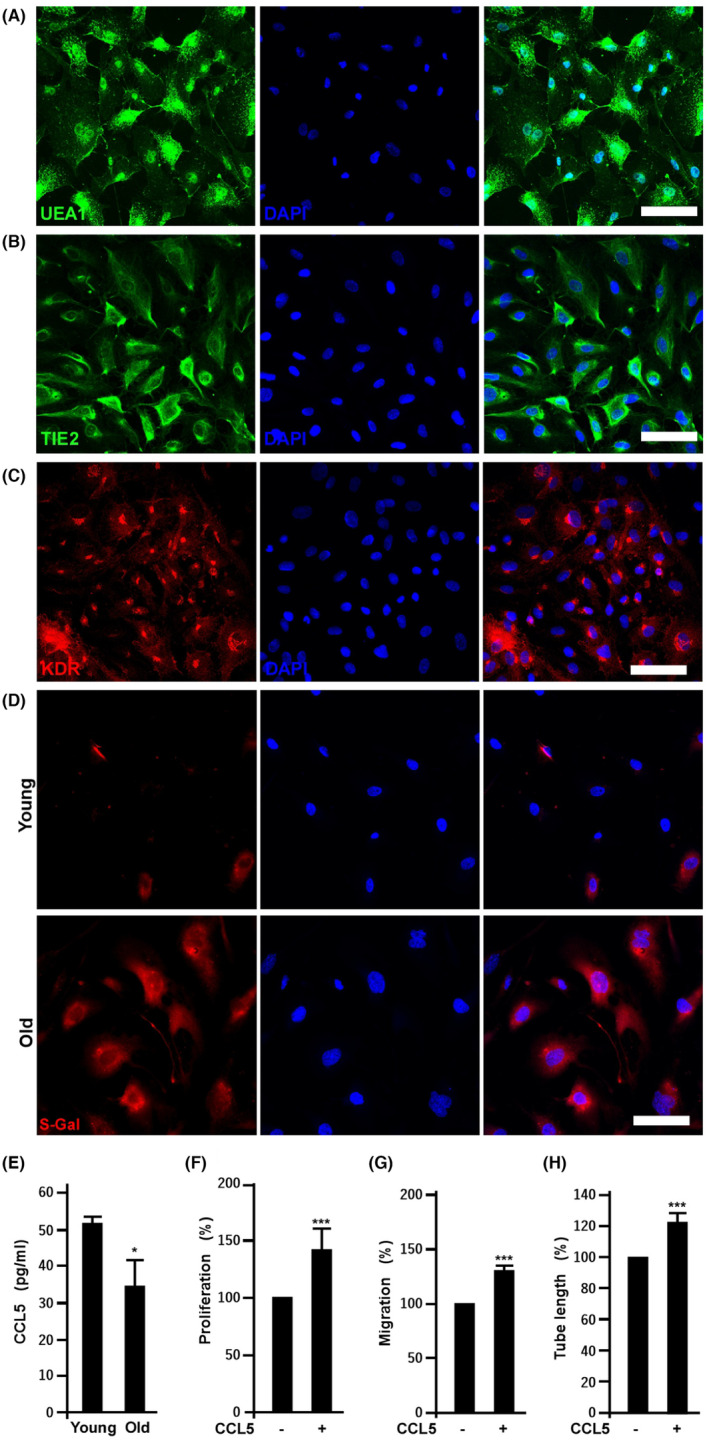
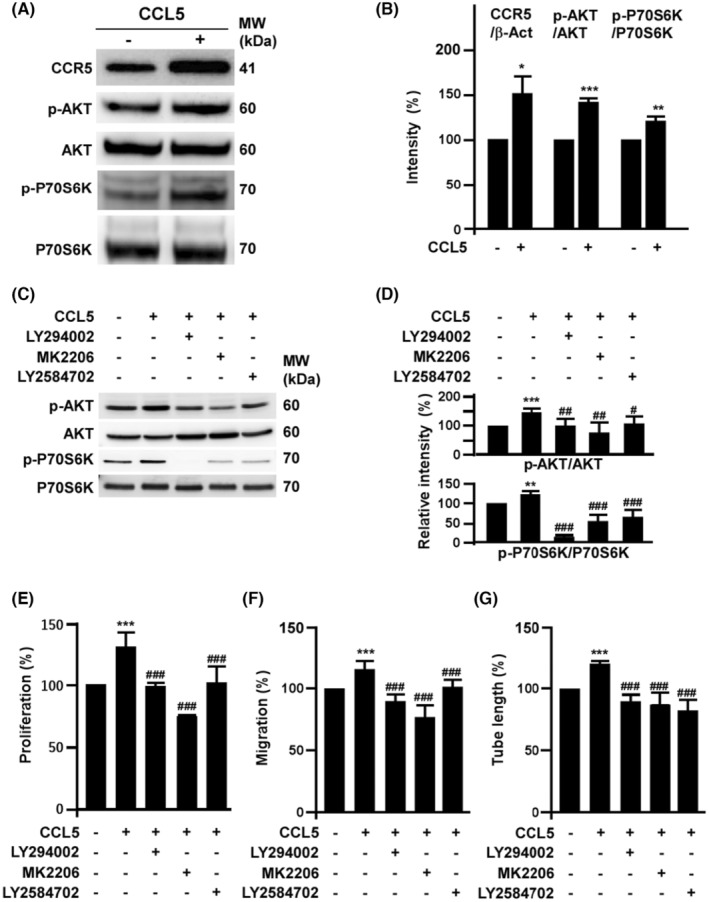
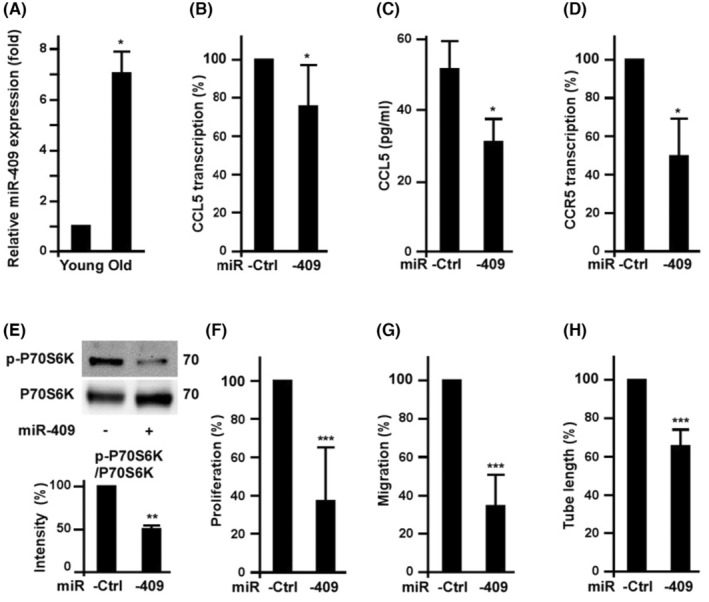
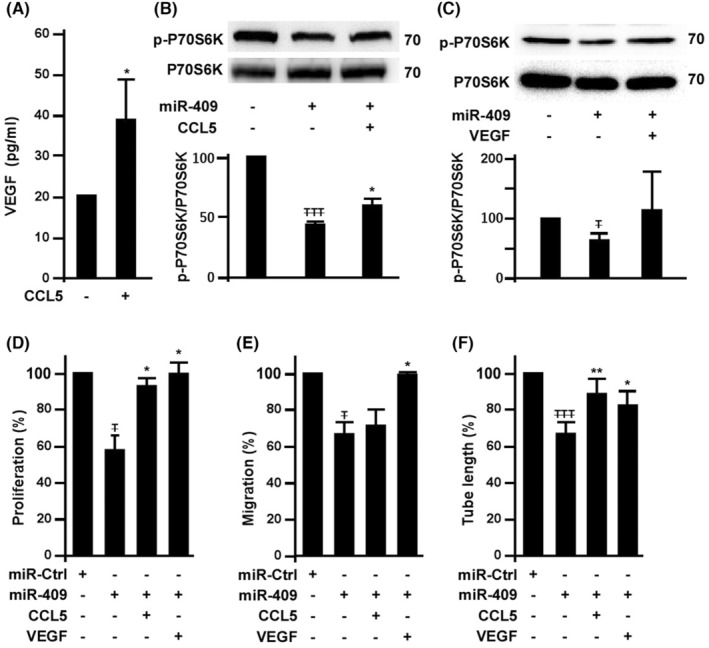
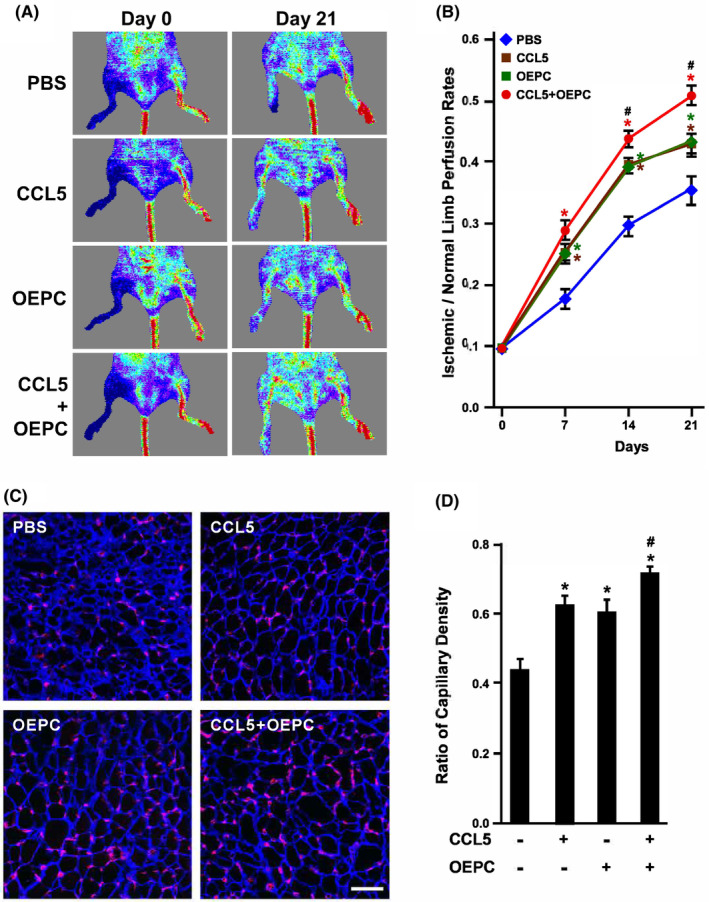
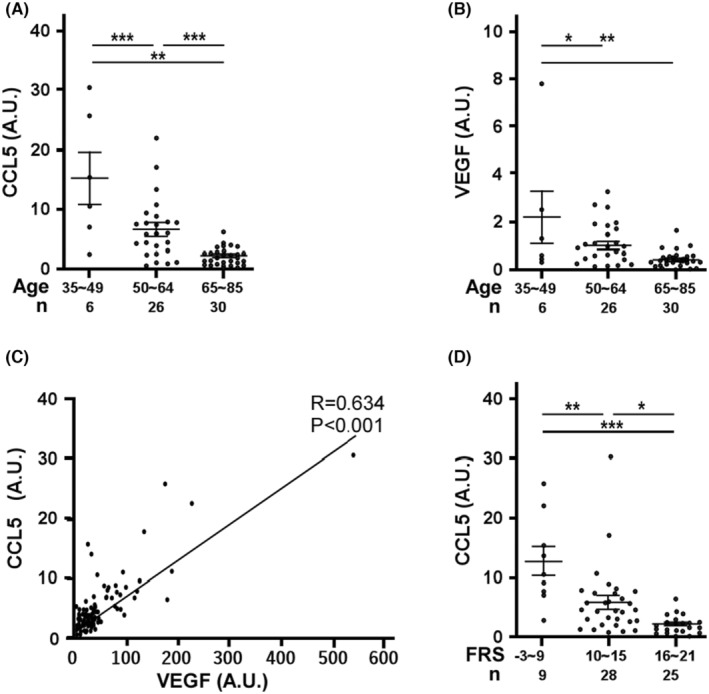
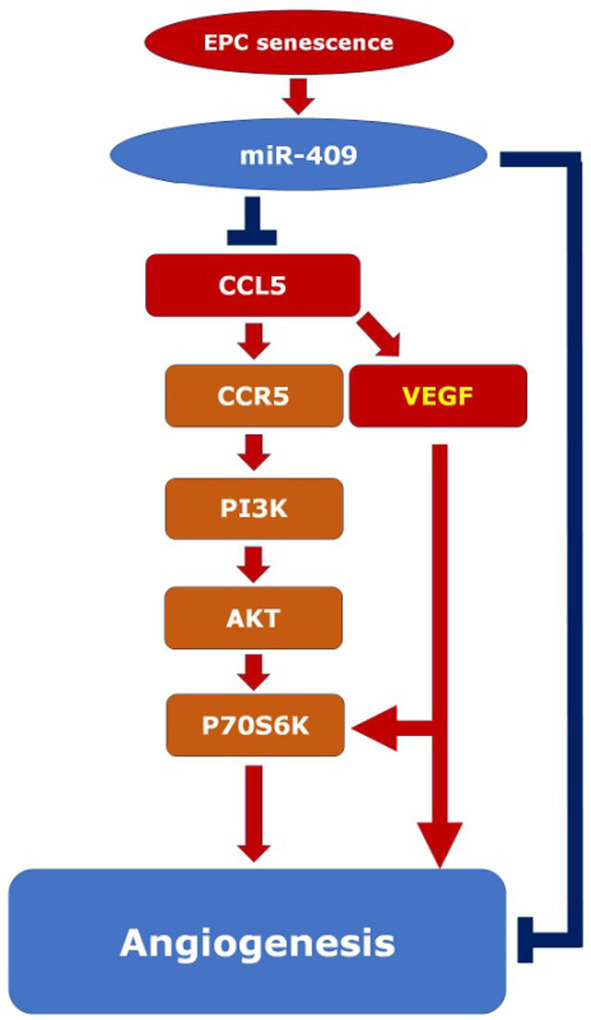
This study explores the impact of senescence on autocrine C-C motif chemokine ligand 5 (CCL5) in human endothelial progenitor cell (EPCs), addressing the poorly understood decline in number and function of EPCs during ageing. We examined the effects of replication-induced senescence on CCL5/CCL5 receptor (CCR5) signalling and angiogenic activity of EPCs in vitro and in vivo. We also explored microRNAs controlling CCL5 secretion in senescent EPCs, its impact on EPC angiogenic activity, and validated our findings in humans. CCL5 secretion and CCR5 levels in senescent EPCs were reduced, leading to attenuated angiogenic activity. CCL5 enhanced EPC proliferation via the CCR5/AKT/P70S6K axis and increased vascular endothelial growth factor (VEGF) secretion. Up-regulation of miR-409 in senescent EPCs resulted in decreased CCL5 secretion, inhibiting the angiogenic activity, though these negative effects were counteracted by the addition of CCL5 and VEGF. In a mouse hind limb ischemia model, CCL5 improved the angiogenic activity of senescent EPCs. Analysis involving 62 healthy donors revealed a negative association between CCL5 levels, age and Framingham Risk Score. These findings propose CCL5 as a potential biomarker for detection of EPC senescence and cardiovascular risk assessment, suggesting its therapeutic potential for age-related cardiovascular disorders.

Keywords: CCL5; angiogenesis; endothelial progenitor cells; miR‐409; senescence.


Conflict of interest statement

The authors declare that there are no conflicts of interest.

Figures

FIGURE 1
FIGURE 1
Senescence inhibits the secretion of CCL5, which enhances angiogenic potential of EPCs. (A) to (C) Effects of 10 serial passages on the expression of EPC markers, UEA1, TIE2 and KDR. EPCs below five passages from donors were defined as young EPCs, while the same cell line with additional 10 passages was defined as old cells. (D) Fluorescence imaging of SA‐β‐gal activity in young and old EPCs. (E) Effects of replication‐induced senescence on CCL5 secretion. CCL5 was harvested and quantified from the supernatants of young and old EPCs. Versus young EPCs, *, p < 0.05, N = 3. (F), (G) and (H), CCL5 regulates old EPC proliferation, migration and tube formation, respectively. Cells were treated without and with 0.1 ng/mL of CCL5 (#SRP3269, Sigma‐Aldrich). Cell proliferation was determined by BrdU incorporation, migration measured by transwell assays, and tube formation assay using Matrigel. Values are mean ± SD of triplicate assays from three independent experiments. **, p < 0.01; ***, p < 0.001 versus untreated cells.
FIGURE 2
FIGURE 2
CCL5 regulates EPC angiogenic potential via CCR5/AKT/P70S6K axis. (A) Effects of CCL5 on the activation of CCR5/AKT/P70S6K axis. EPCs were treated with 0.1 ng/mL of CCL5 for 24 h then harvested to detect the expression of CCR5, total and phosphorylated AKT as well as P70S6K by Western blot assay. (B) Quantification of triplicate Western blot assays from three independent experiments of the activation of CCR5/AKT/P70S6K. (C) Effects of LY294002, MK2206 and LY2584702 on CCL5‐mediated AKT/P70S6K activation. Cells were pretreated with LY294002 (2 μM), MK2206 (0.5 μM) and LY2584702 (1 μM) overnight followed by CCL5 (0.1 ng/mL) treatment for additional 24 h. Quantification results were shown in (D). (E) to (G), effects of CCR5/AKT/P70S6K activation on CCL5‐mediated EPC angiogenic potential. The relative proliferation and migration rates were measured after cells treated with 0.1 ng/mL of CCL5 for 18 h. EPC proliferation was determined by BrdU incorporation while migration was measured by transwell assays. For tube formation assay, EPCs were seeded on Matrigel. Values are mean ± SD of triplicate assays from three independent experiments. *, Compared with untreated cells; #, compared with CCL‐5 treated group. ** and ##*, p < 0.01; *** and ###, p < 0.001.
FIGURE 3
FIGURE 3
Senescence induced miR‐409 to down‐regulate CCL5/CCR5 level and decrease EPC angiogenic potential. (A) The effects of replication‐induced senescence on the expression of miR‐409 in EPCs. Young and old EPCs were harvested for miR‐409 measurement by quantitative PCR. *, p < 0.05, versus young EPCs. N = 3 (B) to (D) Effects of ectopic expression of miR‐409 on the level of CCL5 and CCR5. Cells were harvested after 2 days of miR‐409 or miR‐control transfection. Transcription of CCL5 and CCR5 were measured by quantitative RT‐PCR. For CCL5 levels, conditioned media of the EPCs were harvested to determine CCL5 by ELISA kit (C). *, p < 0.05, vs. Ctrl (miR‐control). (E) Effects of miR‐409 on CCL5‐induced P70S6K activation. EPCs were transfected with miR‐409 or miR‐control for 2 days, followed by CCL5 treatment overnight. Cells were harvested for Western blot assay. **, p < 0.01 (F) to (H), Effects of miR‐409 ectopic expression on EPC angiogenic potential. Cell proliferation and migration were measured after 2 days of miR‐409 or miR‐control transfection. ***, p < 0.001, versus miR‐control.
FIGURE 4
FIGURE 4
CCL5 increases VEGF level to counteract the suppressive effect of miR‐409 on EPC angiogenic activity. (A) Effects of CCL5 on VEGF secretion. EPCs were treated with 0.1 ng/mL of CCL5 for 24 h and the supernatants were harvested for VEGF concentration measurement. *, p < 0.05. (B) Effects of CCL5 on miR‐409‐mediated P70S6K inhibition. EPCs with 2 days of miR‐409 transfection were cultured with CCL5 (0.1 ng/mL). After CCL5 treatment overnight, cell lysates were harvested for Western blot analysis. T , compared with untreated cells; *, compared with CCL‐5 treated group. TTT , p < 0.001; *, p < 0.05. (C) Effects of VEGF on miR‐409‐mediated P70S6K inhibition. EPCs post 2 days of miR‐409 transfection were cultured with 50 ng/mL of VEGF for additional 16 hrs. T , p < 0.05. (D) to (F), Effects of CCL5 and VEGF on miR‐409‐mediated angiogenic inhibition. EPCs post 2 days of miR‐409 or miR‐control transfection were cultured with CCL5 (0.1 ng/mL) and VEGF (50 ng/mL). Angiogenic potential assays were performed in cells treated with CCL5 and VEGF overnight. T , compared with untreated cells; *, compared with miR‐409 only group. T and *, p < 0.05.
FIGURE 5
FIGURE 5
Effects of CCL5 on old EPC angiogenic ability in vivo. (A) Laser‐Doppler perfusion imaging of mouse hind limbs injected with human old EPCs (OEPC). Right hind limbs were injected with PBS, CCL5, OEPC and CCL5 combined with OEPC, and imaged at Day 0 and Day 21. Left hind limbs were untreated as control. (B) Quantification of hind limb perfusion rates. The area of ischemia versus normal perfusion were quantified. The days of imaging were as indicated. *, p < 0.05 compared with the PBS group; #, p < 0.05 compared with the OEPC group. (C) Ischemic hind limbs were sectioned to examine capillary densities at Day 21. Tissues were stained with laminin (blue) and lectin1 (red) to visualize myocytes and capillaries, respectively. (D) Quantification of capillary density of ischemic hind limbs. Capillary density was defined as the number of capillaries divided by the number of myocytes. *, p < 0.05 compared with the PBS (untreated) group; #, p < 0.05 compared with the OEPC group.
FIGURE 6
FIGURE 6
The relationships among CCL5‐ or VEGF‐secreting capacity, age and Framingham score. Circulating EPCs harvested from donors' peripheral bloods were cultured for 4 days to measure the concentrations of CCL5 and VEGF. (A) Scatter plot of VEGF (A.U.) versus donor's age. A.U. is defined as pg/mL/average cell number from four randomly selected microscopic fields at 50× magnification. Donors were classified as three groups. Bars indicate the mean of each group. Values are mean ± SD. Total n = 62 **, p < 0.01, ***, p < 0.001. NS, no significance (B) Scatter plot of CCL5 (A.U.) versus donor's age. Bars indicate the mean of each group. Values are mean ± SD. Total n = 62 **, p < 0.01, ***, p < 0.001. (C) The relationship of CCL5 and VEGF level normalized with cell number (A. U.). Straight line shows the best fit curve of simple linear regression modelling. R = 0.634, p < 0.001, Total n = 62 (D) CCL5 (A.U.) versus Framingham risk score (FRS). CCL5 level normalized with cell number was plotted with donor's Framingham risk score with age and gender adjustment. Donors were classified as three groups according to the scores. Bars represent the mean of each group. Scores (mean ± SD.) for the low risk group −3–9, 11.1 ± 8.0; medium risk group 10–15, 5.8 ± 5.9; and high risk group 16–21, 2.1 ± 1.4; Total n = 62.
FIGURE 7
FIGURE 7
Concept illustration for senescence inducing miR409 expression to down‐regulate CCL5‐mediated EPC angiogenesis. Pathway activation is indicated by arrows, while inhibition is designed by T bars. Senescence up‐regulates the miR‐409 expression, which reduces CCL5 expression and secretion in EPCs. CCL5 increases EPC proliferation, migration, and tube formation (angiogenesis) mainly through CCR5/PI3K/AKT/P70S6K pathway. CCL5 also enhances VEGF secretion which, unlike CCL5, exerts a more balanced enhancement on both EPC proliferation and migration. In our experiment, CCL5 supplement just partially rescued the migration capacity reduced by miR‐409 (Figure 4), indicating the presence of CCL5‐independent pathway (long blue T bar) downstream to miR‐409 (cf. reference 16).

Similar articles

Cited by

References

    1. Chong MS, Ng WK, Chan JK. Concise review: endothelial progenitor cells in regenerative medicine: applications and challenges. Stem Cells Transl Med. 2016;5(4):530‐538. 10.5966/sctm.2015-0227 - DOI - PMC - PubMed
    1. Umemura T, Soga J, Hidaka T, et al. Aging and hypertension are independent risk factors for reduced number of circulating endothelial progenitor cells. Am J Hypertens. 2008;21(11):1203‐1209. 10.1038/ajh.2008.278 - DOI - PubMed
    1. Jie KE, Goossens MH, van Oostrom O, Lilien MR, Verhaar MC. Circulating endothelial progenitor cell levels are higher during childhood than in adult life. Atherosclerosis. 2009;202(2):345‐347. 10.1016/j.atherosclerosis.2008.05.012 - DOI - PubMed
    1. Chang HW, Leu S, Sun CK, et al. Level and value of circulating endothelial progenitor cells in patients with acute myocardial infarction undergoing primary coronary angioplasty: in vivo and in vitro studies. Transl Res. 2010;156(4):251‐263. 10.1016/j.trsl.2010.07.010 - DOI - PubMed
    1. Goligorsky MS. Endothelial progenitor cells: from senescence to rejuvenation. Semin Nephrol. 2014;34(4):365‐373. 10.1016/j.semnephrol.2014.06.003 - DOI - PMC - PubMed

MeSH terms

LinkOut - more resources