. 2024 Sep;57(9):e13693.
doi: 10.1111/cpr.13693. Epub 2024 Jun 20.

Modelling bone metastasis in spheroids to study cancer progression and screen cisplatin efficacy

Affiliations

Modelling bone metastasis in spheroids to study cancer progression and screen cisplatin efficacy

Ceri-Anne E Suurmond et al. Cell Prolif. 2024 Sep.

Abstract

Most bone metastases are caused by primary breast or prostate cancer cells settling in the bone microenvironment, affecting normal bone physiology and function and reducing 5-year survival rates to 10% and 6%, respectively. To expedite clinical availability of novel and effective bone metastases treatments, reliable and predictive in vitro models are urgently required to screen for novel therapies as current in vitro 2D planar mono-culture models do not accurately predict the clinical efficacy. We herein engineered a novel human in vitro 3D co-culture model based on spheroids to study dynamic cellular quantities of (breast or prostate) cancer cells and human bone marrow stromal cells and screen chemotherapeutic efficacy and specificity of the common anticancer drug cisplatin. Bone metastatic spheroids (BMSs) were formed rapidly within 24 h, while the morphology of breast versus prostate cancer BMS differed in terms of size and circularity upon prolonged culture periods. Prestaining cell types prior to BMS formation enabled confocal imaging and quantitative image analysis of in-spheroid cellular dynamics for up to 7 days of BMS culture. We found that cancer cells in BMS proliferated faster and were less susceptible to cisplatin treatment compared to 2D control cultures. Based on these findings and the versatility of our methodology, BMS represent a feasible 3D in vitro model for screening of new bone cancer metastases therapies.


Conflict of interest statement

All authors declare that they have no conflicts of interest.

Figures

FIGURE 1
FIGURE 1
Bone metastasis spheroid formation with breast or prostate cancer cells. Brightfield images (A) show spheroid formation within 24 h. Spheroid formation was accompanied by a decrease in projected area (B), increase in circularity (C) and decrease in spheroid diameter (D). Prolonged culture periods up to 7 days demonstrated differences between bBMSs and pBMSs regarding projected area (E), circularity (F) and increased diameter (G). Quantitative data are based on spheroids (n = 5) and were statistically analysed using an independent t‐tests at each timepoint; *p < 0.05; **p < 0.01; ***p < 0.001. Scale bar represents 300 μm. bBMS, breast BMS; BMS, bone metastasis spheroid; pBMS, prostate cancer BMS.
FIGURE 2
FIGURE 2
Quantities of hBMSCs and breast or prostate cancer cells in planar co‐cultures and spheroids over time. Fluorescence images of bBMS (A) and pBMS (B) enabled quantification. Planar cultures show only a minimal cancer cell growth for both the cell number (C & E) and relative cell number (D & F), while in BMSs differences of cellular volumes between hBMSCs and cancer cells (G & I) diminish over time, with high relative cellular volumes of cancer cells (H & J) on day 7. Quantitative data of BMSs and planar cultures are based on spheroids (n = 3) or wells (n = 3) and were statistically analysed using one‐way ANOVA with Tukey multiple comparison post hoc test; *p < 0.05 for the cancer cells over time, and per time point with an independent t‐test on the different cell types; *p < 0.05; **p < 0.01; ***p < 0.001. Scalebar represents 300 μm. hBMSCs are coloured green, cancer cells red and nuclei blue. bBMS, breast BMS; BMS, bone metastasis spheroid; hBMSCs, human bone marrow stromal cells; pBMS, prostate cancer BMS.
FIGURE 3
FIGURE 3
Cellular spatial localisation within BMSs. Both in the core (A, C) and in the periphery (B, D) of BMSs, cancer cells became the dominant cell type after 7 days of culture. Quantitative data of the BMSs (n = 3) were statistically analysed using an independent t‐test on each timepoint comparing the different cell types; *p < 0.05; **p < 0.01; ***p < 0.001. BMS, bone metastasis spheroid.
FIGURE 4
FIGURE 4
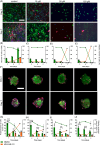
bBMSs show a lower susceptibility to cisplatin treatment (0, 10, 50 and 100 μM) compared to planar co‐cultures with breast cancer cells. Fluorescence images show treated planar cultures with breast cancer cells (A) while subsequent quantification of (relative) cell numbers (B–E) show that 10 μM of cisplatin was therapeutically effective. Fluorescence images show treated bBMSs (F) while subsequent quantification of (relative) cell areas (G–J) show that 50 and 100 μM of cisplatin were more therapeutically effective. Quantitative data are based on spheroids (n = 3) and wells (n = 2) for planar cultures and spheroids were statistically analysed using an independent t‐test on each timepoint; *p < 0.05; **p < 0.01; ***p < 0.001. Scale bar represents 300 μm in fluorescence images of planar cultures, and 100 μm in fluorescence images of spheroids. Cell numbers (planar) and cell areas (spheroids) are represented as bars and use the left y‐axis, while relative cell numbers (planar) and cell areas (spheroids) are represented as lines and use the right y‐axis. bBMS, breast BMS; BMS, bone metastasis spheroid.
FIGURE 5
FIGURE 5
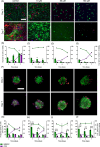
pBMSs show a lower susceptibility to cisplatin treatment (0, 10, 50 and 100 μM) compared to planar co‐cultures with prostate cancer cells. Fluorescence images show treated planar cultures with prostate cancer cells (A) while subsequent quantification of (relative) cell numbers (B–E) show that 10 μM of cisplatin was therapeutically effective. Fluorescence images show treated pBMSs (F) while subsequent quantification of (relative) cell areas (G–J) show that 50 and 100 μM of cisplatin were more therapeutically effective. Quantitative data are based on spheroids (n = 3) and wells (n = 2) for planar cultures and spheroids were statistically analysed using an independent t‐test on each timepoint; *p < 0.05; **p < 0.01; ***p < 0.001. Scale bar represents 300 μm in fluorescence images of planar cultures, and 100 μm in fluorescence images of spheroids. Cell numbers (planar) and cell areas (spheroids) are represented as bars and use the left y‐axis, while relative cell numbers (planar) and cell areas (spheroids) are represented as lines and use the right y‐axis. BMS, bone metastasis spheroid; pBMS, prostate cancer BMS.
FIGURE 6
FIGURE 6
MMP9 measured in supernatant of bBMS (A) and pBMS (B) show a massive cumulative increase over time for the control conditions, while BMS treated with cisplatin (50 μM) show low to no MMP9 expression. Quantitative data based on (n = 3) spheroids and were statistically analysed using an independent t‐test on each timepoint; ***p < 0.001. bBMS, breast BMS; BMS, bone metastasis spheroid.

Similar articles

Cited by

References

    1. Coleman RE, Croucher PI, Padhani AR, et al. Bone metastases. Nat Rev Dis Primers. 2020;6(1):83. - PubMed
    1. Tsukamoto S, Kido A, Tanaka Y, et al. Current overview of treatment for metastatic bone disease. Curr Oncol. 2021;28(5):3347‐3372. - PMC - PubMed
    1. Svensson E, Christiansen CF, Ulrichsen SP, Rørth MR, Sørensen HT. Survival after bone metastasis by primary cancer type: a Danish population‐based cohort study. BMJ Open. 2017;7(9):e016022. - PMC - PubMed
    1. Castaneda M, den Hollander P, Kuburich NA, Rosen JM, Mani SA. Mechanisms of cancer metastasis. Semin Cancer Biol. 2022;87:17‐31. - PubMed
    1. Esposito M, Guise T, Kang Y. The biology of bone metastasis. Cold Spring Harb Perspect Med. 2018;8(6):A031252. - PMC - PubMed

MeSH terms