

Identification of common mechanisms and biomarkers for dermatomyositis and atherosclerosis based on bioinformatics analysis
- PMID: 38899746
- PMCID: PMC11187814
- DOI: 10.1111/srt.13808
Identification of common mechanisms and biomarkers for dermatomyositis and atherosclerosis based on bioinformatics analysis
Abstract
Background: Dermatomyositis (DM) manifests as an autoimmune and inflammatory condition, clinically characterized by subacute progressive proximal muscle weakness, rashes or both along with extramuscular manifestations. Literature indicates that DM shares common risk factors with atherosclerosis (AS), and they often co-occur, yet the etiology and pathogenesis remain to be fully elucidated. This investigation aims to utilize bioinformatics methods to clarify the crucial genes and pathways that influence the pathophysiology of both DM and AS.
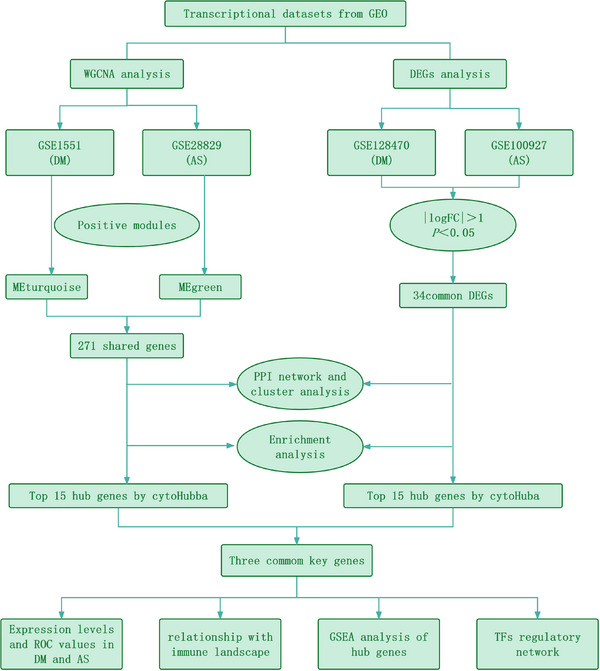
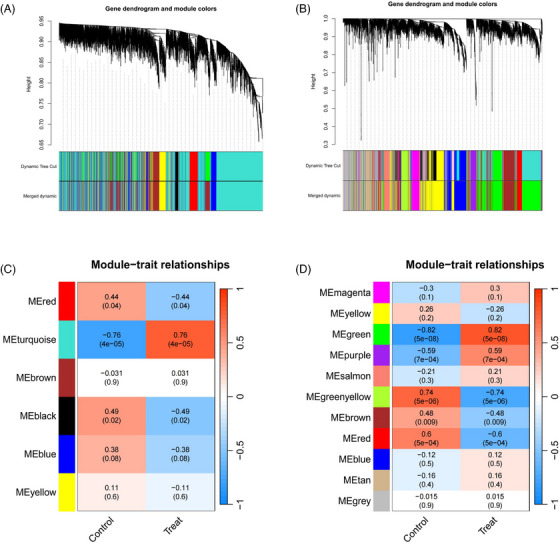
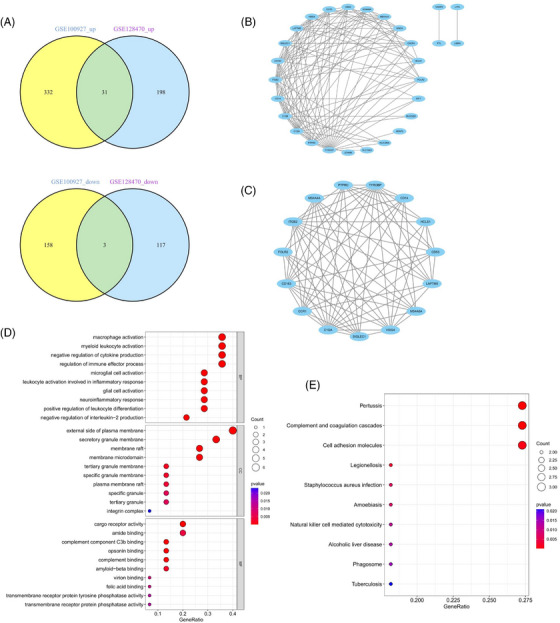
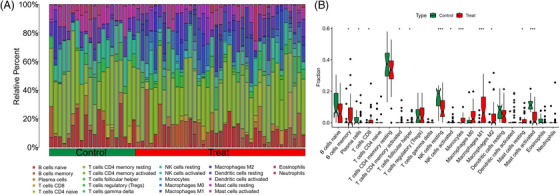
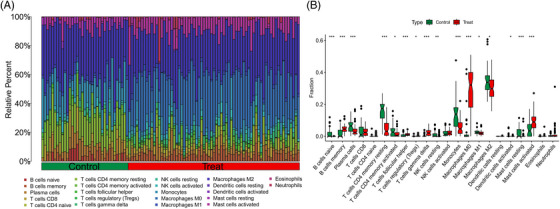
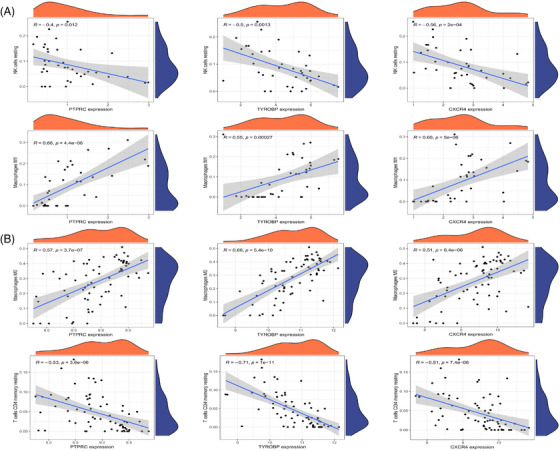
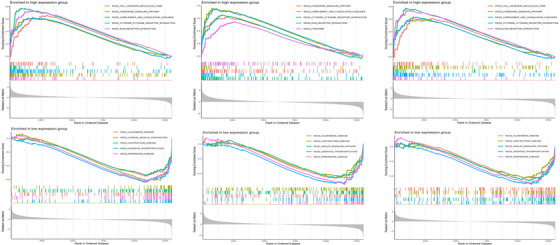
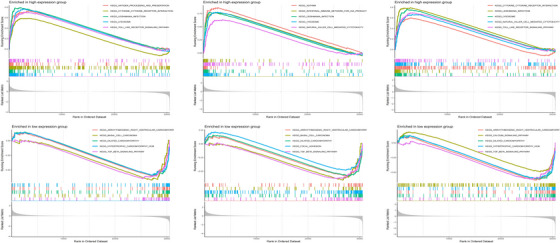
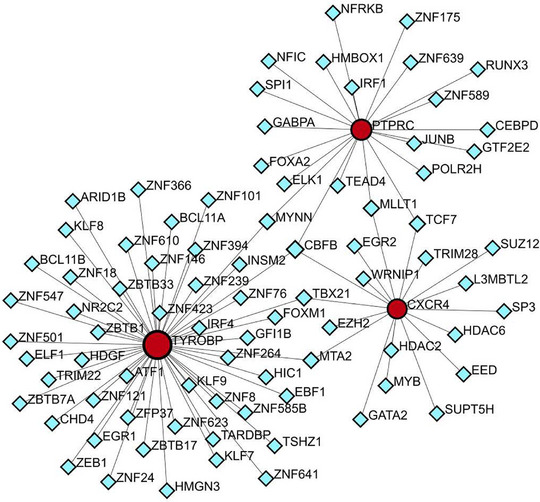
Method: Microarray datasets for DM (GSE128470, GSE1551, GSE143323) and AS (GSE100927, GSE28829, GSE43292) were retrieved from the Gene Expression Omnibus (GEO) database. The weighted gene co-expression network analysis (WGCNA) was used to reveal their co-expressed modules. Differentially expression genes (DEGs) were identified using the "limma" package in R software, and the functions of common DEGs were determined by functional enrichment analysis. A protein-protein interaction (PPI) network was established using the STRING database, with central genes evaluated by the cytoHubba plugin, and validated through external datasets. Immune infiltration analysis of the hub genes was conducted using the CIBERSORT method, along with Gene Set Enrichment Analysis (GSEA). Finally, the NetworkAnalyst platform was employed to examine the transcription factors (TFs) responsible for regulating pivotal crosstalk genes.
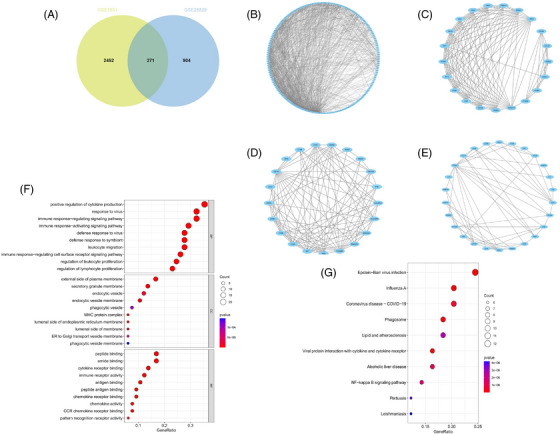
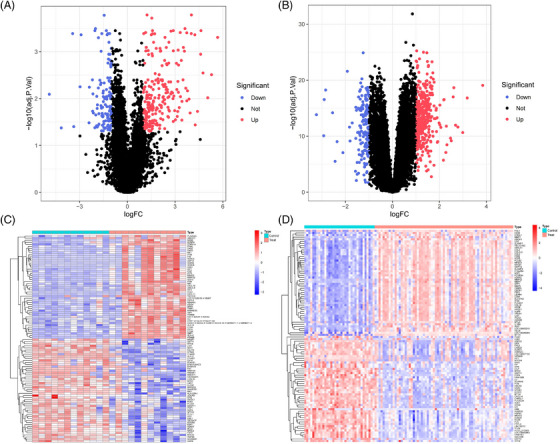
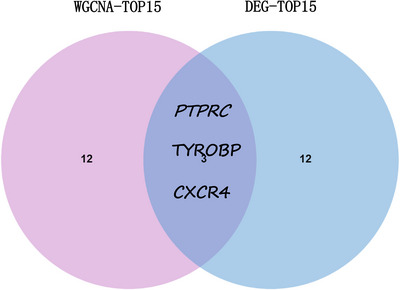
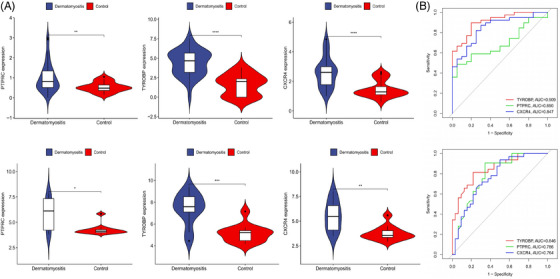
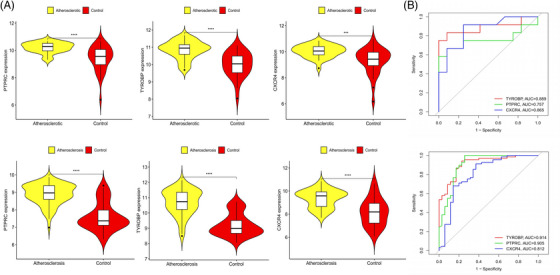
Results: Utilizing WGCNA analysis, a total of 271 overlapping genes were pinpointed. Subsequent DEG analysis revealed 34 genes that are commonly found in both DM and AS, including 31 upregulated genes and 3 downregulated genes. The Degree Centrality algorithm was applied separately to the WGCNA and DEG collections to select the 15 genes with the highest connectivity, and crossing the two gene sets yielded 3 hub genes (PTPRC, TYROBP, CXCR4). Validation with external datasets showed their diagnostic value for DM and AS. Analysis of immune infiltration indicates that lymphocytes and macrophages are significantly associated with the pathogenesis of DM and AS. Moreover, GSEA analysis suggested that the shared genes are enriched in various receptor interactions and multiple cytokines and receptor signaling pathways. We coupled the 3 hub genes with their respective predicted genes, identifying a potential key TF, CBFB, which interacts with all 3 hub genes.
Conclusion: This research utilized comprehensive bioinformatics techniques to explore the shared pathogenesis of DM and AS. The three key genes, including PTPRC, TYROBP, and CXCR4, are related to the pathogenesis of DM and AS. The central genes and their correlations with immune cells may serve as potential diagnostic and therapeutic targets.
Keywords: GEO database; atherosclerosis; bioinformatics analysis; dermatomyositis; expression; gene; immune infiltration analysis.
© 2024 The Author(s). Skin Research and Technology published by John Wiley & Sons Ltd.
Conflict of interest statement
The declaration by the authors confirms that the study was performed without the influence of any business or financial affiliations that might be perceived as a conflict of interest.
Figures
Similar articles
-
Exploring the comorbidity mechanisms between atherosclerosis and hashimoto's thyroiditis based on microarray and single-cell sequencing analysis.Sci Rep. 2025 Jan 13;15(1):1792. doi: 10.1038/s41598-025-85112-0. Sci Rep. 2025. PMID: 39805933 Free PMC article.
-
Integrated analysis and exploration of potential shared gene signatures between carotid atherosclerosis and periodontitis.BMC Med Genomics. 2022 Oct 31;15(1):227. doi: 10.1186/s12920-022-01373-y. BMC Med Genomics. 2022. PMID: 36316672 Free PMC article.
-
Identification of crosstalk genes and immune characteristics between Alzheimer's disease and atherosclerosis.Front Immunol. 2024 Aug 12;15:1443464. doi: 10.3389/fimmu.2024.1443464. eCollection 2024. Front Immunol. 2024. PMID: 39188714 Free PMC article.
-
Bioinformatics and machine learning approaches reveal key genes and underlying molecular mechanisms of atherosclerosis: A review.Medicine (Baltimore). 2024 Aug 2;103(31):e38744. doi: 10.1097/MD.0000000000038744. Medicine (Baltimore). 2024. PMID: 39093811 Free PMC article. Review.
-
Effects of dietary curcumin on gene expression: An analysis of transcriptomic data in mice.Pathol Res Pract. 2024 Nov;263:155653. doi: 10.1016/j.prp.2024.155653. Epub 2024 Oct 11. Pathol Res Pract. 2024. PMID: 39426142 Review.
Cited by
-
Identification of novel biomarkers for childhood-onset systemic lupus erythematosus using machine learning algorithms and immune infiltration analysis.Skin Res Technol. 2024 Aug;30(8):e13880. doi: 10.1111/srt.13880. Skin Res Technol. 2024. PMID: 39081100 Free PMC article.
-
Expression and mechanism of PRDXs family in oral squamous cell carcinoma.Discov Oncol. 2025 Mar 28;16(1):415. doi: 10.1007/s12672-025-01872-1. Discov Oncol. 2025. PMID: 40153088 Free PMC article.
-
Exploring the comorbidity mechanisms between atherosclerosis and hashimoto's thyroiditis based on microarray and single-cell sequencing analysis.Sci Rep. 2025 Jan 13;15(1):1792. doi: 10.1038/s41598-025-85112-0. Sci Rep. 2025. PMID: 39805933 Free PMC article.
-
The diagnostic value and associated molecular mechanism study for fibroblast-related mitochondrial genes on keloid.Skin Res Technol. 2024 Sep;30(9):e70024. doi: 10.1111/srt.70024. Skin Res Technol. 2024. Retraction in: Skin Res Technol. 2025 Jun;31(6):e70188. doi: 10.1111/srt.70188. PMID: 39221860 Free PMC article. Retracted.
-
Identification of shared immune infiltration characteristic molecules in dermatomyositis and nasopharyngeal carcinoma using bioinformatics: Traits in dermatomyositis and nasopharyngeal cancer.Skin Res Technol. 2024 Aug;30(8):e13871. doi: 10.1111/srt.13871. Skin Res Technol. 2024. PMID: 39081134 Free PMC article.
References
-
- DeWane ME, Waldman R, Lu J. Dermatomyositis: clinical features and pathogenesis. J Am Acad Dermatol. 2020;82(2):267‐281. - PubMed
-
- Huard C, Gullà SV, Bennett DV, Coyle AJ, Vleugels RA, Greenberg SA. Correlation of cutaneous disease activity with type 1 interferon gene signature and interferon β in dermatomyositis. Br J Dermatol. 2017;176(5):1224‐1230. - PubMed
-
- Song P, Fang Z, Wang H, et al. Global and regional prevalence, burden, and risk factors for carotid atherosclerosis: a systematic review, meta‐analysis, and modelling study. Lancet Glob Health. 2020;8(5):e721‐e729. - PubMed
MeSH terms
Substances
Grants and funding
- 20232BAB206144/Natural Science Foundation of Jiangxi Province
- GJJ2200946/Science and Technology Research Program of Jiangxi Provincial Department of Education(Translated name)
- zyyzdxk-2023113/NATCM's Project of High-level Construction of Key TCM Disciplines
- 82374367/National Natural Science Foundation of China
- 2024SSY06301/Jiangxi Province Key Laboratory of Traditional Chinese Medicine for Cardiovascular Diseases
LinkOut - more resources
Full Text Sources
Medical
Research Materials
Miscellaneous
