. 2024 Oct 4;14(10):1879-1900.
doi: 10.1158/2159-8290.CD-24-0096.

CD28 Costimulation Augments CAR Signaling in NK Cells via the LCK/CD3ζ/ZAP70 Signaling Axis

Affiliations

CD28 Costimulation Augments CAR Signaling in NK Cells via the LCK/CD3ζ/ZAP70 Signaling Axis

Sunil Acharya et al. Cancer Discov. .

Abstract

Multiple factors in the design of a chimeric antigen receptor (CAR) influence CAR T-cell activity, with costimulatory signals being a key component. Yet, the impact of costimulatory domains on the downstream signaling and subsequent functionality of CAR-engineered natural killer (NK) cells remains largely unexplored. Here, we evaluated the impact of various costimulatory domains on CAR-NK cell activity, using a CD70-targeting CAR. We found that CD28, a costimulatory molecule not inherently present in mature NK cells, significantly enhanced the antitumor efficacy and long-term cytotoxicity of CAR-NK cells both in vitro and in multiple xenograft models of hematologic and solid tumors. Mechanistically, we showed that CD28 linked to CD3ζ creates a platform that recruits critical kinases, such as lymphocyte-specific protein tyrosine kinase (LCK) and zeta-chain-associated protein kinase 70 (ZAP70), initiating a signaling cascade that enhances CAR-NK cell function. Our study provides insights into how CD28 costimulation enhances CAR-NK cell function and supports its incorporation in NK-based CARs for cancer immunotherapy. Significance: We demonstrated that incorporation of the T-cell-centric costimulatory molecule CD28, which is normally absent in mature natural killer (NK) cells, into the chimeric antigen receptor (CAR) construct recruits key kinases including lymphocyte-specific protein tyrosine kinase and zeta-chain-associated protein kinase 70 and results in enhanced CAR-NK cell persistence and sustained antitumor cytotoxicity.


Conflict of interest statement

Disclosure of Conflict of Interest: D.M., R.B., H.R., M.D., E.L., P.B., M.S., P.L., E.J.S., K.R., and The University of Texas MD Anderson Cancer Center have an institutional financial conflict of interest with Takeda Pharmaceutical. D.M., R.B., E.L., E.J.S., K.R., and The University of Texas MD Anderson Cancer Center have an institutional financial conflict of interest with Affimed GmbH. K.R. participates on the Scientific Advisory Board for Avenge Bio, Virogin Biotech, Navan Technologies, Caribou Biosciences, Bit Bio Limited, Replay Holdings, oNKo Innate, and The Alliance for Cancer Gene Therapy ACGT. K.R. is the scientific founder of Syena. E.J.S. has served on the Scientific Advisory Board for Adaptimmune, Axio, Celaid, FibroBiologics, Navan Technologies, New York Blood Center, and Novartis. M.D. participates on the Scientific Advisory Board of Cellsbin. N.V. is a co-founder of CellChorus and AuraVax Therapeutics. The remaining authors declare no competing interests.

Figures

Figure 1.
Figure 1.. CD70 expression in various solid tumors and hematologic malignancies.
A, H-scores for CD70 expression in various human solid cancers based on IHC staining. Red circles denote normal tissue expression while black circles depict cancer tissue expression for each patient sample. Normal tissue samples were not available for all organs. B, Representative images of IHC staining for CD70 in various human solid cancers. H-scores are presented in parentheses next to denoted tissues. HCC, hepatocellular carcinoma. Scale bar= 200 μM. C, CD70 surface expression in samples derived from patients with acute myeloid leukemia (AML) (n=63) analyzed by flow cytometry. Hematopoietic stem cells (HSC) from healthy donors (HD) were used as a control (n=12). CD70 expression was quantified as either mean fluorescence intensity (MFI, left) or as percent positivity (right). For percent positivity analysis, AML samples were further characterized into leukemia stem cells (LSC) or mature blast cells (blasts) using the gating strategy shown in Supplementary Fig. S1C; control samples also included hematopoietic stem and progenitor cells (HSPC) from HD. D, IHC H-scores for CD70 expression in normal lymph node (LN) (n=7) and in lymph node biopsies collected from patients with non-Hodgkin lymphoma (NHL) not treated with CAR19 T-cell therapy (n=13) or after CAR19 T-cell failure (n=14). E, IHC H-scores for CD70 expression in a cohort of 14 patients with Richter’s transformation diffuse large B-cell lymphoma (left). Representative images of CD70 IHC stain with the corresponding H-scores (in parentheses) are shown on the right. Magnification: 400X. P values were determined by unpaired t-test in A, C, D. *P ≤ 0.05, **P ≤ 0.01, ***P ≤ 0.001.
Figure 2.
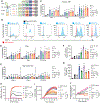
Figure 2.. Generation and in vitro characterization of CAR27 NK cell constructs.
A, Schematic illustration of the different CAR constructs used in the study. TMD, transmembrane domain; ICD, intracellular domain. B, CD70 expression on Karpas, Raji, Raji CD70 KO, K562, UMRC3, GSC20, and BCX010 cell lines as analyzed by flow cytometry. IgG antibody was used as a negative control. C-E, The graph shows the percentage of CAR27 NK cells incorporating different costimulatory domains and their TNF-α (left), IFN-γ (middle), and CD107a (right) response after a 6 h incubation with Karpas 299 (C), Raji (D) or Raji CD70 KO cells (E) at an effector:target (E:T) ratio of 1:1 for 6 hours. Non-transduced (NT) NK and IL-15 NK cells were used as controls. F-G, Bar graphs showing the results of AUC (area under the curve) analysis of Incucyte cytotoxicity assay, where CAR27 NK cells expressing different costimulatory molecules were cocultured with Karpas 299 (F) or Raji (G) cells at an E:T ratio of 1:1 for 18 hours. Karpas 299 or Raji cells alone (no NK cells), and tumor cells cocultured with NT and IL-15 NK cells were used as controls. H, XCELLigence real-time cytotoxicity assay where CAR27 NK cells expressing different costimulatory molecules were cocultured with UMRC3 cells at an E:T ratio of 1:1 for 72 hours. I-J, Quantification graph showing the results of a 3D spheroids killing assay, where NK cells expressing different CAR27 constructs were cultured with GSC20 (I) and BCX010 (J) cells at an E:T ratio of 1:1 for 31 and 68 hours respectively. GSC20 killing was detected using caspase-3/7 green detection reagent, and tumor growth was evaluated for GFP+ BCX010 cells using the green signal. All experiments were performed in triplicate with NK cells from three different cord blood donors, unless mentioned otherwise. Data are represented as mean ± SD. P values were calculated using one-way ANOVA with Dunnett’s multiple comparisons in C-I. ns, not significant, *P ≤ 0.05, **P ≤ 0.01, ***P ≤ 0.001. Black asterisks denote comparison with NT NK cells; grey asterisks denote comparison with IL-15 NK cells.
Figure 3.
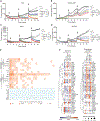
Figure 3.. CAR27–28ζ NK cells maintain their effector function against multiple tumor rechallenge.
A-D, Raji (A), Karpas 299 (B), and THP1 (C) cells expressing mCherry, and SKOV3 cells expressing GFP (D) were cocultured with NK cells expressing the indicated CAR27 constructs, along with NT and IL-15 NK controls, at an E:T ratio of 2:1. Fresh tumor cells (↓) were added to the corresponding cocultures every 3–4 days, without additional CAR-NK cells. Tumor growth was monitored over time using the IncuCyte real-time imaging system, by tracking the red signal (for mCherry cells) or green signal (for GFP cells). Data are represented as mean ± SD. E, Polyfunctionality heatmap of cytokine and chemokine production by CAR27 NK cells expressing different costimulatory domains, and NT and IL-15 NK controls, both at baseline and following stimulation with CD70 antigen. The response was quantified by IsoPlexis assay. The experiment was performed with NK cells from two different donors. F, Heatmap for expression of various NK cell phenotypic and functional markers before coculture with Raji cells (left) and after three re-challenges with Raji cells (right). Expression of each marker was evaluated by CyTOF staining and is represented by color (blue [low] to red [high]) and the size of the circle denoting percent expression. All experiments were performed in triplicate with three different donors, unless mentioned otherwise. P values were calculated using one-way ANOVA with Dunnett’s multiple comparisons in A-D. ns, not significant, *P ≤ 0.05, **P ≤ 0.01, ***P ≤ 0.001. Black asterisks denote comparison with NT NK cells; grey asterisks denote comparison with IL-15 NK cells.
Figure 4.
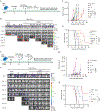
Figure 4.. In vivo antitumor activity of CAR27-expressing NK cells against hematologic malignancies.
A, Schema of the experimental plan for a mouse model of Raji tumor. NSG mice (n=5 mice per condition) were engrafted intravenously (i.v.) with 2 ×10⁴ firefly luciferase labeled Raji cells (Raji-FFluc) via tail vein, followed by a single i.v. infusion of 5 × 10⁶ NK cells. B-C, Bioluminescence (BLI) imaging (B) and quantification graph of the total flux (C) assessing tumor burden in mice over time among the indicated groups. D, Kaplan-Meier curves showing the survival of mice in the indicated groups. E, Schematic representation of the in vivo experimental plan for the THP1 AML model. Mice (n=5 per condition) received a single infusion of the different CAR27 NK cell products two days after tumor cell infusion. F-G, Bioluminescence (BLI) imaging (F) and quantification graph of the total flux (G) assessing tumor burden in mice over time among the indicated groups. H, Kaplan-Meier curves showing the survival of mice in the indicated groups. Data are represented as mean ± SD. For panels (D) and (H), P values were calculated using the Log-rank test. ns, not significant, *P ≤ 0.05, **P ≤ 0.01, ***P ≤ 0.001. Black asterisks denote comparison with NT NK group.
Figure 5.
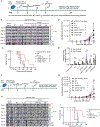
Figure 5.. In vivo antitumor activity of CAR27-expressing NK cells against solid cancers.
A, Schematic illustration of the in vivo experimental plan for the BCX010 metastatic model. NSG mice (n=5 to 8) were engrafted intravenously (i.v.) with 3X10⁵ firefly luciferase labeled BCX010 cells (BCX010-FFluc), and after seven days, a single i.v. infusion of 1.5 × 10⁶ NK cells was performed. B-C, BLI imaging (B) and quantification graph of the radiance (C) assessing tumor burden in mice over time among the indicated groups. P values were calculated using the unpaired t-test at day 47. D, Kaplan-Meier curves showing the survival of mice in the indicated groups. P values were calculated using the log-rank test. E, Graph depicting flow cytometry analysis of the percent positive hCD45 cells (a marker of NK cell engraftment) in the blood of mice ten or twenty days after NK cell infusion in the indicated groups. P values were calculated using the log-rank test and values are shown in the graph. F, Schema of the in vivo experimental design of the SKOV3 model. NSG mice (n=5) were engrafted intraperitonially (i.p.) with 5X10⁵ firefly luciferase labeled SKOV3 cells (SKOV3-FFluc), and after seven days, a single i.p. infusion of 3 × 10⁶ NK cells was given. G-H, BLI imaging (G) and quantification graph of the radiance (H) showing tumor burden in mice over time among the indicated groups. P values were calculated using the unpaired t-test at day 55. I, Kaplan-Meier curves showing the survival of mice in the indicated groups. P values were calculated using the log-rank test. ns, not significant, * P ≤ 0.05. Data are representative as mean ± SD. Black asterisks denote comparison with NT NK group.
Figure 6.
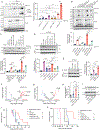
Figure 6.. CD28 co-stimulation promotes CD3ζ phosphorylation via LCK.
A, Whole cell lysates (WCL) from NT NK and various CAR27 NK cell groups were analyzed by western blot for phospho-CD3ζ (Y142; pCD3ζ), total CD3ζ (tCD3ζ). NK cells were unstimulated (–) or stimulated (+) with CD27 antibody (2 μg/ml) for 30 minutes followed by crosslinking with anti-F(ab’)2 antibody for 5 mins. β-actin was used as loading control. Representative blot is shown on left and densitometry analysis quantifying the relative band intensity of CAR-specific pCD3ζ normalized to total tCD3ζ is shown on right. B-C, WCL from NT NK and various CAR27 NK cell groups were analyzed using western blot for pCD3ζ and tCD3ζ (B) or pZAP70 (Y319) and tZAP70 (C). NK cells were either unstimulated (–) or stimulated (+) with CD27 antibody (2 μg/ml) for 30 minutes followed by crosslinking with anti-F(ab’)2 antibody for 5 mins. β-actin served as loading control. Representative blot is shown on top and densitometry analysis quantifying the relative band intensity of phospho proteins normalized to total proteins are shown on bottom. D-E, Immunoblot assay for ZAP70 in WCL from NT NK and various CAR27 NK cell groups following immunoprecipitation (IP) using the CD3ζ antibody (D) or CD28 antibody (E). Representative blots and densitometry analysis quantifying the relative band intensity of ZAP70 after immunoprecipitation normalized to input ZAP70 are shown. For A-E, the two circles in the densitometry analysis graphs represent two independent experiments using two cord blood donors. F-G, Volcano plot showing the relative protein abundance of CAR27-ζ vs. CAR27–28ζ NK cells (F) or CAR27-ζ vs. CAR27–28 NK cells (G) by IP mass spectrometry. H, Graph showing the ratio of pAKT to tAKT in NT NK and various CAR27 NK cell groups by ELISA. NK cells were stimulated with CD27 antibody (2 μg/ml) for 30 minutes followed by crosslinking with anti-F(ab’)2 antibody for 5 mins. I, WCL from NT NK and various CAR27 NK cell groups were analyzed using western blotting for phospho-AKT (S473; pAKT) and total AKT (tAKT). NK cells were stimulated with CD27 antibody (2 μg/ml) for 30 minutes followed by crosslinking with anti-F(ab’)2 antibody for 5 mins. β-actin served as loading control. The densitometry analysis depicts the relative band intensity of pAKT normalized to tAKT; the three circles represent three independent experiments. J-K, Kaplan-Meier curves showing the survival of mice in the indicated groups. Tumor alone, NT, CAR27-ζ and CAR27–28ζ groups are also reported in Figs 5D and 5I. P values were calculated using one-way ANOVA with Dunnett’s multiple comparisons for A, B, C, D, E, H. P values were calculated using the log-rank test for J, K. ns, not significant, *P ≤ 0.05, **P ≤ 0.01, ***P ≤ 0.001. Black asterisks denote comparison with NT NK group for J, K. Data are representative as mean ± SD.

References

    1. Maude SL, Laetsch TW, Buechner J, Rives S, Boyer M, Bittencourt H, et al. Tisagenlecleucel in Children and Young Adults with B-Cell Lymphoblastic Leukemia. N Engl J Med. 2018;378:439–48. - PMC - PubMed
    1. Raje N, Berdeja J, Lin Y, Siegel D, Jagannath S, Madduri D, et al. Anti-BCMA CAR T-Cell Therapy bb2121 in Relapsed or Refractory Multiple Myeloma. N Engl J Med. 2019;380:1726–37. - PMC - PubMed
    1. NS S, LF L, BN L, LL J, MD B, JC A, et al. Axicabtagene Ciloleucel CAR T-Cell Therapy in Refractory Large B-Cell Lymphoma. N Engl J Med. 2017;377:2531–44. - PMC - PubMed
    1. Schuster SJ, Bishop MR, Tam CS, Waller EK, Borchmann P, McGuirk JP, et al. Tisagenlecleucel in Adult Relapsed or Refractory Diffuse Large B-Cell Lymphoma. N Engl J Med. 2018;380:45–56. - PubMed
    1. Cappell KM, Kochenderfer JN. A comparison of chimeric antigen receptors containing CD28 versus 4–1BB costimulatory domains. Nat Rev Clin Oncol. 2021;18:715–27. - PubMed

MeSH terms

Substances