. 2024 Sep;40(9):1299-1314.
doi: 10.1007/s12264-024-01237-8. Epub 2024 Jun 20.

Mapping the Behavioral Signatures of Shank3b Mice in Both Sexes

Affiliations

Mapping the Behavioral Signatures of Shank3b Mice in Both Sexes

Jingjing Liu et al. Neurosci Bull. 2024 Sep.

Abstract

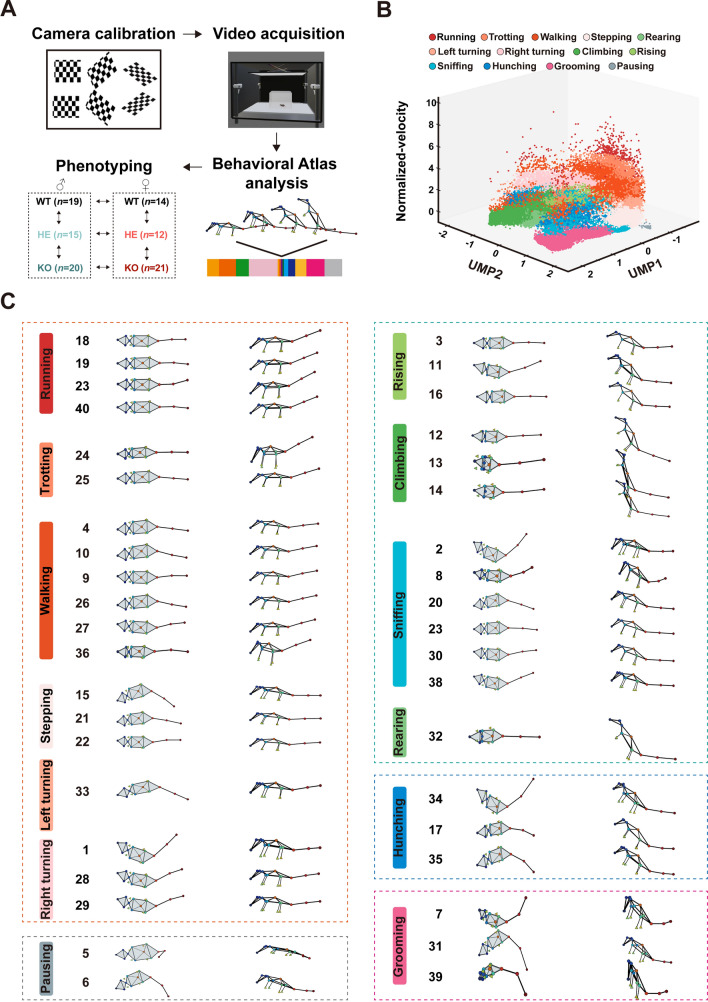
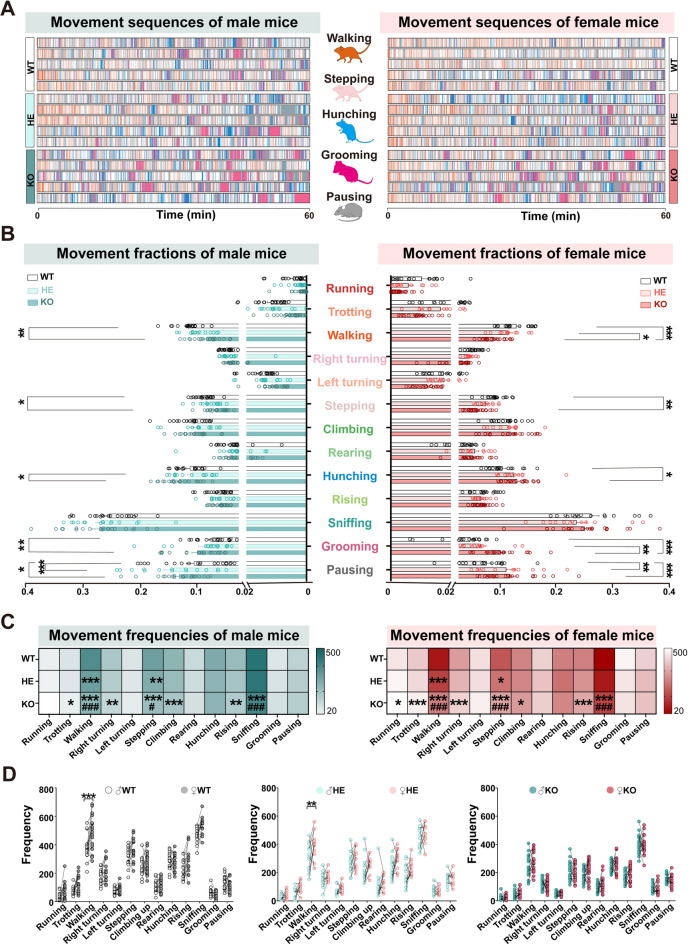
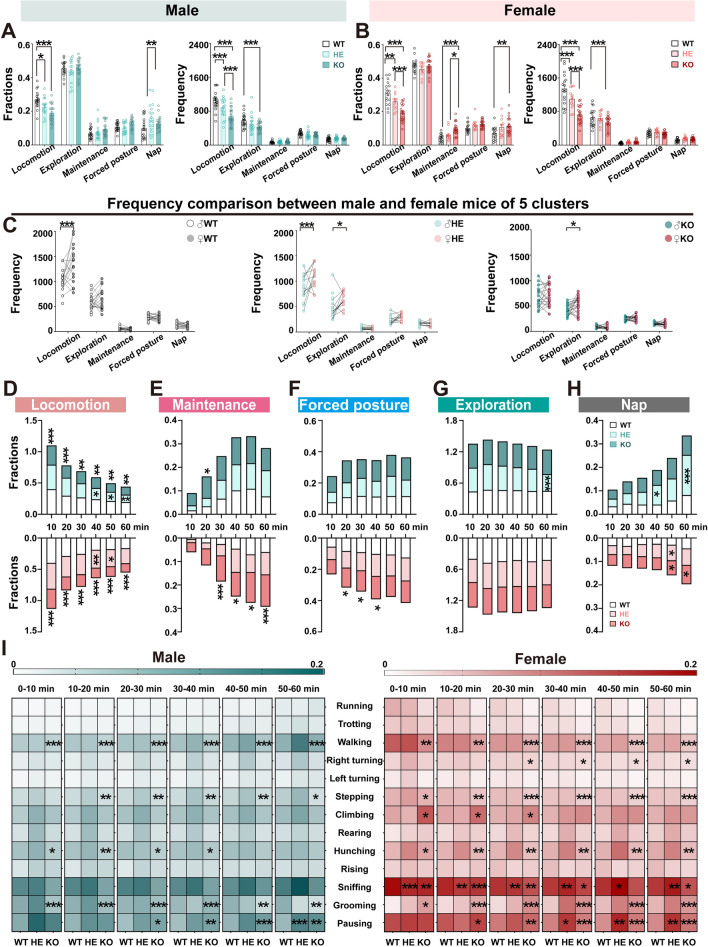
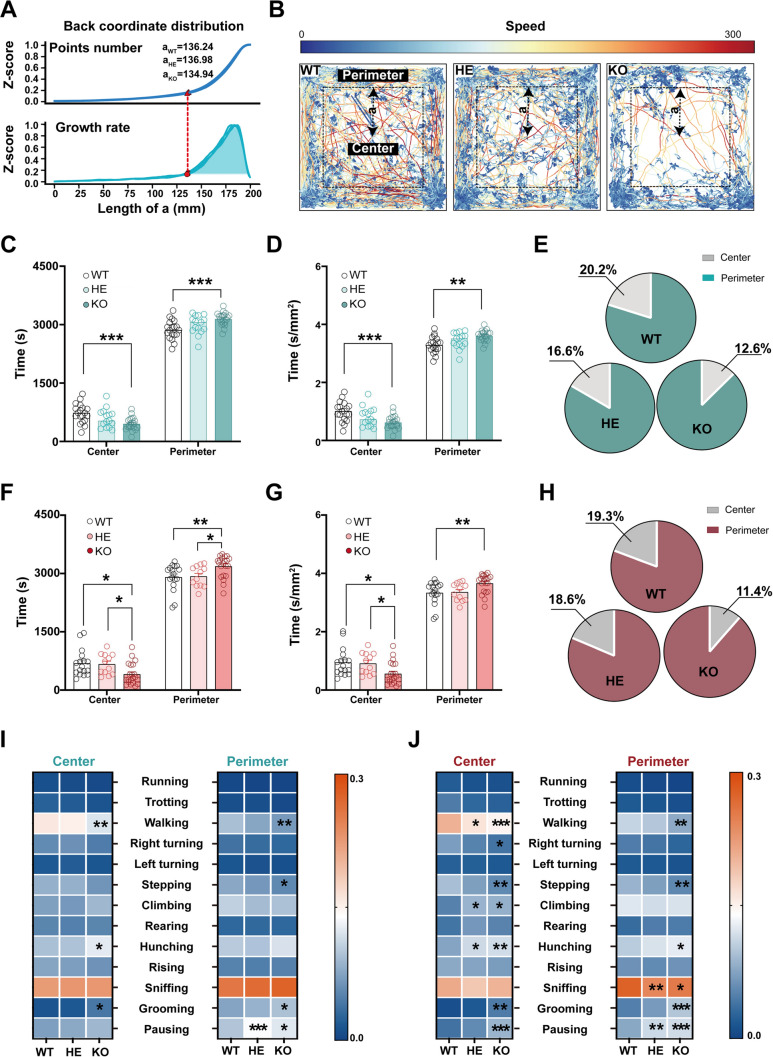
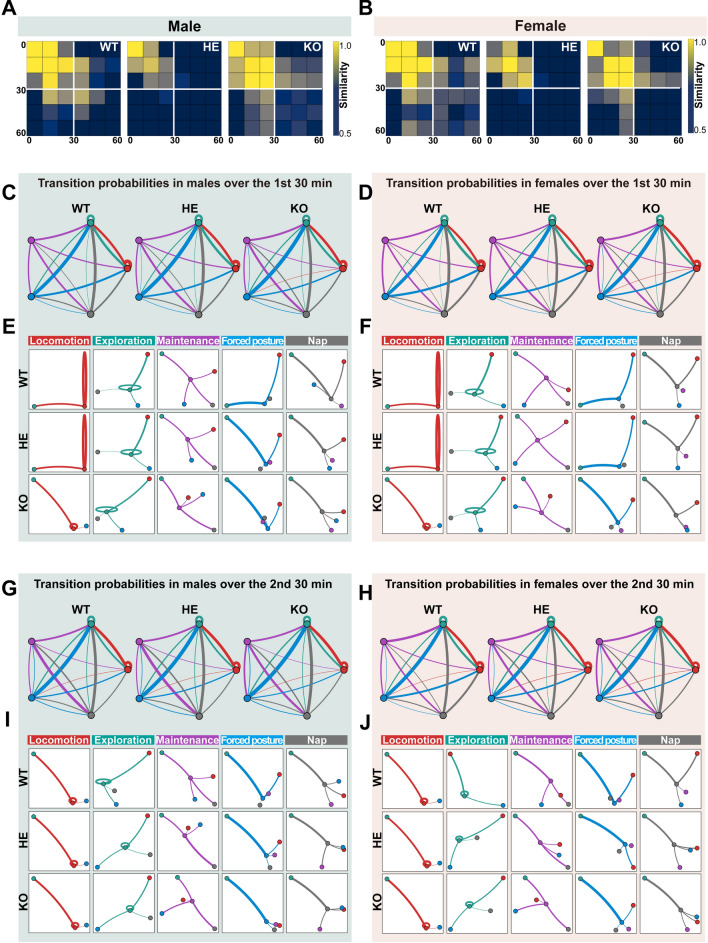
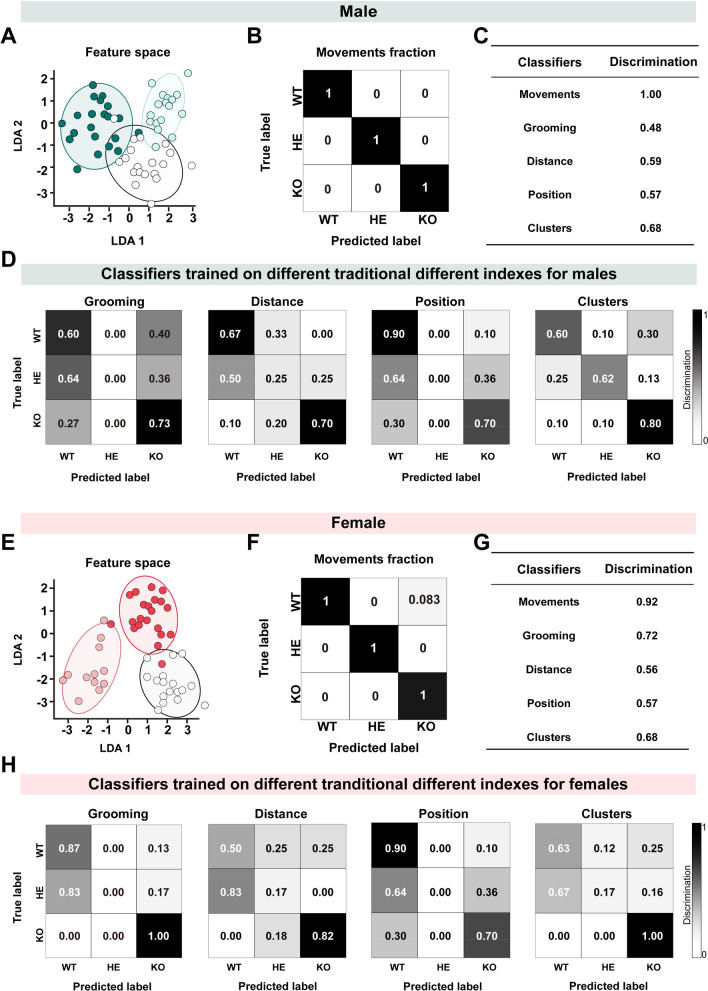
Autism spectrum disorders (ASD) are characterized by social and repetitive abnormalities. Although the ASD mouse model with Shank3b mutations is widely used in ASD research, the behavioral phenotype of this model has not been fully elucidated. Here, a 3D-motion capture system and linear discriminant analysis were used to comprehensively record and analyze the behavioral patterns of male and female Shank3b mutant mice. It was found that both sexes replicated the core and accompanied symptoms of ASD, with significant sex differences. Further, Shank3b heterozygous knockout mice exhibited distinct autistic behaviors, that were significantly different from those those observed in the wild type and homozygous knockout groups. Our findings provide evidence for the inclusion of both sexes and experimental approaches to efficiently characterize heterozygous transgenic models, which are more clinically relevant in autistic studies.

Keywords: Shank3b; 3D animal motion-capture system; Autism; Computational ethology; Sex differences; Spontaneous behavior.


Conflict of interest statement

All authors claim that there are no conflicts of interest.

Figures

Fig. 1
Fig. 1
Movement identification of Shank3b mutant mice in both sexes. A Experimental paradigm for the multi-view video capture system-guided spontaneous behavioral phenotyping in Shank3b mutant mice of both sexes. B Spatiotemporal feature space of behavioral components. Each dot on the 3D scatter plot represents a movement bout (n = 650 bouts), with the thirteen different colors indicating the corresponding thirteen movements. C Landscape of thirteen movements, with the average skeleton of all frames within each movement phenotype shown from both the top and the side view.
Fig. 2
Fig. 2
Distinct spontaneous behavioral characteristics of Shank3b mutant mice in both sexes over 60 min. A Representative ethogram of the five significant different movements among Shank3b WT, HE, and KO mice of both male (left) and female (right) mice (Up, WT; Middle, HE; Down, KO). Five animals were randomly selected in each group. Middle color-coded images correspond to the five different movements, top to bottom: walking (orange), stepping (light pink), hunching (blue), grooming (rose red), and pausing (gray). B Comparison of the fraction of thirteen movements among Shank3b WT, HE, and KO mice (Left: male; KO, deep green; HE, pale green; WT, blank; Right: female; KO, dark red; HE, pink; WT, blank). Middle color-coded labels indicate the movements. Statistics: two-way ANOVA followed by Turkey post hoc multiple comparisons test. C Comparison of the frequency of thirteen movements among Shank3b WT, HE, and KO mice (Left: male; Right: female). Statistics: two-way ANOVA followed by Turkey post hoc multiple comparisons test. D Comparison of the frequency of thirteen movements between male and female Shank3b mutant mice (left: WT; Middle: HE; Right: KO). Statistics: two-way ANOVA followed by Turkey post hoc multiple comparisons test. ***P < 0.001, **P < 0.01, *P < 0.05.
Fig. 3
Fig. 3
Temporal dynamics of clusters exhibited by both male and female Shank3b mutant mice. A–B Comparison of the time fractions and frequency of five clusters among male (A left: fractions; Right: frequency) and female (B left: fractions; Right: frequency) Shank3b WT, HE, and KO mice over 60 min. Statistics: two-way ANOVA followed by Turkey post hoc multiple comparisons test. All data are presented as means ± SEM. C Comparison of the frequency of thirteen movements between male and female Shank3b mutant mice (left: WT; Middle: HE; Right: KO). Statistics: two-way ANOVA followed by Turkey post hoc multiple comparisons test. ***P < 0.001, **P < 0.01, *P < 0.05. D–H Temporal dynamics of the five clusters in male and female Shank3b mutant mice over 60 min, with the sequence from D to H representing locomotion, maintenance, forced posture, exploration, and nap. The upper part of the panels shows the results for male mice (KO, deep green; HE, pale green; WT, blank), while the lower part shows the results for female mice (KO, dark red; HE, pink; WT, blank). Statistics: two-way ANOVA followed by Dunnett post hoc multiple comparisons test. All data are presented as means ± SEM. I Temporal dynamics of the 13 movements in every 10-min interval of male (left) and female (right) Shank3b mutant mice. Statistics: two-way ANOVA followed by Dunnett post hoc multiple comparisons test. ***P < 0.001, **P < 0.01, *P < 0.05.
Fig. 4
Fig. 4
Spatial preference characteristics of movements exhibited by male and female Shank3b mutant mice. A Density distribution curve with back coordinates of three Shank3b mutant mice, the red triangle denoting the starting point of the 90% peak prominence as a division of the heterogeneity occupancy density regions. B Representative images of the spatial preference of three Shank3b mutant mice, with the dotted lines delineating the boundary between the center and the perimeter. C, F Comparison of the time fractions in the center and the perimeter among male (C) and female (F) Shank3b WT, HE, and KO mice in 60 min. D, G Comparison of the time fractions per unit area in the center and the perimeter among male (D) and female (G) Shank3b WT, HE, and KO mice in 60 min. E, H The pie diagrams compare the time percentage of the center and perimeter area for male (E) and female (H) Shank3b WT, HE, and KO mice. I Comparison of movement variation in the center (left) and perimeter (right) areas for male Shank3b WT, HE, and KO Mice Over a 60-min duration. J Comparison of movement variations in the center (left) and perimeter (right) areas for female Shank3b WT, HE, and KO mice over a 60-min duration. ***P < 0.001, **P < 0.01, *P < 0.05.
Fig. 5
Fig. 5
Behavioral transition probabilities of five clusters in male and female Shank3b mutant mice. A, B Behavioral similarities between the first and the second 30-min duration for male (A) and female (B) Shank3b mutant mice (Left: WT; Middle, HE; Right: KO), with each cell represented the overall similarity of each group within the corresponding timeframes. C, D, G, H Behavioral transition probabilities during the first and the second 30 min across the five clusters in male (first: C; second: G) and female (first: D; second: H) Shank3b WT (left), HE (middle), and KO (right) mice. The five color-coded circles denote the five corresponding clusters. The size of each circle indicates the relative occurrence probability of each cluster, with larger circles denoting higher probabilities. The connecting lines among every two circles represent the transition probabilities of the two clusters, with greater line thickness indicating a higher transition rate. Lines around the circles indicate the self-transition probability based on the movements grouped into the clusters. E, F, I, J Connection properties of each cluster in betweenness centrality for both male (first: E; second: I) and female (first: F; second: J) Shank3b WT, HE, and KO mice during the second 30 min. The magnitude of transition probabilities is symbolized by the length and/or thickness of the lines linking two nodes, with greater length and/or thickness denoting higher probabilities. All lines representing transition probabilities of less than 0.05 are intentionally omitted.
Fig. 6
Fig. 6
Behavioral dissimilarity among Shank3b WT, HE, and WT across both sexes. A, E Low-dimensional representation of the thirteen movements in male (A) (WT, blank; HE, pale green; KO, deep green) and female (E) (WT, blank; HE, pink; KO, dark red) Shank3b mutant mice using LDA linear model. B, F Normalized classification matrices by all thirteen movements (across rows and columns) for distinguishing male (B) and female (F) Shank3b WT, HE, and KO mice. The numerical values within the matrices represent the count of true and/or predicted instances for each group. The color bar is shared by all matrices. The values, ranging from 0 (depicted in white) to 1 (depicted in black) indicate increasing discrimination. An ideal classifier performance corresponds to a diagonal black with otherwise white fields (Discrimination of 1). C, G The discrimination of different classifiers for male (C) and female (G) Shank3b WT, HE, and KO mice. D, H Normalized classification matrices by traditional classifiers for distinguishing male (D) and female (H) Shank3b WT, HE, and KO mice.

Similar articles

Cited by

References

    1. Battle DE. Diagnostic and statistical manual of mental disorders (DSM). CoDAS 2013, 25: 191–192. - PubMed
    1. Grove J, Ripke S, Als TD, Mattheisen M, Walters RK, Won H. Identification of common genetic risk variants for autism spectrum disorder. Nat Genet 2019, 51: 431–444. 10.1038/s41588-019-0344-8 - DOI - PMC - PubMed
    1. Maenner MJ, Shaw KA, Bakian AV, Bilder DA, Durkin MS, Esler A, et al. Prevalence and characteristics of autism spectrum disorder among children aged 8 years - autism and developmental disabilities monitoring network, 11 sites, United States, 2018. MMWR Surveill Summ 2021, 70: 1–16. 10.15585/mmwr.ss7011a1 - DOI - PMC - PubMed
    1. Fombonne E. Epidemiology of pervasive developmental disorders. Pediatr Res 2009, 65: 591–598. 10.1203/PDR.0b013e31819e7203 - DOI - PubMed
    1. Russell G, Steer C, Golding J. Social and demographic factors that influence the diagnosis of autistic spectrum disorders. Soc Psychiatry Psychiatr Epidemiol 2011, 46: 1283–1293. 10.1007/s00127-010-0294-z - DOI - PubMed