Multicenter Study
. 2024 Jul 16;332(3):204-213.
doi: 10.1001/jama.2024.8599.

A Clinical Diagnostic Test for Calcium Release Deficiency Syndrome

Affiliations
Multicenter Study

A Clinical Diagnostic Test for Calcium Release Deficiency Syndrome

Mingke Ni et al. JAMA. .

Abstract

Importance: Sudden death and cardiac arrest frequently occur without explanation, even after a thorough clinical evaluation. Calcium release deficiency syndrome (CRDS), a life-threatening genetic arrhythmia syndrome, is undetectable with standard testing and leads to unexplained cardiac arrest.

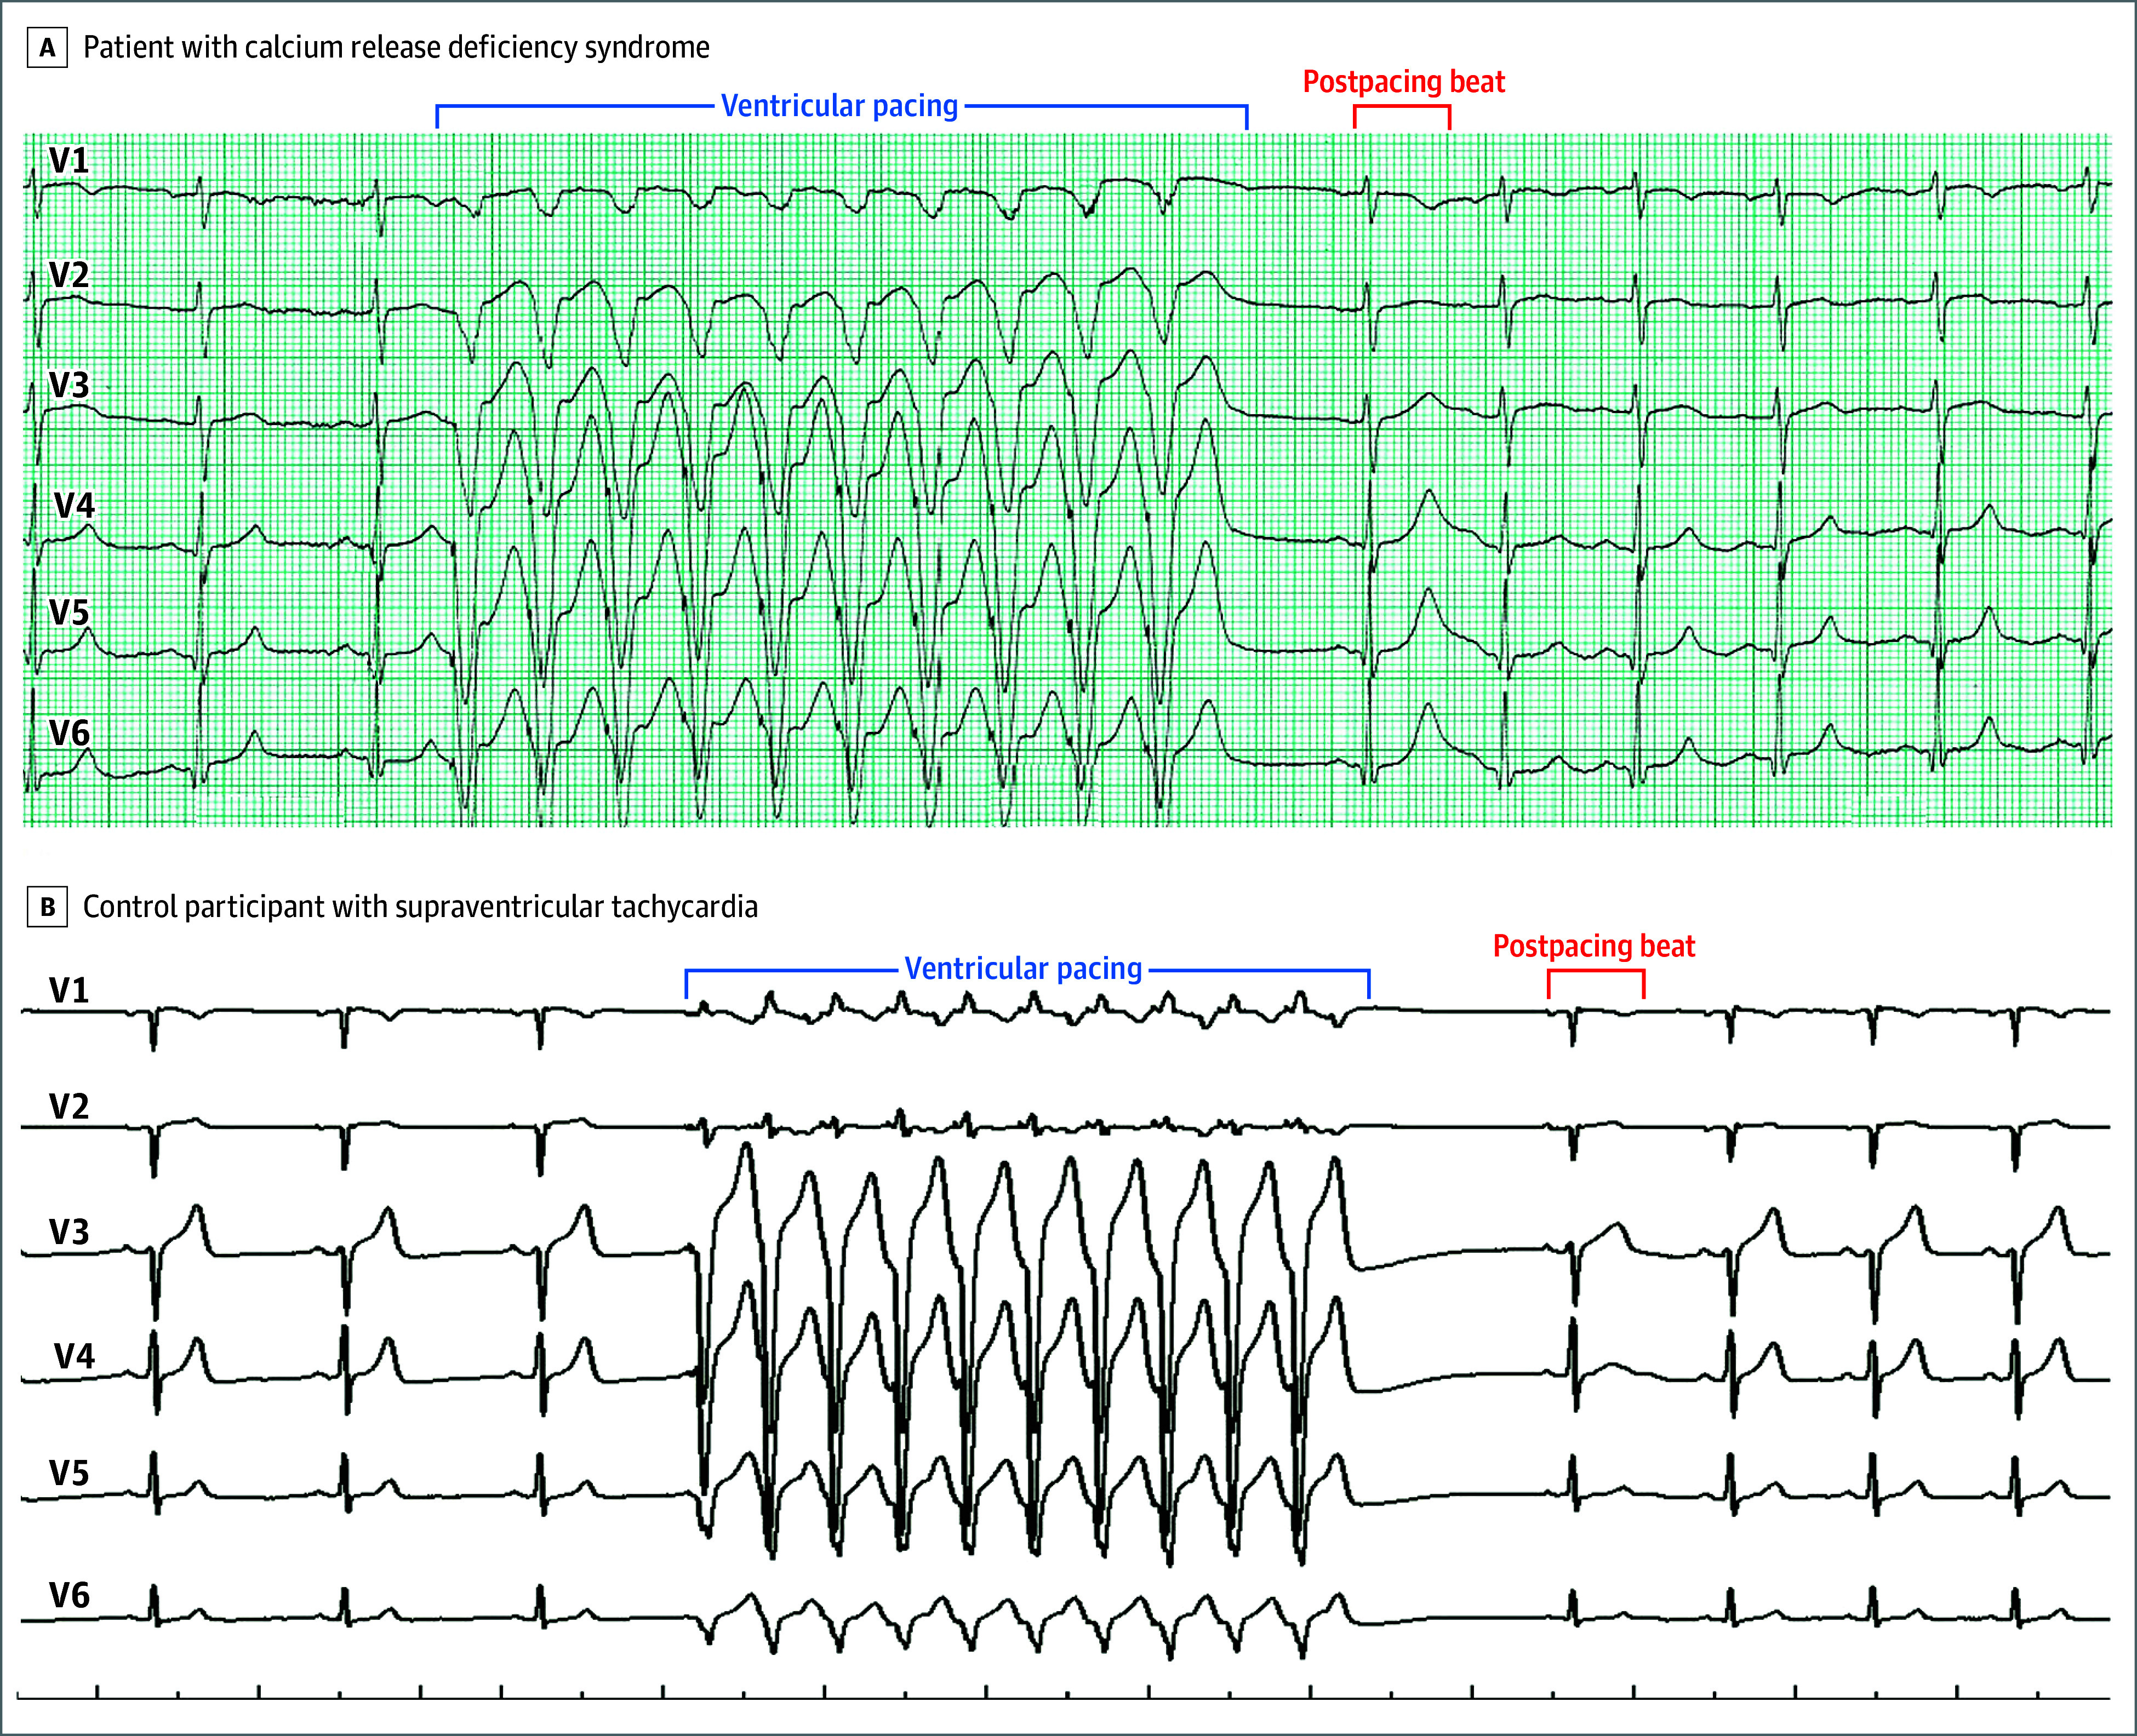
Objective: To explore the cardiac repolarization response on an electrocardiogram after brief tachycardia and a pause as a clinical diagnostic test for CRDS.

Design, setting, and participants: An international, multicenter, case-control study including individual cases of CRDS, 3 patient control groups (individuals with suspected supraventricular tachycardia; survivors of unexplained cardiac arrest [UCA]; and individuals with genotype-positive catecholaminergic polymorphic ventricular tachycardia [CPVT]), and genetic mouse models (CRDS, wild type, and CPVT were used to define the cellular mechanism) conducted at 10 centers in 7 countries. Patient tracings were recorded between June 2005 and December 2023, and the analyses were performed from April 2023 to December 2023.

Intervention: Brief tachycardia and a subsequent pause (either spontaneous or mediated through cardiac pacing).

Main outcomes and measures: Change in QT interval and change in T-wave amplitude (defined as the difference between their absolute values on the postpause sinus beat and the last beat prior to tachycardia).

Results: Among 10 case patients with CRDS, 45 control patients with suspected supraventricular tachycardia, 10 control patients who experienced UCA, and 3 control patients with genotype-positive CPVT, the median change in T-wave amplitude on the postpause sinus beat (after brief ventricular tachycardia at ≥150 beats/min) was higher in patients with CRDS (P < .001). The smallest change in T-wave amplitude was 0.250 mV for a CRDS case patient compared with the largest change in T-wave amplitude of 0.160 mV for a control patient, indicating 100% discrimination. Although the median change in QT interval was longer in CRDS cases (P = .002), an overlap between the cases and controls was present. The genetic mouse models recapitulated the findings observed in humans and suggested the repolarization response was secondary to a pathologically large systolic release of calcium from the sarcoplasmic reticulum.

Conclusions and relevance: There is a unique repolarization response on an electrocardiogram after provocation with brief tachycardia and a subsequent pause in CRDS cases and mouse models, which is absent from the controls. If these findings are confirmed in larger studies, this easy to perform maneuver may serve as an effective clinical diagnostic test for CRDS and become an important part of the evaluation of cardiac arrest.

Trial registration: ClinicalTrials.gov NCT06188689.


Conflict of interest statement

Conflict of Interest Disclosures: Dr Tadros reported receiving grants from BMS Canada. Dr Christiansen reported receiving personal fees from Amgen Inc. Dr Roston reported receiving personal fees from Cardurion Pharmaceuticals. Dr Giudicessi reported serving as a consultant for Avidity Biosciences and as a principal investigator for clinical trials sponsored by Tenaya Therapeutics. Dr Scheinman reported receiving personal fees from Biosense Webster, ZOLL Medical, and Johnson & Johnson. Dr Ackerman reported receiving personal fees from Abbott; having equity in and receiving royalties from Alivecor, Anumana, ARMGO Pharma, Pfizer, and Thryv Therapeutics; and receiving personal fees from BioMarin Pharmaceuticals, Boston Scientific, Bristol Myers Squibb, Daichii Sankyo, Illumina, Invitae, Medtronic, Tenaya, and UpToDate. Dr Watkins reported receiving personal fees from Cytokinetics, BioMarin, and BridgeBio. Dr Jensen reported receiving grants from Novo Nordisk Foundation. No other disclosures were reported.

Figures

Figure 1.
Figure 1.. Representative Electrocardiographic Tracings of the Cardiac Repolarization Response to Brief Tachycardia and a Pause in a Patient With Calcium Release Deficiency Syndrome and in a Control Patient With Supraventricular Tachycardia
A, In a patient with a confirmed RYR2 loss-of-function variant (RYR2-p.T4196I), a tall and broad T wave was observed in the beat immediately after ventricular pacing. B, The control participant had a structurally normal heart. Precordial leads alone are shown for ease of illustration; however, the finding was also observed in the limb leads (12-lead electrocardiograms appear in eFigure 4 in Supplement 1).
Figure 2.
Figure 2.. Comparison of QT Intervals and T-Wave Amplitudes on the Sinus Beat After Brief Tachycardia and a Pause in Patients With Calcium Release Deficiency Syndrome and in Patients in 3 Control Groups
The ventricular rate was 150 beats/min or higher. The x-axis spacing represents jitter. The horizontal lines in the boxes represent the medians; the orange diamonds, the means; the upper edge of the boxes, quartile 3; the lower edge of the boxes, quartile 1; the whiskers, the upper and lower extreme values; and the open circles, the outlier values. For B, the data presented reflect the postpause change in the QT interval from the prepacing QT interval. For D, the data presented reflect the postpause change in T-wave amplitude from the prepacing T-wave amplitude. The electrocardiographic measurements were performed using scaled electronic calipers on digitalized or scanned tracings by an electrophysiologist (Z.D.) blinded to case status. CPVT indicates catecholaminergic polymorphic ventricular tachycardia; CRDS, calcium release deficiency syndrome; SVT, supraventricular tachycardia; and UCA, unexplained cardiac arrest.
Figure 3.
Figure 3.. Repolarization Responses to Long-Burst, Long-Pause Electrical Stimulation in Mouse Models
The electrocardiogram traces were chosen based on the mean values of the corresponding datasets. Intracardiac pacing was performed with a catheter inserted through the internal jugular vein and advanced into the right ventricle. A long burst (20 beats at an interval of 60 ms) was used to drive more extracellular calcium into cardiomyocytes. A long pause (120 ms) was used to substantially load calcium into the sarcoplasmic reticulum. The QT interval of the signal complex after the pause was determined manually by placing cursors on the beginning of the QRS complex and on the end of the T wave.
Figure 4.
Figure 4.. Effect of Long-Burst, Long-Pause Electrical Stimulation on Calcium Transient Amplitude in Mouse Models
The images were chosen based on the mean values of the corresponding datasets. The hearts were intact. The scale bar (50 µm) depicts the length of the confocal scanning line used for calcium imaging of the heart. The short black bands indicate cell boundaries. The red color indicates the fluorescence of the calcium indicator (Rhod2-AM), whose intensity reflects the level of calcium. F0 indicates baseline fluorescence intensity just before the first postpause stimulation; F1, peak fluorescence intensity during 8-Hz stimulation; and F2, peak fluorescence intensity of the first postpause stimulation. ΔF indicates a given fluorescence intensity minus the baseline fluorescence (F-F0); ΔF1, F1 minus F0; and ΔF2, F2 minus F0. A, For the RyR2 wild-type control mouse heart model, the median ΔF1/F0 = 0.85 (IQR, 0.74-0.86) and the mean ΔF2/F0 = 1.07 (SD, 0.20). B, For the RyR2-D4646A+/− calcium release deficiency syndrome mouse heart model, the mean ΔF1/F0 = 0.88 (SD, 0.04) and the mean ΔF2/F0 = 1.48 (SD, 0.14). C, For the RyR2-R4496C+/− catecholaminergic polymorphic ventricular tachycardia mouse heart model, the mean ΔF1/F0 = 0.75 (SD, 0.09) and the mean ΔF2/F0 = 0.85 (SD, 0.12).

Comment on

References

    1. Marijon E, Narayanan K, Smith K, et al. . The Lancet commission to reduce the global burden of sudden cardiac death: a call for multidisciplinary action. Lancet. 2023;402(10405):883-936. doi:10.1016/S0140-6736(23)00875-9 - DOI - PubMed
    1. Stecker EC, Reinier K, Marijon E, et al. . Public health burden of sudden cardiac death in the United States. Circ Arrhythm Electrophysiol. 2014;7(2):212-217. doi:10.1161/CIRCEP.113.001034 - DOI - PMC - PubMed
    1. Benjamin EJ, Muntner P, Alonso A, et al. ; American Heart Association Council on Epidemiology and Prevention Statistics Committee and Stroke Statistics Subcommittee . Heart disease and stroke statistics—2019 update: a report from the American Heart Association. Circulation. 2019;139(10):e56-e528. doi:10.1161/CIR.0000000000000659 - DOI - PubMed
    1. Stiles MK, Wilde AAM, Abrams DJ, et al. . 2020 APHRS/HRS expert consensus statement on the investigation of decedents with sudden unexplained death and patients with sudden cardiac arrest, and of their families. Heart Rhythm. 2021;18(1):e1-e50. doi:10.1016/j.hrthm.2020.10.010 - DOI - PMC - PubMed
    1. Krahn AD, Tfelt-Hansen J, Tadros R, Steinberg C, Semsarian C, Han HC. Latent causes of sudden cardiac arrest. JACC Clin Electrophysiol. 2022;8(6):806-821. doi:10.1016/j.jacep.2021.12.014 - DOI - PubMed

MeSH terms

Substances

Associated data

Grants and funding