. 2024 Jul 23;43(7):114376.
doi: 10.1016/j.celrep.2024.114376. Epub 2024 Jun 18.

Transcriptional determinism and stochasticity contribute to the complexity of autism-associated SHANK family genes

Affiliations

Transcriptional determinism and stochasticity contribute to the complexity of autism-associated SHANK family genes

Xiaona Lu et al. Cell Rep. .

Abstract

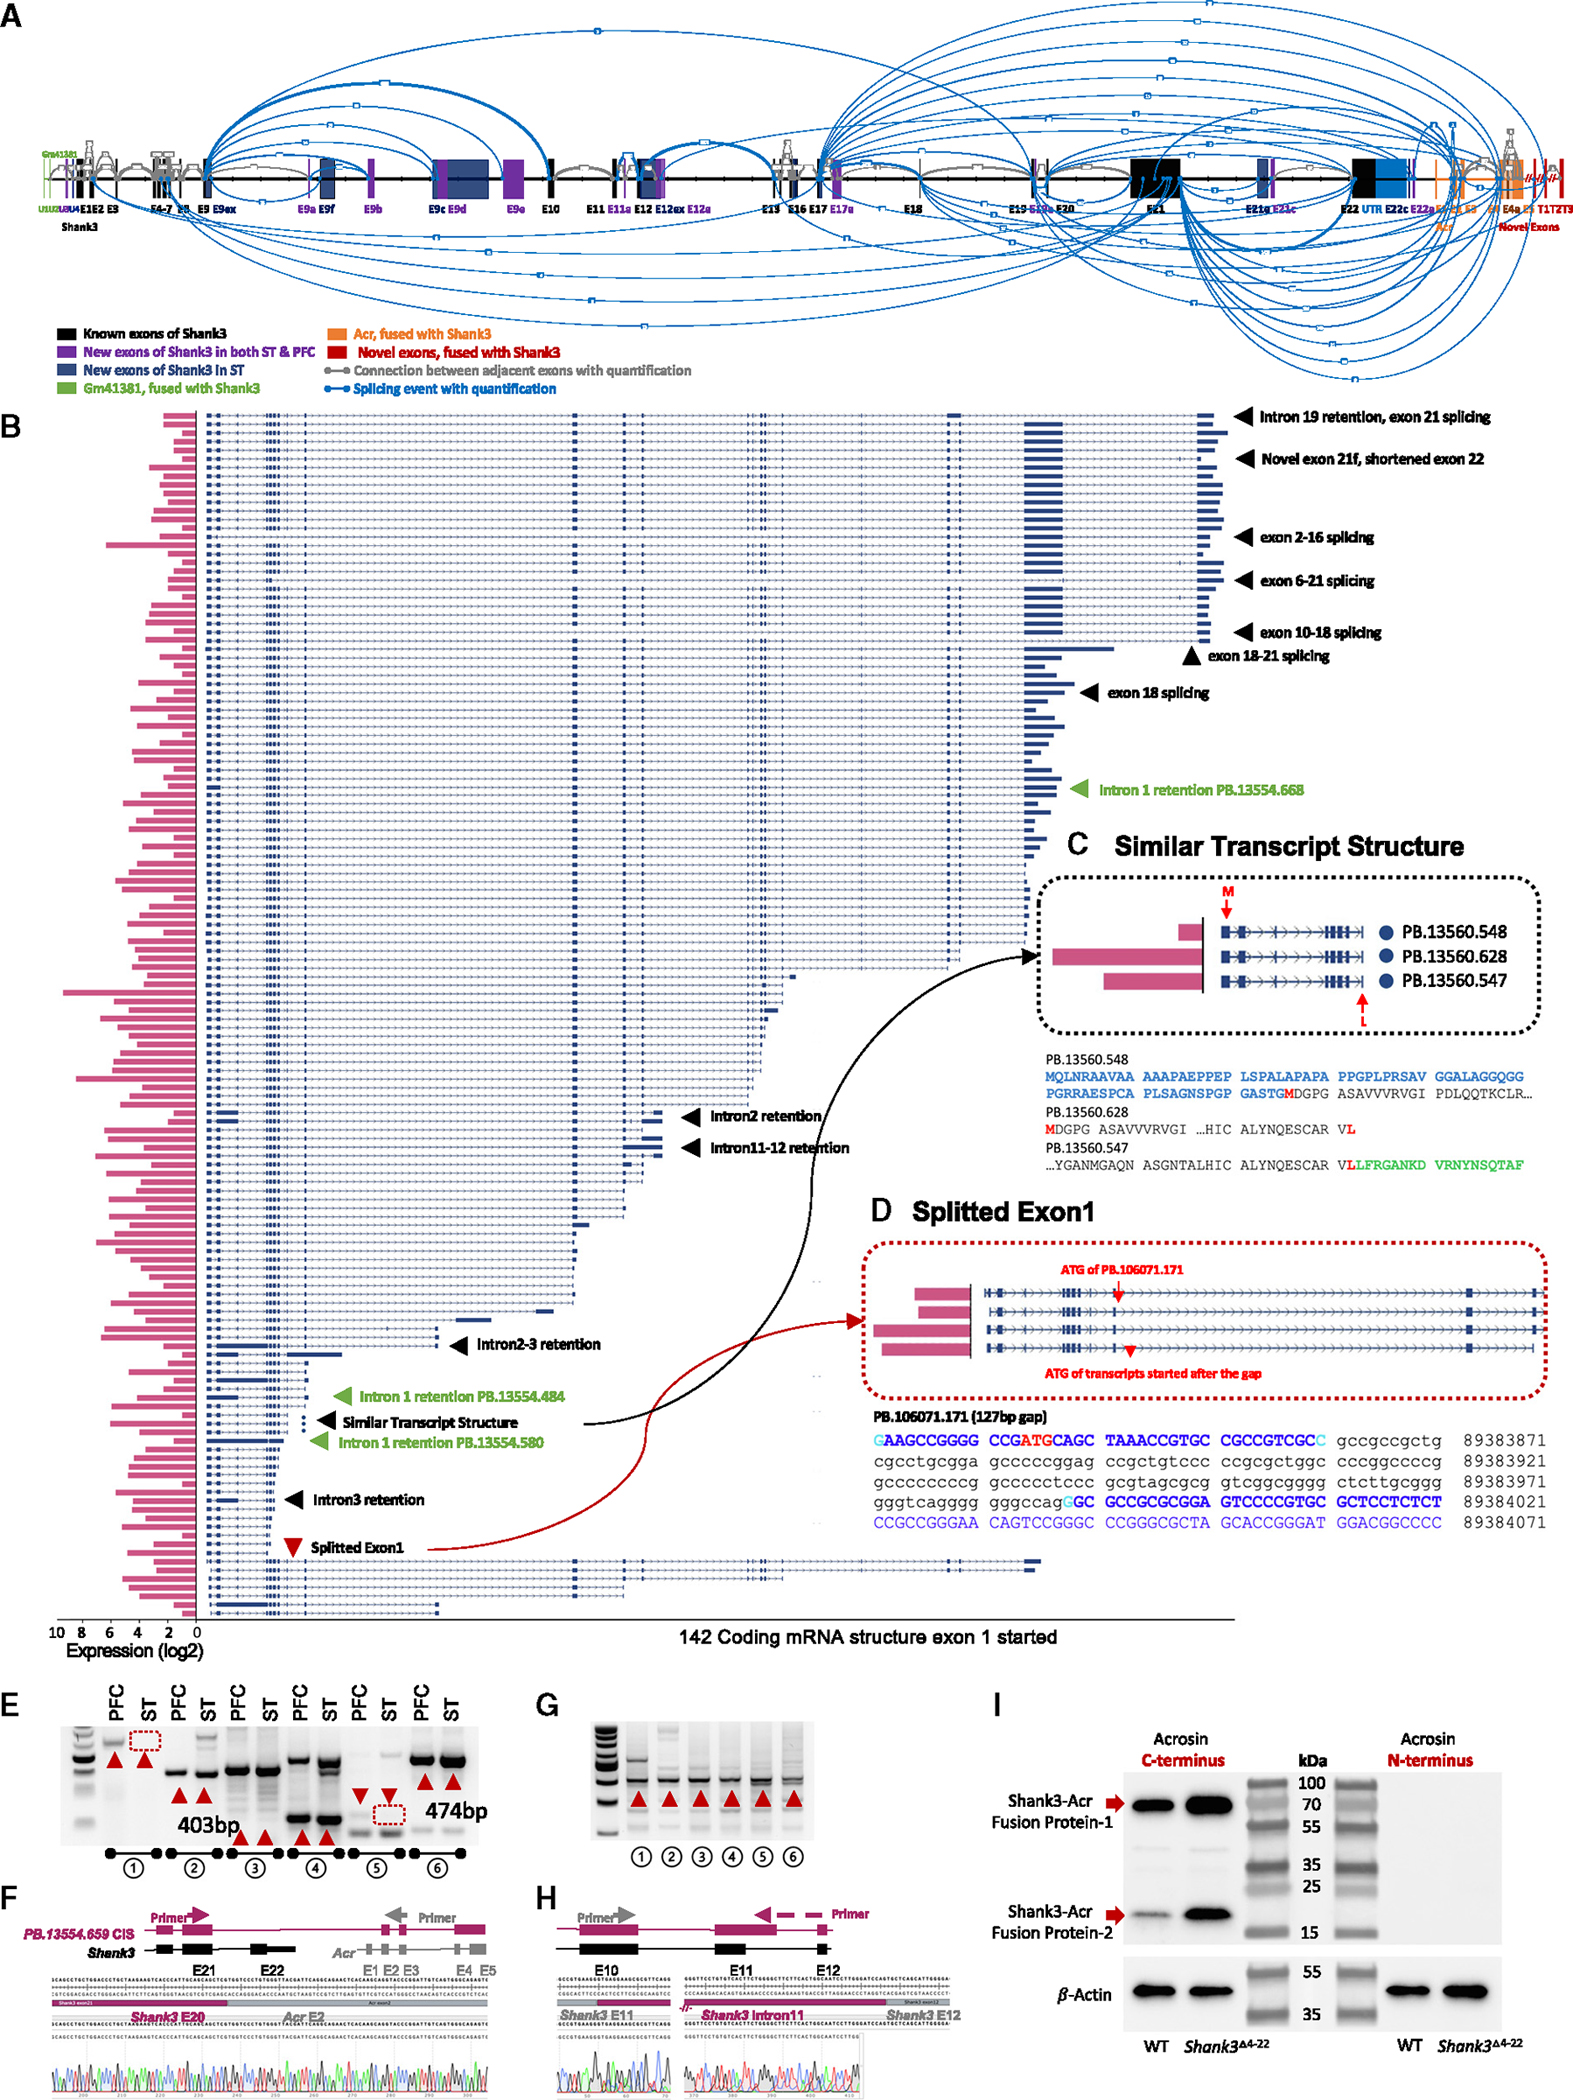
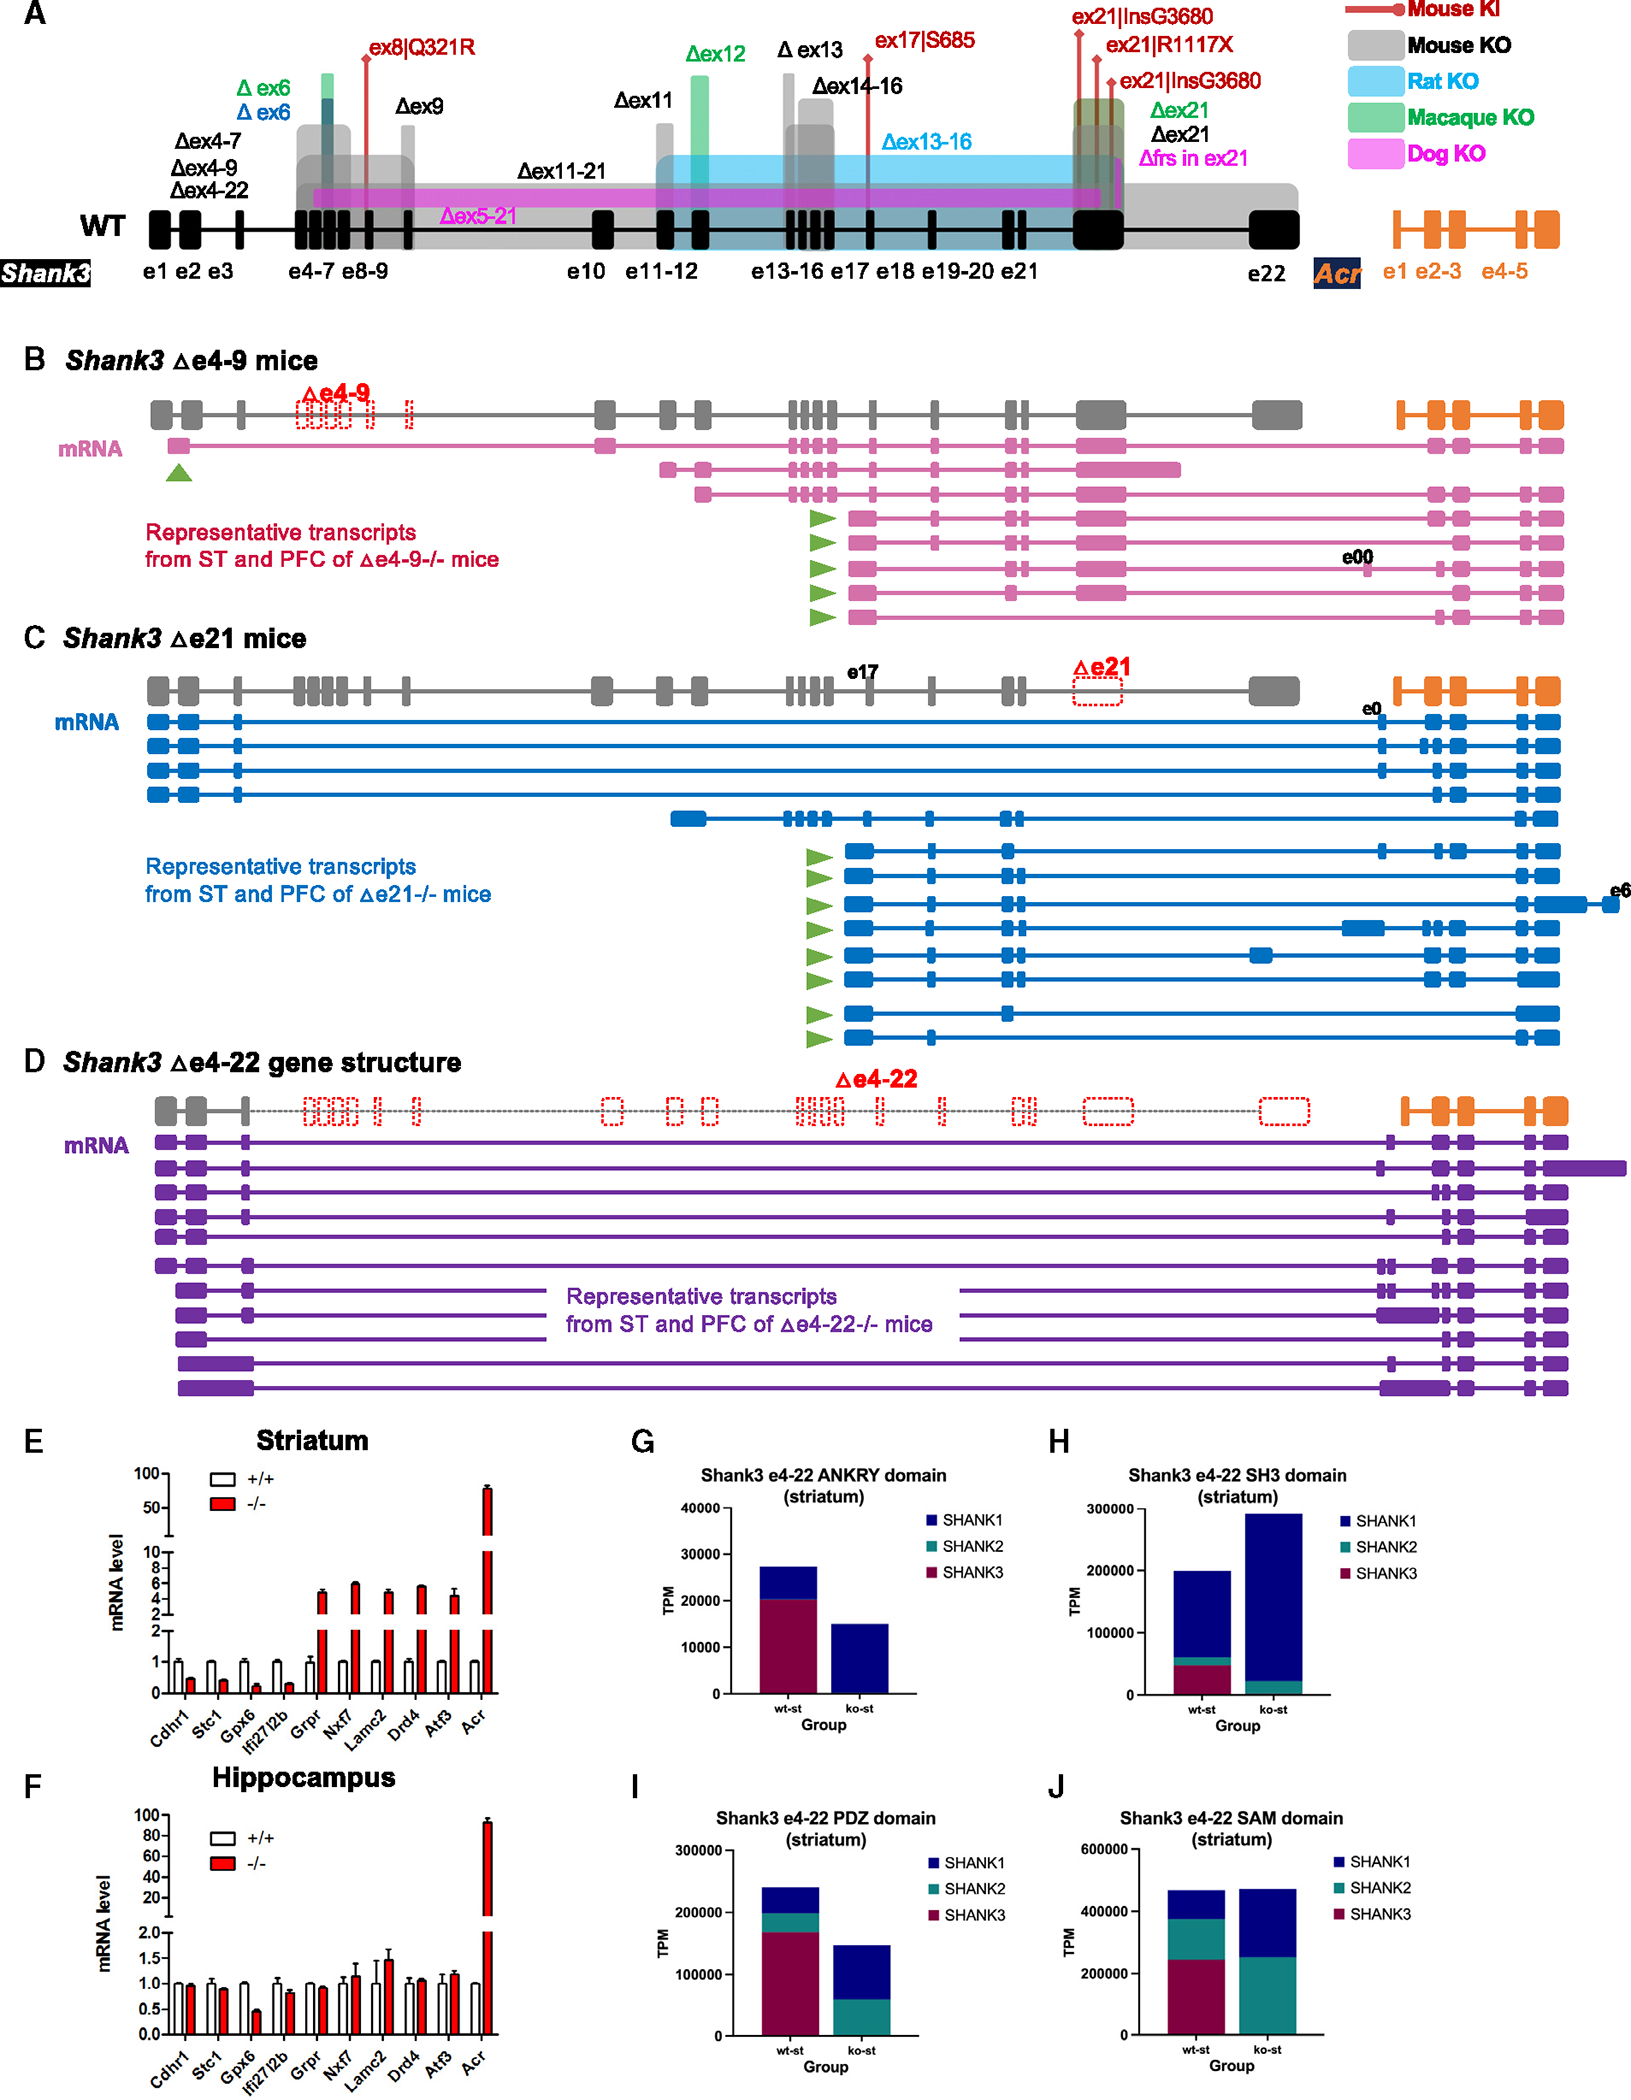
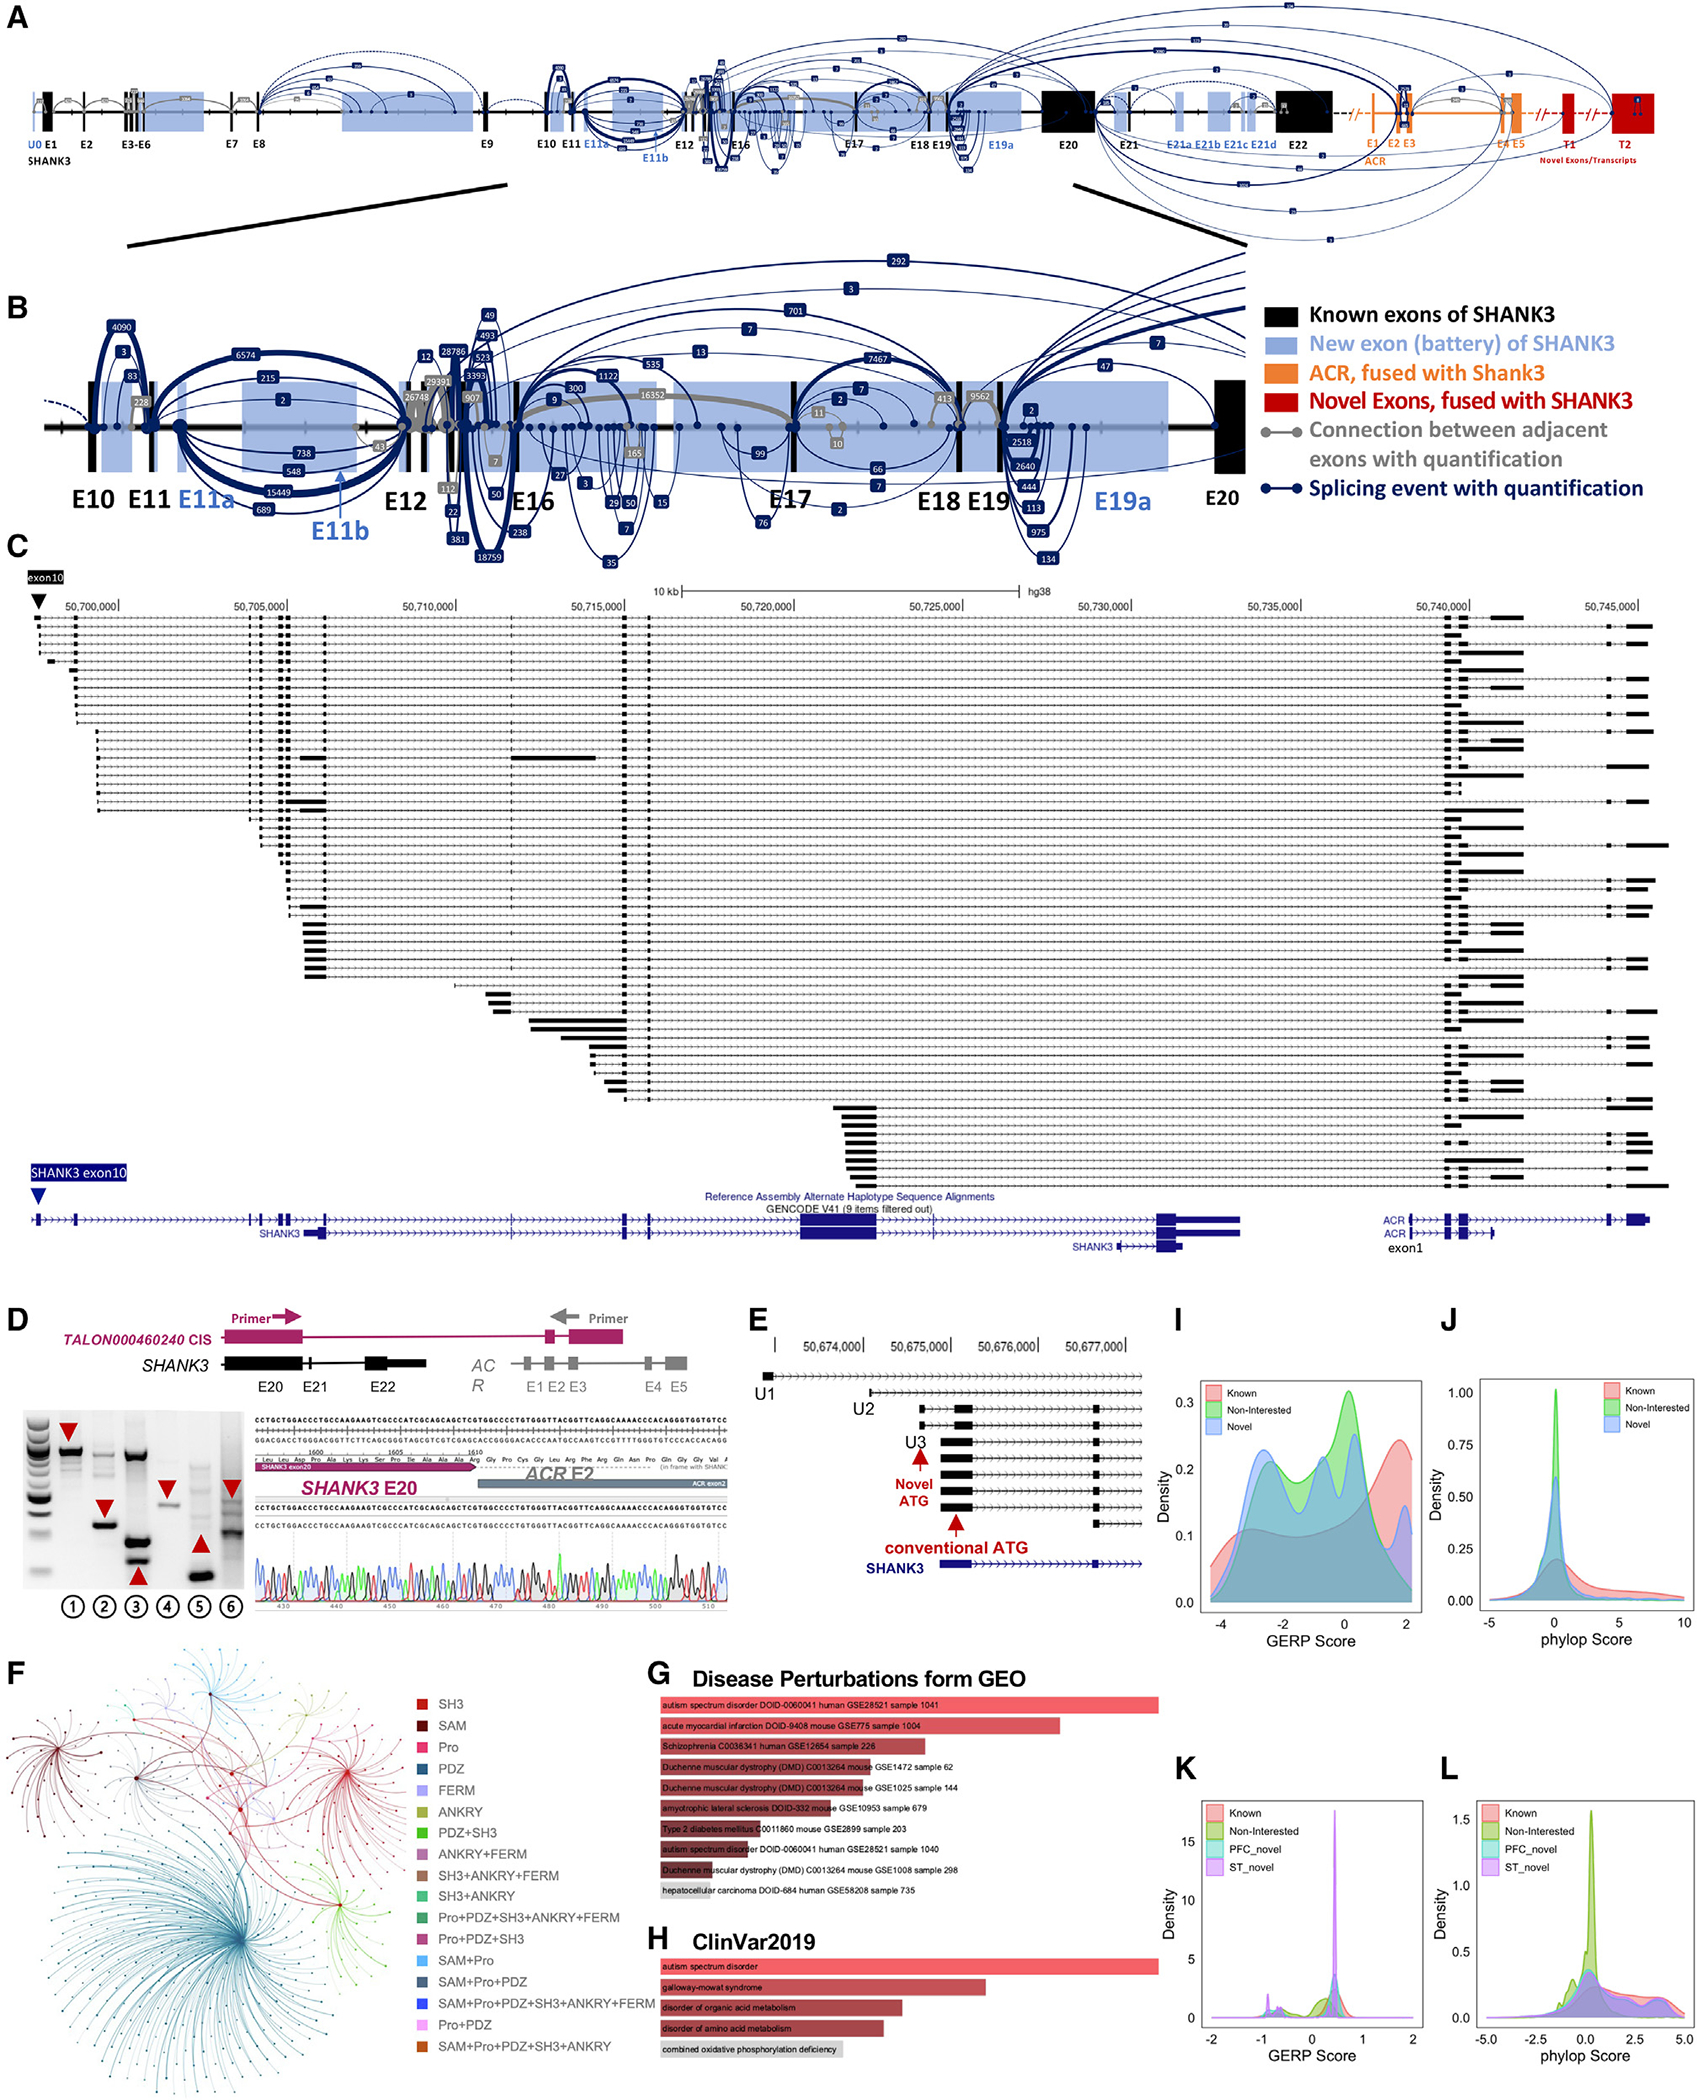
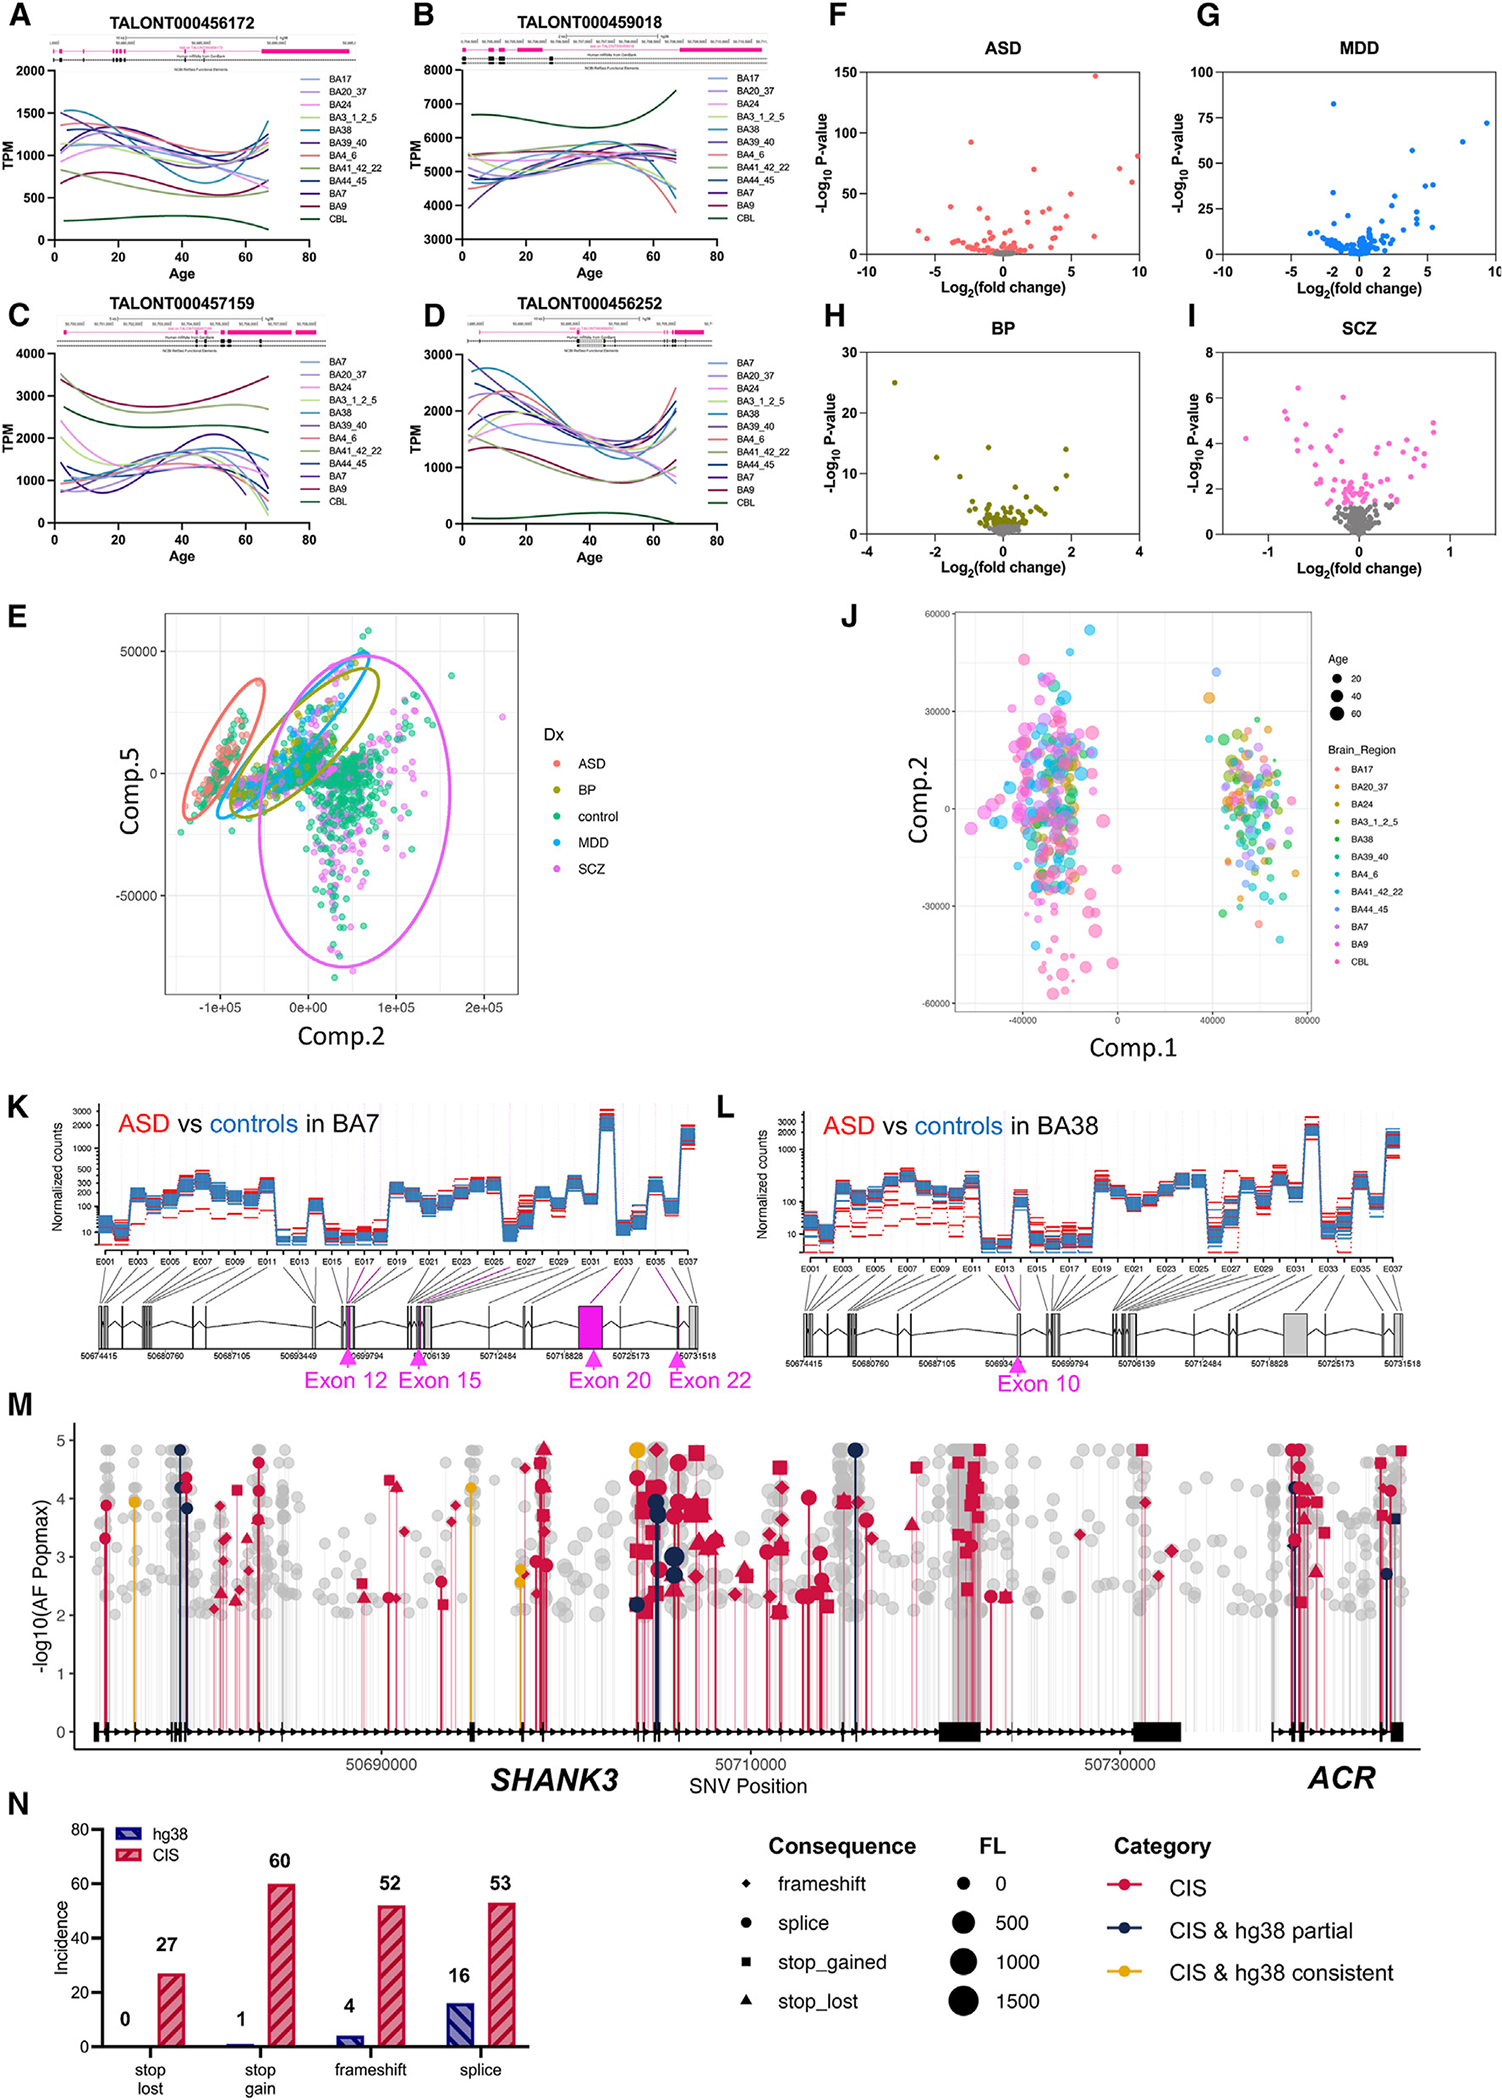
Precision of transcription is critical because transcriptional dysregulation is disease causing. Traditional methods of transcriptional profiling are inadequate to elucidate the full spectrum of the transcriptome, particularly for longer and less abundant mRNAs. SHANK3 is one of the most common autism causative genes. Twenty-four Shank3-mutant animal lines have been developed for autism modeling. However, their preclinical validity has been questioned due to incomplete Shank3 transcript structure. We apply an integrative approach combining cDNA-capture and long-read sequencing to profile the SHANK3 transcriptome in humans and mice. We unexpectedly discover an extremely complex SHANK3 transcriptome. Specific SHANK3 transcripts are altered in Shank3-mutant mice and postmortem brain tissues from individuals with autism spectrum disorder. The enhanced SHANK3 transcriptome significantly improves the detection rate for potential deleterious variants from genomics studies of neuropsychiatric disorders. Our findings suggest that both deterministic and stochastic transcription of the genome is associated with SHANK family genes.

Keywords: ACR; CP: Neuroscience; P53; Phelan-McDermid syndrome; SHANK1; SHANK2; SHANK3; autism spectrum disorder; fusion gene; long-read sequencing; transcriptome.


Conflict of interest statement

Declaration of interests Y.-h.J. is a scientific co-founder of Couragene, Inc., but this study is unrelated to his role. The project was supported initially by a sponsored research project by Taysha Gene Therapies. Taysha Gene Therapies did not have any direct role in the conceptualization, design, data collection, analysis, decision to publish, or preparation of the manuscript.

Figures

Figure 1.
Figure 1.. Genome-wide transcript diversity and abundance in brains detected by SIS
(A) Experimental design of SIS and CIS of human and mouse tissues. (B) Schematic of experimental procedure for RNA capture and long-read sequencing. (C) Number of unique transcripts (transcript diversity) for individual genes (blue) and the number of sequence reads (abundance) (red) for an individual transcript detected in human cerebral cortex by SIS with projected chromosome coordinates and idiograms. (D) Transcript diversity was significantly correlated with the sequence reads (abundance) of the transcripts. (E) Number of transcripts per gene genome wide from SIS in human and mouse brains. (F) Number of unique transcripts (Trans_Div) and abundance (Gene_FL) for 213 ASD risk genes, shown as an average of 56 transcripts per gene and a median of 35. (G and H) Human SIS data show heightened transcript diversity in genes associated with brain disorders, especially ASD and NDD, compared to other diseases. We observed a strong correlation between transcript diversity and abundance in all gene clusters except for those related to dementia/Alzheimer’s disease.
Figure 2.
Figure 2.. Novel Shank3 transcriptome in mouse striatum (ST) by CIS
(A) CIS revealed a refined Shank3 gene structure and splicing patterns in WT mouse ST. The established Shank3 structure (NM_001034115, mm39) is expanded with newly detected exons shared between ST and PFC, depicted in purple. Unique splicing events, represented by gray lines with thickness indicating read quantity, include novel ST-specific exons in dark blue and alternative splices in light blue. Fusion transcript exons near Gm41381 and Acr, shown in green and orange, respectively, feature unique splicing with newly identified red exons (T1–T3) exclusive to Shank3. New exon U3 is shared between ST and PFC. U4 is linked to Gm4138 and ST specific. Exon 21e is a new in-frame exon and 21c is a new exon harboring a stop codon (enlarged view in Figure S9). (B) One hundred forty-two unique transcripts started with the canonical exon 1 of annotated Shank3 (NM_001034115) in ST and terminated at different positions. Pink bar plots on the left are the abundance (log2 counts). Arrows describe the features of given transcripts. (C) Example of transcripts with similar structures in panorama but different at the sequence level with predicted ORFs and ATG codons. The transcripts of PB.13560.548, PB.13560.628, and PB.13560.547 are similar, but the predicted ORFs show different ATG codons and protein domains. (D) Details of the split exon 1. There is a cryptic splicing of 127 bp (non-capitalized sequence in black) within the annotated exon 1 of transcript PB.106071.171, which resulted in a predicted upstream ATG codon and an additional 134 aa. Other transcripts have transcriptional start sites (TSSs) in exon 1 but a predicted ATG codon in exon 2. Variability in TSS and intron 1 retention, as seen in transcripts PB.13554.484, PB.13554.580, and PB.13554.668, leads to ORFs of 304, 106, and 1,290 aa, respectively. (E) Validation of new transcripts from paired mouse PFC and ST samples. Pair 1, novel exon U1; pair 2, fusion transcript between Shank3 exon 21 and Acr exon 2; pair 3, splicing event between Shank3 exon 9 and exon 19; pair 4, splicing event between Shank3 exon 5 and exon 21; pair 5, novel exon 9b of Shank3; pair 6, Shank3 exon 11 extension/intron 11 retention. The red arrows indicate the novel products confirmed by Sanger sequencing. Other bands are products from known transcripts. (F) Sanger sequencing confirmation of a fusion transcript between Shank3 exon 21 and Acr exon 2 in mouse brain (pair 2 of E). (G) Fusion transcripts in other tissues. Forward and reverse primers were from exon 20 of Shank3 and exon 5 of mouse Acr, respectively. Lane 1, liver in P21 mouse; lane 2, thymus in P21 mouse; lane 3, ovary in P21 mouse; lane 4, ovary in 3-month-old mouse; lane 5, testis in P21 mouse; lane 6, testis in 3-month-old mouse. The red arrows show the novel products confirmed by Sanger sequencing as indicated. Other bands are known products. (H) Sanger sequencing of Shank3 exon 11 extension/intron 11 retention in mouse brain (lane 6 of G). (I) Western blot shows the upregulation of SHANK3-ACR fusion protein in mouse PFC of Shank3Δe4−22−/− mutant mice compared to WT.
Figure 3.
Figure 3.. Novel Shank3 transcriptome in mouse PFC by CIS and predicted domain structures of ORFs
(A) New Shank3 transcript structure and conch plot of splicing events discovered in WT mouse PFC by CIS. Color code is the same as in Figure 2A. The novel exon 9a (chr15: 89394416–89394465, mm39) is shared between PFC and ST. Other novel exons such as exon 12e (chr15: 89414330–89414640, mm39) were unique to PFC. Novel exons 21a, 21b, and 21c are predicted to result in an early stop codon and shorter ORFs (chr15: 89394416–89394465, chr15: 89408698–89408784, chr15: 89418571–89418609, mm39) (enlarged view in Figure S10). (B) Structure of 59 transcripts with different TSSs but terminating at annotated exon 22 of Shank3. Pink bar plot represents the abundance (log2 counts) of each transcript. (C and D) The comparison of transcripts and predicted ORFs between mouse ST and PFC. (E and F) The pattern of deduced TSSs and predicted starting sites of the coding sequence (CDS) for all Shank3 transcripts, including new 5′ and 3′ fusion transcripts from CIS in mouse ST (E) and PFC (F). Each filament represents an individual transcript in different classes of GM41381 (U1–U2)-Shank3, Shank3-T1–3, Shank3, Shank3-Acr (first column), deduced TSS (middle column), and predicted starting sites of CDS (third column). (G) A total of 125 unique ORFs are predicted from 142 transcripts starting with exon 1 in ST. The pattern of the combination of six protein domains is shown in the outermost ring of the windmill plot. The middle layer shows the abundance of each RNA transcript and the p value of its expression level compared to other transcripts. Only four ORFs of transcripts contained all six protein domains. (H–K) Four windmill plots showing 270 predicted ORFs from all 345 transcripts detected in PFC classified by the combination of functional domains. (L) Spiral plot showing an aggregated functional domain coverage of the transcripts captured by the Shank1–3 joint probe panel by CIS of mouse PFC and ST. Each dot represents a unique transcript. Each color represents a unique combination of functional domains. The dots are ordered from the longest to the shortest transcript, while the colors are arranged from the SAM to the Ubl domain.
Figure 4.
Figure 4.. The summary and illustration of altered Shank3 transcripts in Shank3Δe4–9, Shank3Δe21, and Shank3Δe4–22 mutant mice from CIS
(A) Current annotated mouse Shank3 and Acr (NM_013455, mm39) gene structures. The annotations of genetically targeted mutations in mouse, rat, monkey, and dog are shown (KO, exonic deletions; KI, knockin mutation). (B) The gene structure of Shank3Δe4–9 mutant mice is in gray, and representative mRNA transcripts, according to structural uniqueness, from Shank3Δe4−9−/− mice are in pink. No transcript using first annotated exon 1 was detected. Instead, the first exon, presumably a cryptic TSS (arrow), was detected in intron 1. The exon 4–9 deleted transcript missed exons 11, 12, and 22, but has a fusion between Shank3 and Acr. The transcripts starting at intron 16/exon 17 (arrows) as the first exon were most abundant. Extensive fusion transcripts between Shank3 exon 21 and Acr exon 2 were observed. The last coding exon 22 was not detected in any transcripts. (C) The gene structure of Shank3Δe21 mutant mice and Acr gene, in gray, and representative mRNA transcripts, from a structural uniqueness perspective, from Shank3Δe21−/− mice in blue. Splicing between exon 4 of Shank3 and exons of Acr that resulted in fusion transcripts was observed. The transcripts starting at intron 16/exon 17 (arrows) as first exon and fusion between Shank3 and Acr were most common. The coding exon 22 was not detected in any transcript. (D) The gene structure of Shank3Δe4–22 mutant mice and the Acr gene, in gray, and representative mRNA transcripts in purple to reflect structural uniqueness. The number of fusion transcripts between Shank3 and Acr is significantly increased in Shank3Δe4−22−/− mutant mice. (E and F) Increased expression of the Acr transcript in Shank3Δe4−22−/− mutant mouse by RT-qPCR. The expression of the Acr gene was significantly increased in both striatum and hippocampus by >100-fold. (G–J) Compensatory expression of the functional domains of SHANK family proteins in the striatum of Shank3Δe4–22 mutant mice. The bulk RNA-seq data of Shank3Δe4–22 were analyzed for the compensatory expression of other functional domains of Shank1 and Shank2 genes. The deficiency of the ANKYR and SH3 domains of SHANK3 was compensated for by SHANK1, but the deficiency of the PDZ and SAM domains was compensated for by both SHANK1 and SHANK2. The deficiency of the SAM and SH3 domains was fully compensated for, but the deficiency of the ANKYR and PDZ domains was partially compensated for.
Figure 5.
Figure 5.. The novel transcripts of human SHANK3 genes detected by CIS and predicted ORFs
(A) New SHANK3 transcript structure and conch plot of SHANK3 transcripts discovered by CIS in normal human cortex. Black backbone is the annotated SHANK3 transcript of NM_001372044 (hg38). Blue rectangles represent novel exons of SHANK3. The exons of ACR are shown as orange rectangles. The new and uncharacterized exons distal to ACR are red rectangles. The gray line connects adjacent exons, while the light blue line illustrates alternative splicing events. The number of sequence reads for the splicing event is shown in the middle of connecting lines and reflected in the thickness of the connecting lines (enlarged view in Figure S9). (B) Zoomed-in view of the splicing events between exons 10 and 20 in the human cortex. Exons 16 and 20 of SHANK3 in humans correspond to exons 17 and 21 of Shank3 in mice. (C) Structure and abundance of the fusion transcripts between SHANK3 and ACR in the human cortex. A majority of fusion transcripts are initiated after exon 10, mainly from introns 16 and 17 and exon 21. The fusion transcripts are notably skipping exon 20 (the largest exon) of SHANK3 and exon 1 of ACR. (D) Validation of novel SHANK3 transcripts in human brain tissue by RT-PCR and Sanger sequencing. Diagram of the primer design of L1 is shown. RT-PCR gel: L1, fusion transcript between SHANK3 exon 20 and ACR exon 2; L2, fusion transcript between SHANK3 exon 20 and ACR exon 4; L3, fusion transcript between SHANK3 exon 19 and ACR exon 2; L4, novel exon U3; L5, intron 14 retention; and L6, intron 15 retention. M, DNA marker. The Sanger sequence of the RT-PCR product of SHANK3 exon 20 and ACR exon 2 fusion from L1 is shown. (E) Three new exons upstream of the annotated exon 1 of SHANK3 mRNA (NM_001372044) (U1, chr22: 50672853–50672979; U2, chr22: 50674076–50674097; U3, chr22: 50674642–50674705, hg38). A new ATG codon is in U2. (F) Dandelion plot shows functional domain combinations of the SHANK1, SHANK2, and SHANK3 transcripts from CIS. Each dot represents a unique transcript, and each color is a unique combination of functional domains. There are 17 combinations of functional domains of human SHANK family genes. The PDZ domain was significantly more present (~70%) in predicted ORFs. (G and H) Significant enrichment of fusion transcripts in transcriptome data of ASD and schizophrenia. Gene Ontology enrichment analysis with Enrichr95 in 41 disease-related datasets is shown. The fusion transcripts were significantly enriched in ASD and schizophrenia in disease perturbations from the GEO dataset (G) and the ClinVar2019 dataset (H). (I and J) Distribution of GERP (G) and PhyloP (H) scores across human SHANK3 genomic regions of known coding exons, novel exons from CIS, and a non-transcribed region in cerebral cortex. (I) The GERP score for novel exons from CIS in cerebral cortex is significantly higher than in a non-transcribed region (D = 0.097; p < 0.001) but significantly lower than that of SHANK3 known exons (D = 0.299; p < 0.001). (J) The PhyloP score for novel exons from CIS in cerebral cortex is significantly higher than in a non-transcribed region (D = 0.133, p < 0.001) but significantly lower than that of SHANK3 known coding exons (D = 0.296, p < 0.001). (K and L) Distribution of GERP and PhyloP scores across mouse Shank3 genomic regions of known coding exons, novel exons from CIS, and a non-transcribed region in PFC and ST. (K) The GERP score for novel exons from CIS in PFC and ST is significantly higher than that of a non-transcribed region (PFC, D = 0.548, p < 0.001; ST, D = 0.602, p < 0.001) but significantly lower than that of known Shank3 coding exons (PFC, 0.15, p < 0.001; ST, D = 0.0960; p < 0.001). (L) The PhyloP score for novel exons from CIS in PFC and ST is significantly higher than that of a non-transcribed region (PFC, D = 0.385, p < 0.001; ST, D = 0.439, p < 0.001) but significantly lower than that of known Shank3 coding exons (PFC, D = 0.184, p < 0.001; ST, D = 0.128, p < 0.001).
Figure 6.
Figure 6.. Development-, cell-type-, and cell-compartment-specific and spatial transcriptome of Shank3 in mouse brains
(A) Development-specific Shank3 transcripts in mouse cerebral cortex. (B) Cell-type-specific Shank3 transcripts in mouse brains. The scRNA-seq of the anterior cingulate cortex (ACA) was aligned to Shank3 transcripts detected by CIS. Glutamatergic neurons, especially the L2/3, L4/5, and L6 CTX, have more diverse Shank3 transcripts compared to GABAergic neurons and non-neuronal cells. Certain transcripts were cell-type specific. The Shank3 transcript (PB.10607.933) including exon 18 was detected only in endothelial cells. (C–F) Mouse Shank3 transcripts in the Visium spatial transcriptome. (C) Visium spatial anatomy (CA, cornu ammonis; DG, dentate gyrus; TH, thalamus; PIR, piriform cortex; MEA, medial amygdala; CP, choroid plexus; CTX, cortex; HPF, hippocampal formation; HY, hypothalamus). (G) Cellular compartment-specific changes in Shank3 exon usage in the hippocampus of an Alzheimer’s disease (AD) mouse model from scRNA-seq data from different cellular compartments. The nucleus, compared to synapses, expressed significantly fewer splicing events of 32 and 33 that correspond to exon 21, the largest exon of mouse Shank3. (H) Different patterns of Shank3-Acr fusion transcripts in nucleus and synapse between WT and AD mice.
Figure 7.
Figure 7.. Improved transcriptome analysis of ASD transcriptome and sequence variant annotations of genome sequence data using the SHANK3 transcript structure from CIS
(A–D) The patterns of human SHANK3 transcripts from CIS changed at different ages and brain regions. Bulk RNA-seq data of normal controls was aligned to SHANK3 transcripts detected using CIS (BA, Brodmann area; CBL, cerebellum). (E–I) PCA of human SHANK3 transcripts from CIS and bulk RNA-seq data of 2,474 cases with ASD, BPD, MDD, or SCZ, and normal controls from PsychENCODE (only data from prefrontal cortex are included). The clusters of MDD and BPD overlapped but are separate from ASD and SCZ. (F–I) Volcano plots for individual disorders ASD (n = 68), MDD (n = 87), BPD (n = 297), and SCZ (n = 736) compared to controls (n = 1,286). (J) PCA of SHANK3 transcripts in different brain regions and ages (BA, Brodmann area; CBL, cerebellum). (K and L) Brain-region-specific change in SHANK3 transcripts in ASD brains. Bulk RNA-seq data of subregions of the brain from ASD and controls were aligned to SHANK3 transcripts from CIS. (K) Exons 11, 15, 20, and 22 of SHANK3 transcripts were significantly more represented in the BA7 region of ASD. (L) Exon 10 of SHANK3 transcripts is significantly more represented in BA38 of ASD brain. (M) Utilizing the updated SHANK3 transcript structure from CIS enhanced PTV detection in ASD, SCZ, and BPD exome and genome sequencing data. From 55,000 cases, we identified 1,530 new PTVs, a significant increase from previous annotations using the SHANK3 transcript NM_001372044.2 in hg38. Of these, 192 variants were likely deleterious, including 27 stop-loss, 60 stop-gain, 52 frameshift, and 53 splice variants, compared to the earlier finding of 22 such variants. (N) The discovery rate of PTVs for SHANK3 is increased from 1.3% using NM_001372044.2/hg38 as a reference to 12.5% using the transcript structure from CIS in this study.

Update of

References

    1. Park E, Pan Z, Zhang Z, Lin L, and Xing Y (2018). The Expanding Landscape of Alternative Splicing Variation in Human Populations. Am. J. Hum. Genet. 102, 11–26. 10.1016/j.ajhg.2017.11.002. - DOI - PMC - PubMed
    1. Blencowe BJ (2017). The Relationship between Alternative Splicing and Proteomic Complexity. Trends Biochem. Sci. 42, 407–408. 10.1016/j.tibs.2017.04.001. - DOI - PubMed
    1. Raj B, and Blencowe BJ (2015). Alternative Splicing in the Mammalian Nervous System: Recent Insights into Mechanisms and Functional Roles. Neuron 87, 14–27. 10.1016/j.neuron.2015.05.004. - DOI - PubMed
    1. Ray TA, Cochran K, Kozlowski C, Wang J, Alexander G, Cady MA, Spencer WJ, Ruzycki PA, Clark BS, Laeremans A, et al. (2020). Comprehensive identification of mRNA isoforms reveals the diversity of neural cell-surface molecules with roles in retinal development and disease. Nat. Commun. 11, 3328. 10.1038/s41467-020-17009-7. - DOI - PMC - PubMed
    1. Gandal MJ, Zhang P, Hadjimichael E, Walker RL, Chen C, Liu S, Won H, van Bakel H, Varghese M, Wang Y, et al. (2018). Transcriptome-wide isoform-level dysregulation in ASD, schizophrenia, and bipolar disorder. Science 362, eaat8127. 10.1126/science.aat8127. - DOI - PMC - PubMed

LinkOut - more resources