Clinical Trial
. 2024 Jun 21;384(6702):eade8520.
doi: 10.1126/science.ade8520. Epub 2024 Jun 21.

JAK inhibition enhances checkpoint blockade immunotherapy in patients with Hodgkin lymphoma

Affiliations
Clinical Trial

JAK inhibition enhances checkpoint blockade immunotherapy in patients with Hodgkin lymphoma

Jaroslav Zak et al. Science. .

Abstract

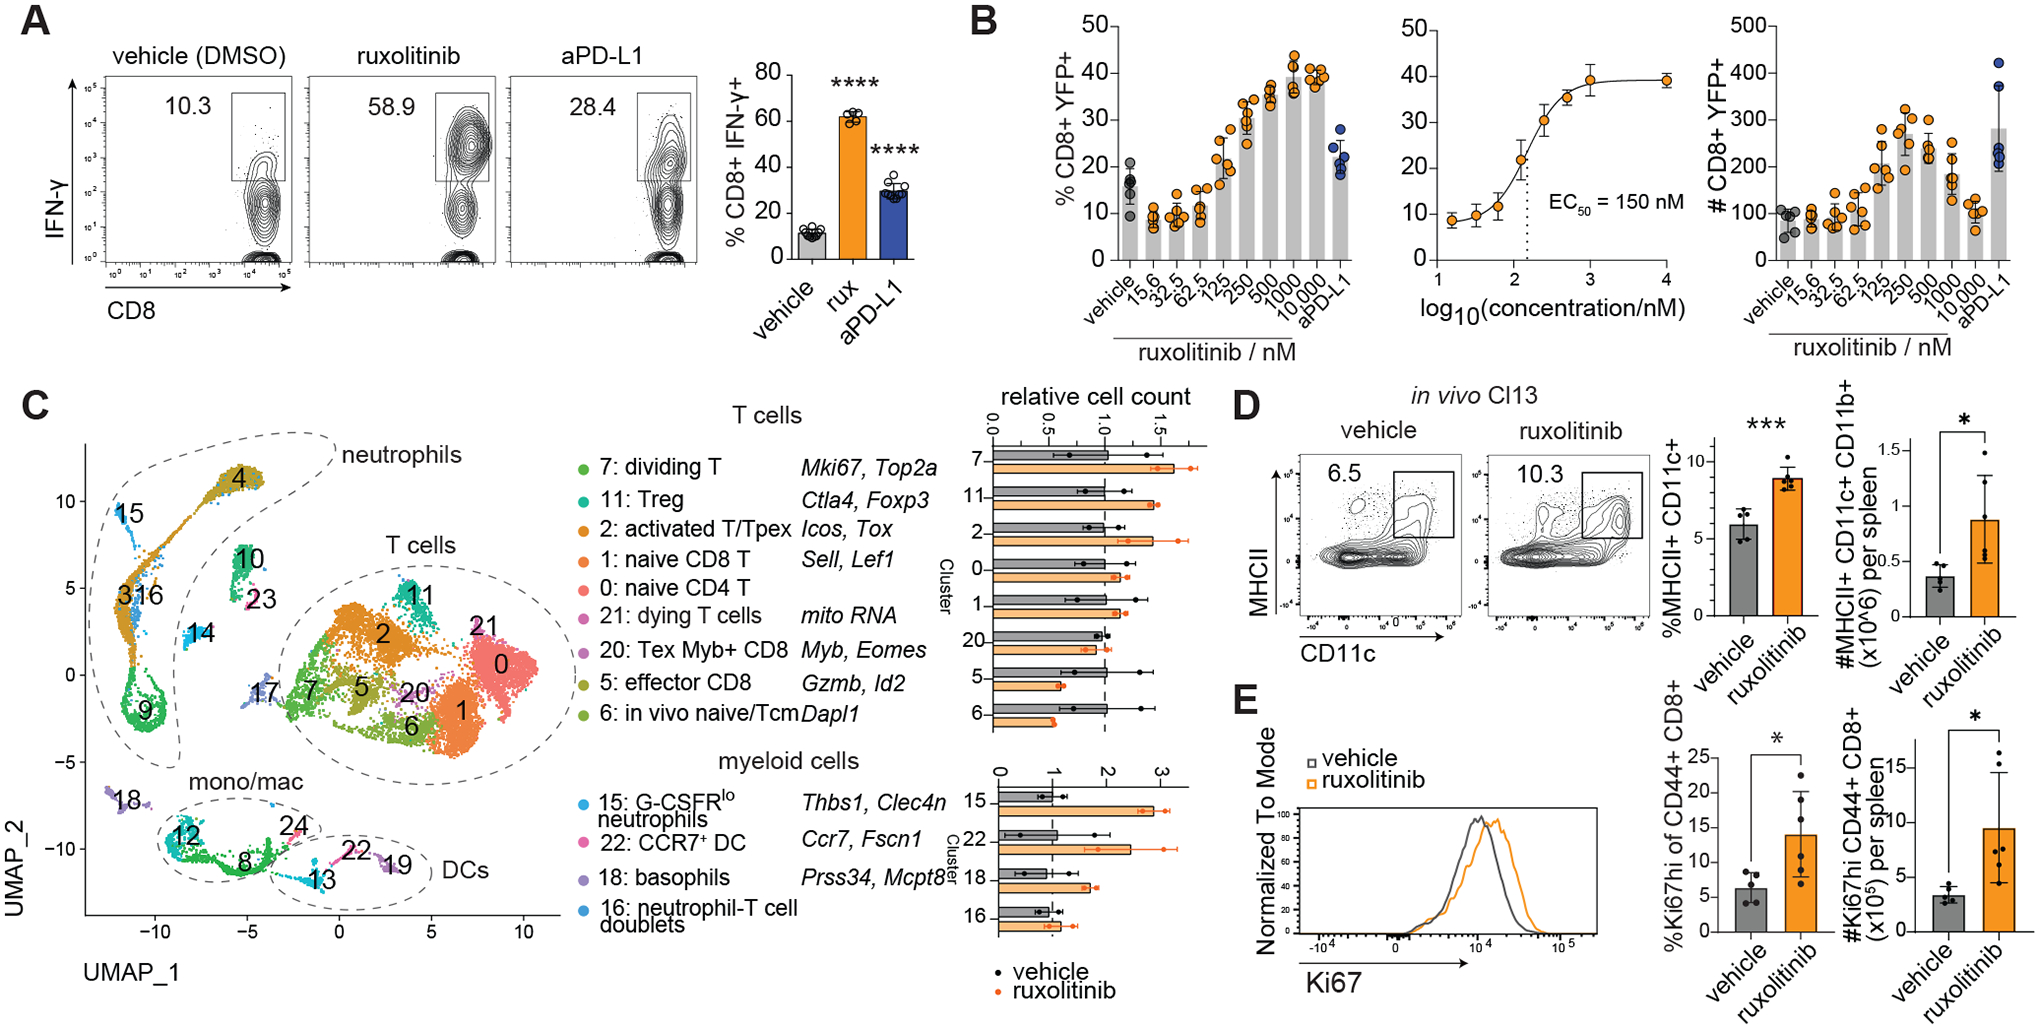
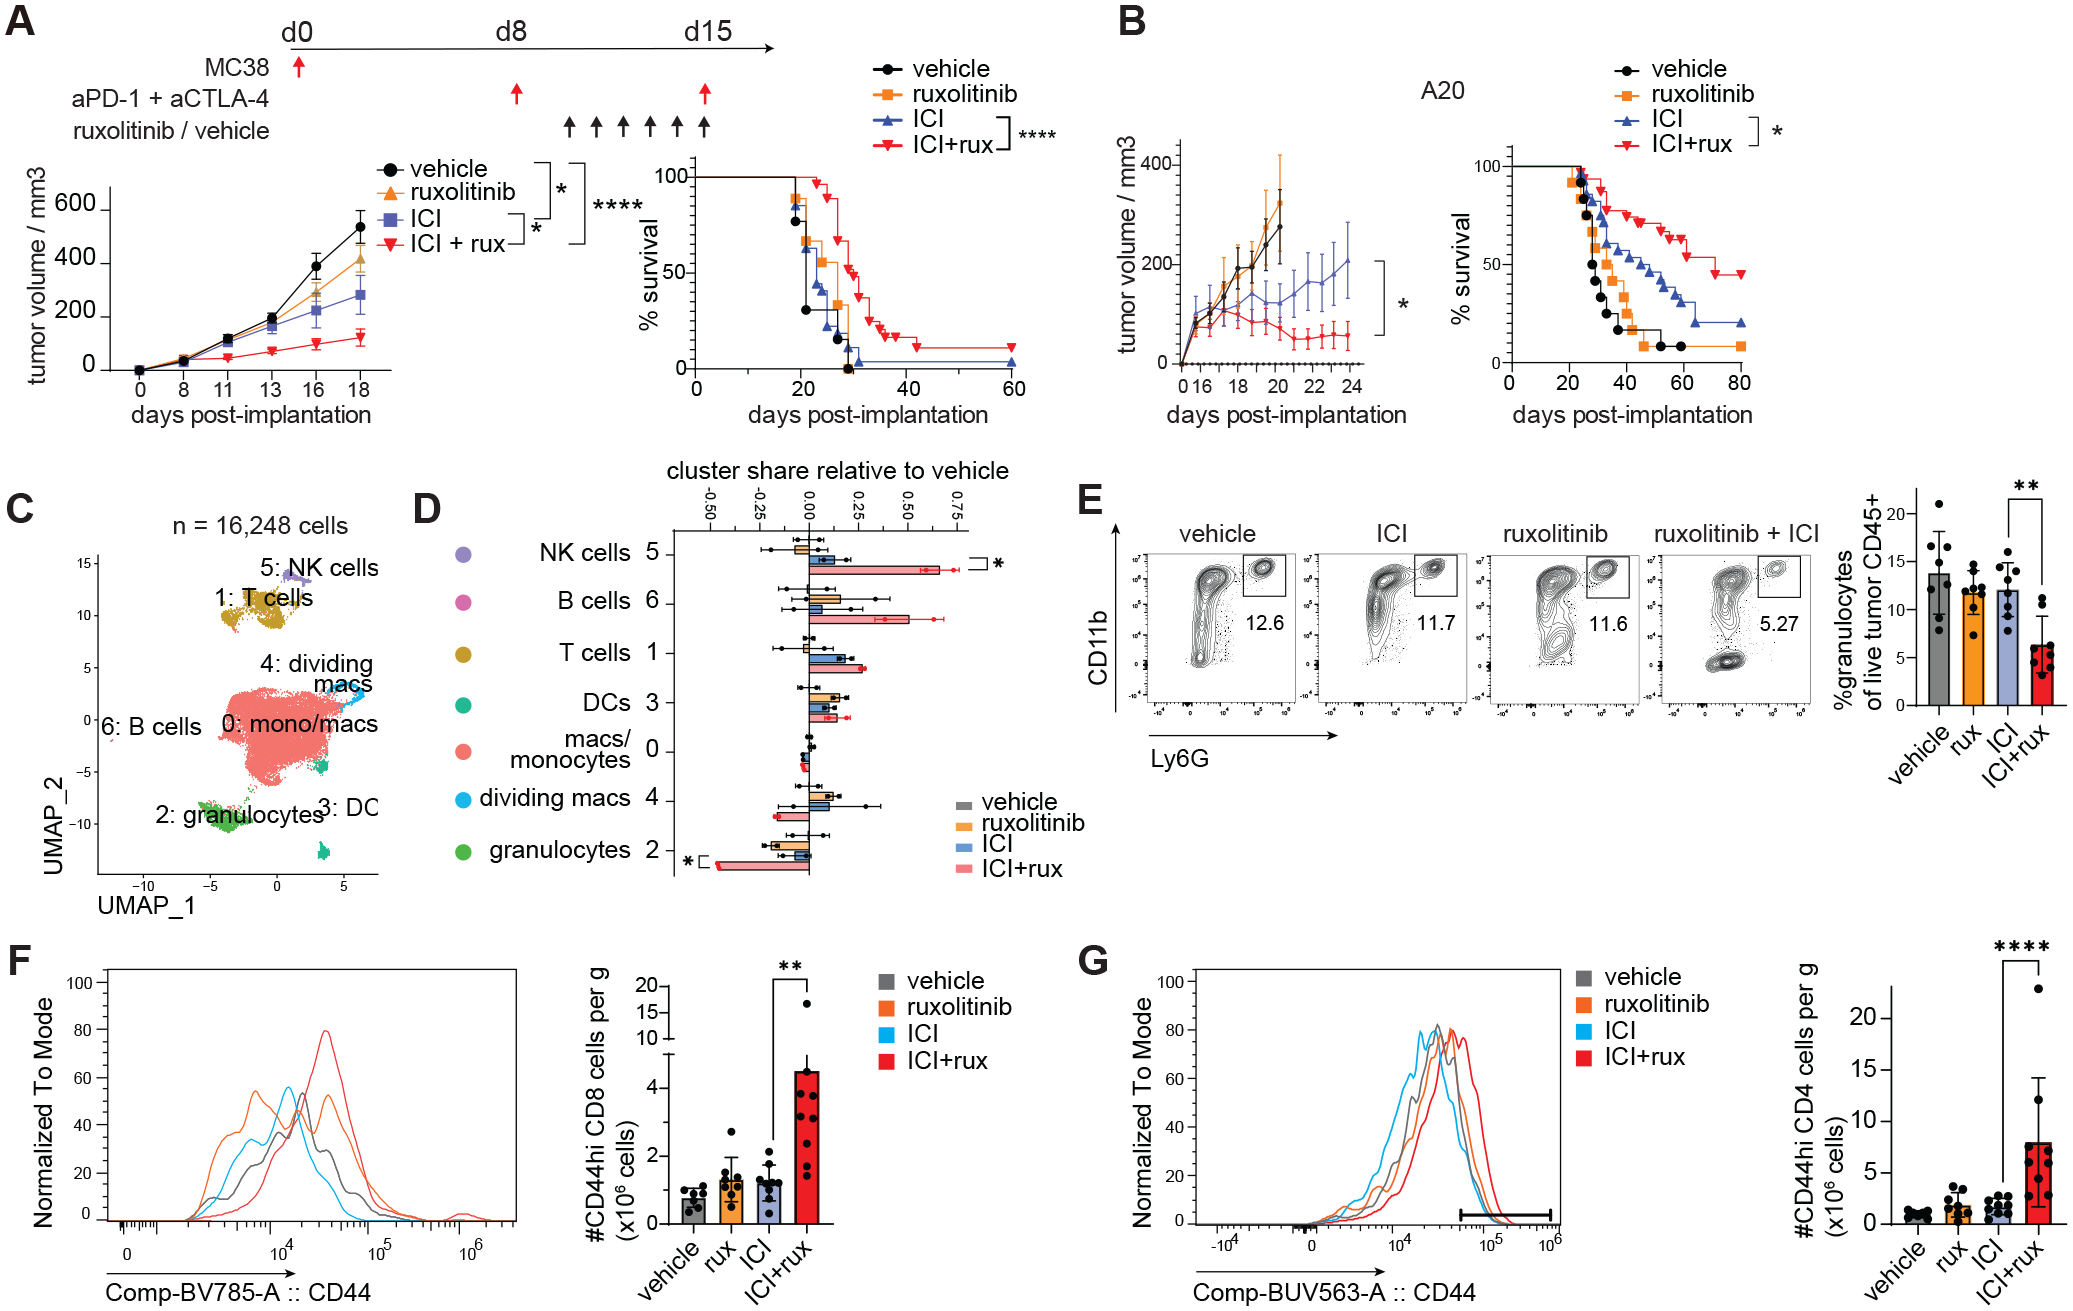
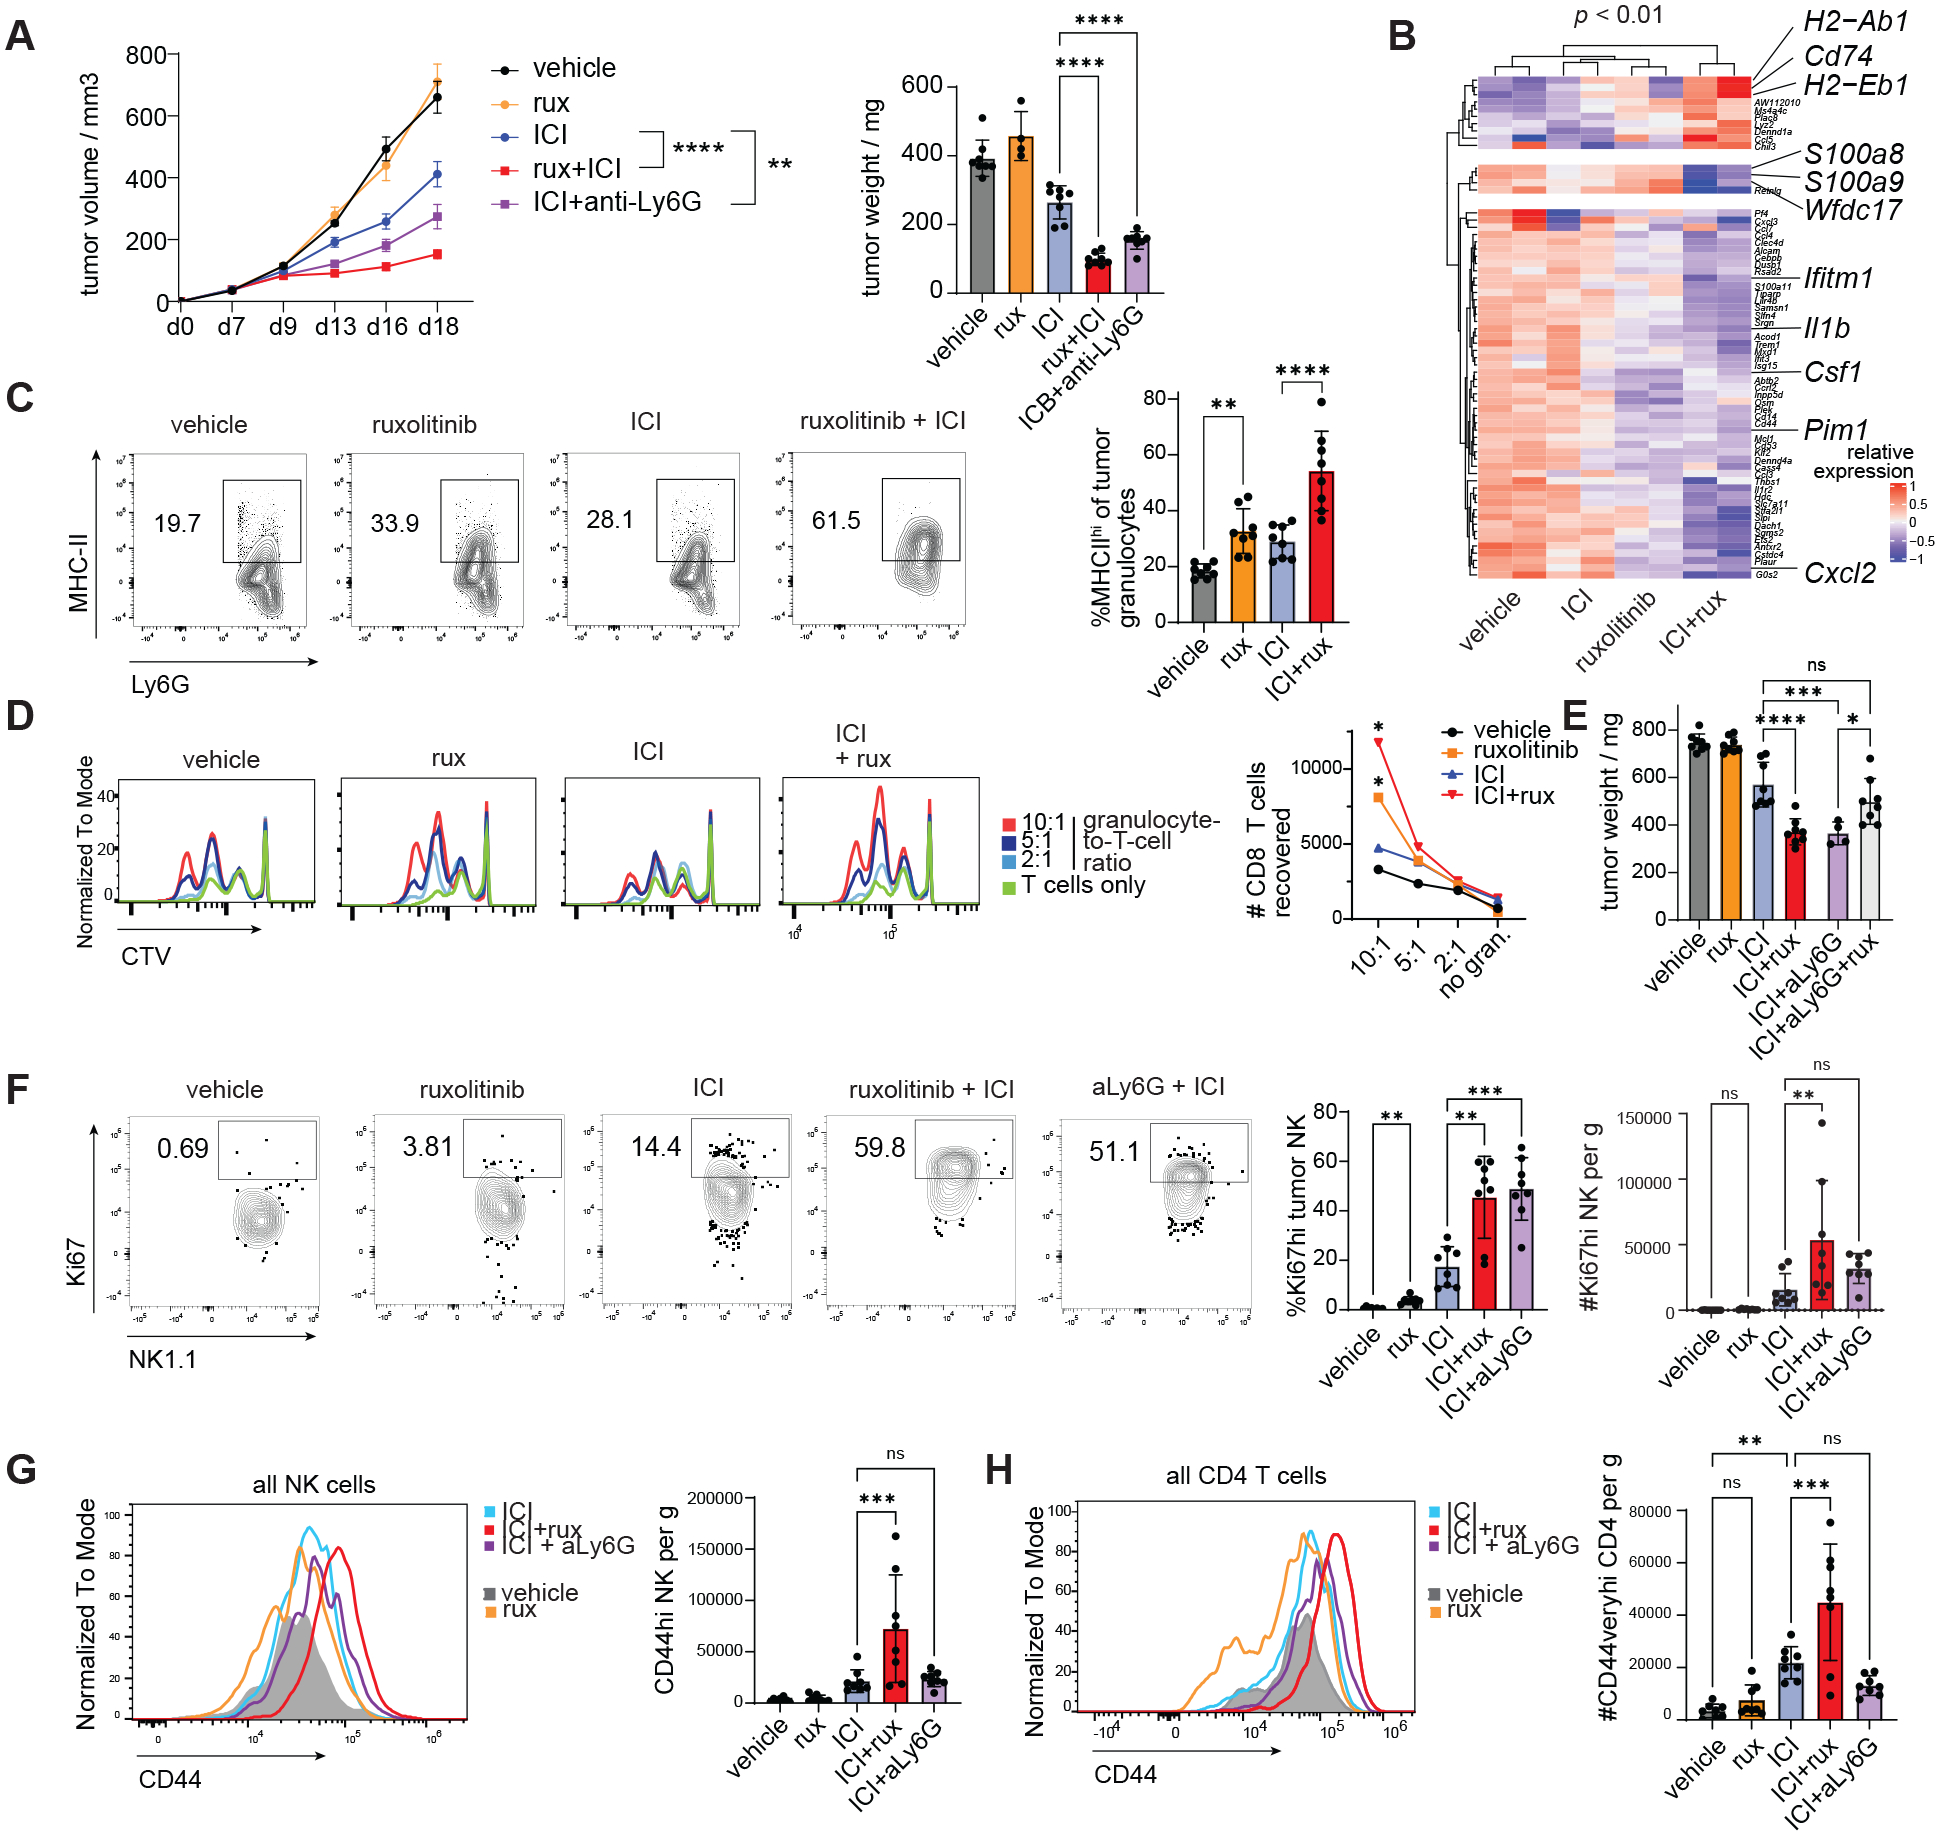
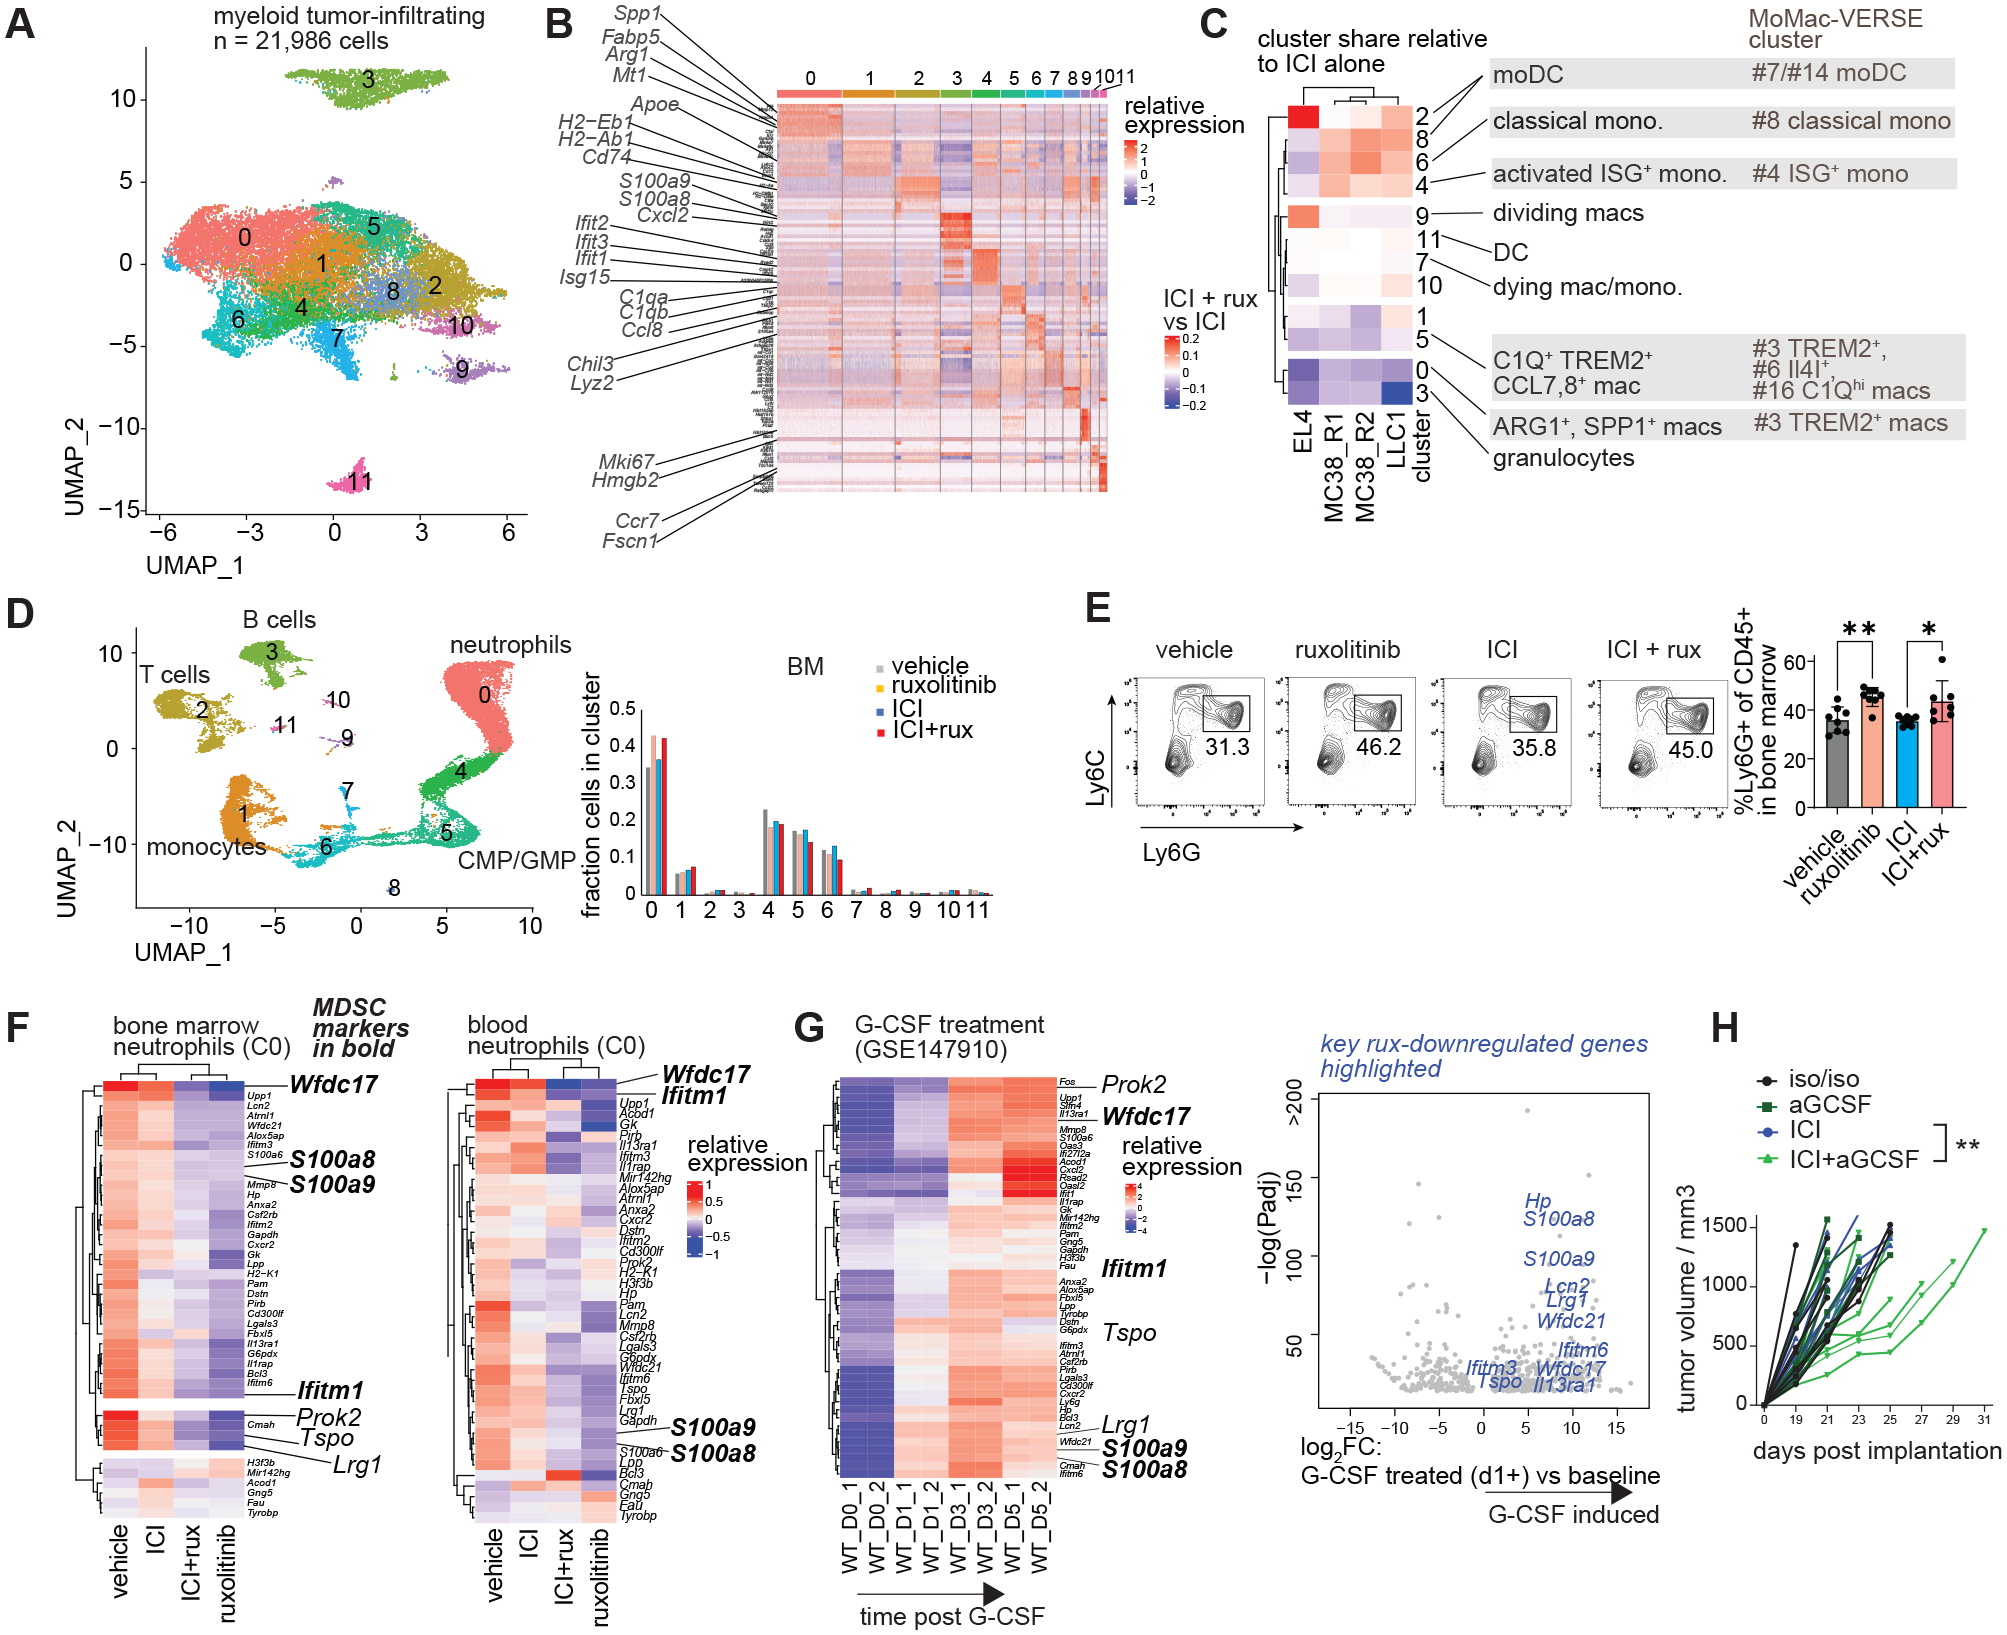
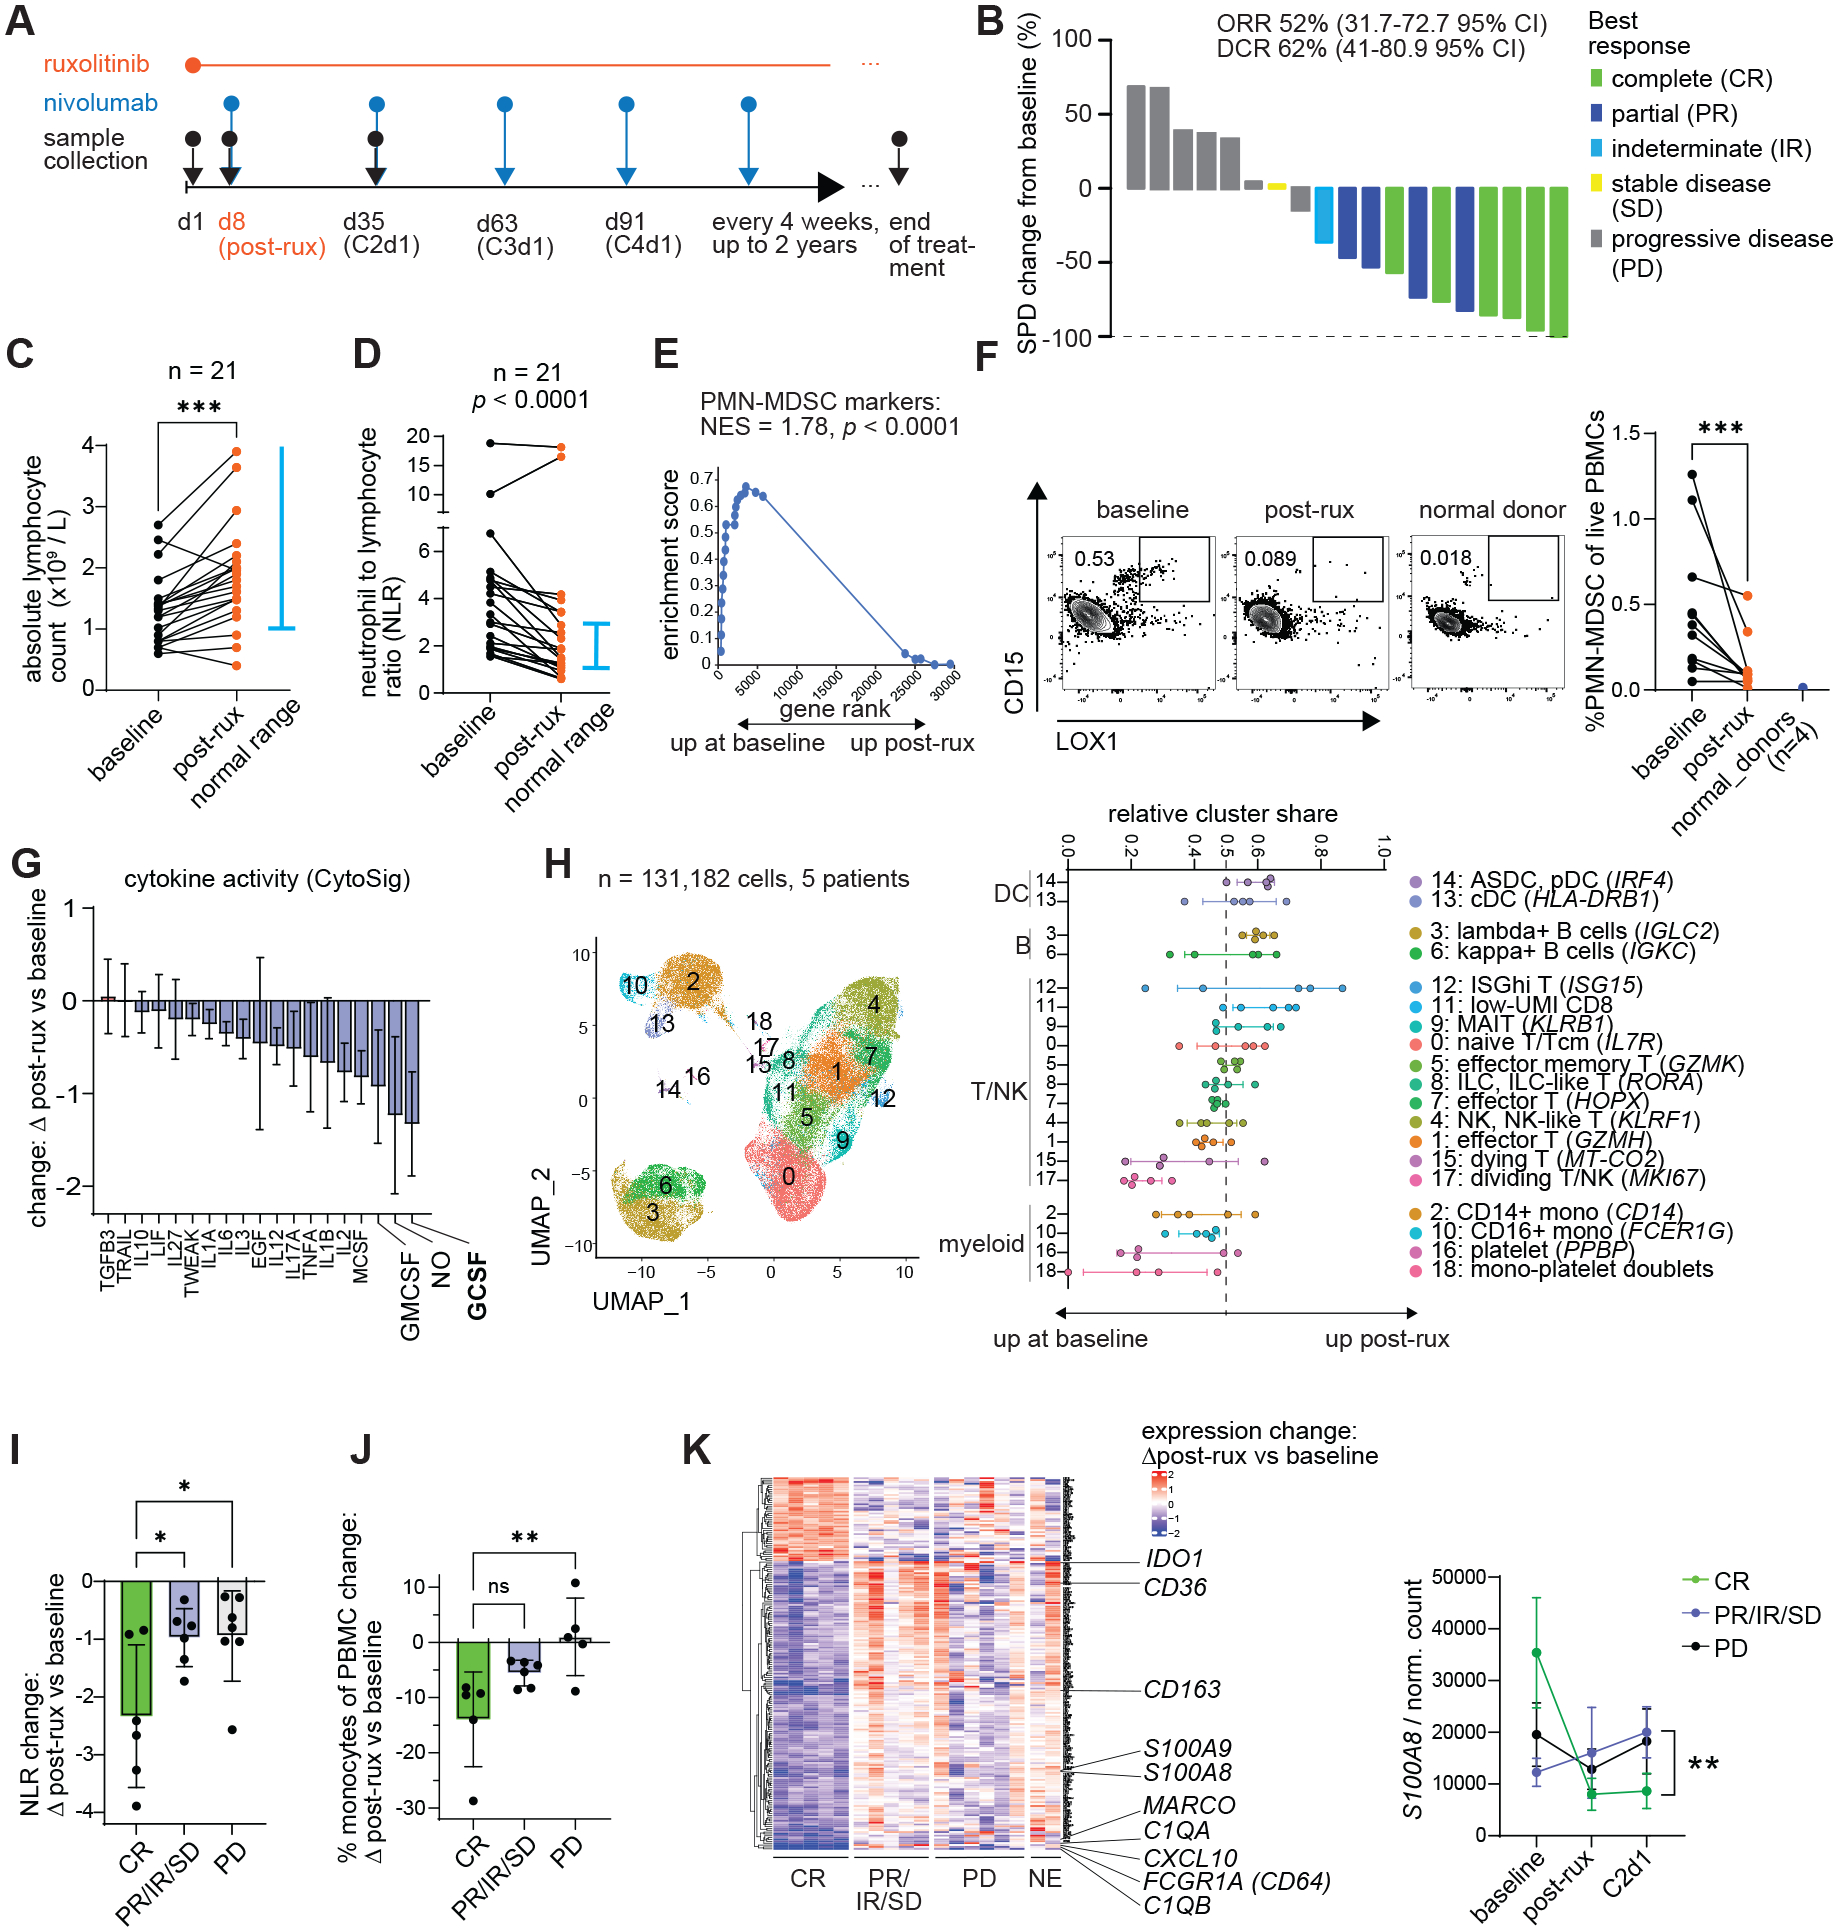
Unleashing antitumor T cell activity by checkpoint inhibitor immunotherapy is effective in cancer patients, but clinical responses are limited. Cytokine signaling through the Janus kinase (JAK)-signal transducer and activator of transcription (STAT) pathway correlates with checkpoint immunotherapy resistance. We report a phase I clinical trial of the JAK inhibitor ruxolitinib with anti-PD-1 antibody nivolumab in Hodgkin lymphoma patients relapsed or refractory following checkpoint inhibitor immunotherapy. The combination yielded a best overall response rate of 53% (10/19). Ruxolitinib significantly reduced neutrophil-to-lymphocyte ratios and percentages of myeloid suppressor cells but increased numbers of cytokine-producing T cells. Ruxolitinib rescued the function of exhausted T cells and enhanced the efficacy of immune checkpoint blockade in preclinical solid tumor and lymphoma models. This synergy was characterized by a switch from suppressive to immunostimulatory myeloid cells, which enhanced T cell division.


Conflict of interest statement

Competing interests: Incyte Corporation and Bristol-Myers Squibb provided clinical trial funding.

Figures

Fig. 1.
Fig. 1.. JAK1/2 inhibitors rescue proliferation of cytokine-producing CD8 T cells without impairing viral control.
(A-C) In vitro Cl13: splenocytes from LCMV Cl13 infected IFNγ-IRES-YFP mice were harvested at 15 days post infection and cultured in the presence of LCMV peptides for 5 days (more details see Materials and Methods). (A) Validation assay: effect of ruxolitinib and anti-PD-L1 treatment on endogenous IFN-γ labeled by intracellular staining, splenocyte culture conditions equivalent to primary assay with B6 mice substituted for YFP-IFN-γ mice. (B) Dose response and EC50 calculation of ruxolitinib in enhancing %YFP+ of CD8 T cells in 5-day culture assay. (C) CITE-seq of splenocyte cultures treated with ruxolitinib or vehicle, cells analyzed at d0 and d4 of treatment, dot plot shows relative number of cells in each cluster in ruxolitinib vs vehicle treated wells, taking into account the total number of cells recovered. (D-E) In vivo Cl13: B6 mice were infected with Cl13 and treated with vehicle or ruxolitinib by daily gavage: (D) Flow cytometric assessment of splenic DCs, (E) splenic CD44+ CD8 T cells from Cl13 infected mice treated with ruxolitinib or vehicle at 10 dpi. For myeloid clusters, only clusters with >=10 cells per sample in the ruxolitinib group were quantified. Experiments were performed once (C) or 2–4 times (A-B, D-E) and representative results shown. Bars show standard deviation. Statistical comparison of experimental groups was performed using one-way ANOVA with Dunnett’s post test (A), unpaired Student’s t-test (D-E).; Treg, T regulatory cell; DC, dendritic cell; Tcm, T central memory cell; Tex, T exhausted cell; Tpex, T progenitor exhausted cell; *, p ≤ 0.05; ***, p ≤ 0.001; ****, p ≤ 0.0001.
Fig. 2.
Fig. 2.. Ruxolitinib enhances the efficacy of checkpoint blockade cancer immunotherapy.
(A, C-G) Mice were implanted with MC38 tumor cells and treated as described in the experimental scheme in 4 experimental groups, tumor measurements were performed every 2–3 days after tumors became palpable. (B) Wild type BALB/c mice implanted with A20 tumor cells were treated with ICI or isotype control when palpable and ruxolitinib or vehicle daily starting 2 days after the first ICI injection. (C-D) Dimensionality reduced map of MC38 tumor-infiltrating cells, treatment groups as described in A; bar graph shows the share of sample cells in each cluster relative to the mean share in vehicle treated samples. Clusters were color-coded as C0 = red, C1 = brown, C2 = green, C3 = turquoise, C4 = sky blue, C5 = purple, C6 = soft maroon. (E-G) Tumor-infiltrating CD45+ cells in mice treated as in 2A were analyzed by flow cytometry at d18 post implantation; (E) flow cytometric quantification of granulocytes. (F-G) Flow cytometric quantification of CD44hi CD8 T (F) and CD4 T cells (G). Statistical comparison of experimental groups was performed by two way-ANOVA (A-B), one-way ANOVA and Sidak’s post-test (E-G), two-tailed Student’s t-test (D). Experiments were performed 2–5 times and pooled (A-B, survival analysis) or representative results shown (C-G). Treatment groups were color-coded as vehicle = grey, ruxolitinib = orange, ICI = blue, ICI+ruxuxolitinib = red. Bars represent standard deviation (D-G) or s.e.m (A-B); anti-PD-1, anti-PD-1; ICI, immune checkpoint blockade; NK, natural killer cell; *, p ≤ 0.05; **, p ≤ 0.01; ***, p ≤ 0.001; ****, p ≤ 0.0001.
Fig. 3.
Fig. 3.. Ruxolitinib reprograms tumor-infiltrating myeloid cells to enhance lymphocyte proliferation.
(A) MC38 tumor bearing mice were treated with Ly6G-depleting antibody (aLy6G) or isotype control 2 days prior to treatment with ICI/isotype and ruxolitinib/vehicle, then every 2 days until end of ruxolitinib/vehicle treatment, tumor volume measured every 2–4 days (A) and tumors analyzed at d18 post implantation. (B) Genes differentially expressed between ICI+ruxolitinib treated and ICI treated mice in tumor-infiltrating granulocytes analyzed by scRNAseq. (C) Flow cytometry analysis of tumor-infiltrating granulocytes at d18 post implantation, treatment groups as described in Figure 2A. (D) Splenic granulocytes (CD11b+ Ly6Ghi Ly6Cint) from mice treated as described in Fig. 2A were sorted and mixed with purified, CTV-labeled T cells at the ratios indicated and cell mixtures subjected to anti-CD3/CD28 stimulation, flow cytometry analysis at d3 of assay. (E) MC38 tumor bearing mice were treated as described in Figure 3A with the additional experimental group treated with anti-Ly6G + ICI + ruxolitinib, tumors analyzed 2d after treatment cessation. (F-H) MC38 tumor bearing mice were treated as in Figure 3A and tumor-infiltrating cells analyzed 2d after treatment cessation. Experiments were performed 2–3 times with 6–8 mice per group and representative results shown; scRNAseq was performed once with 2 mice per group. Bars show s.e.m. (A) or standard deviation (all other panels). Statistical comparison of treatment groups was performed using two-way ANOVA (A left panel), one-way ANOVA with Sidak’s post-test (A right panel, C, E-H), or DESeq2 Wald test (B); ICI, immune checkpoint blockade; CTV, cell trace violet; *, p ≤ 0.05; **, p ≤ 0.01; ***, p ≤ 0.001; ****, p ≤ 0.0001.
Fig. 4.
Fig. 4.. Systemic myeloid reprogramming by ruxolitinib results in blocking G-CSF.
(A-C) Integrated CITE-seq analysis of tumor-infiltrating myeloid cells from EL4, LLC1 and MC38 tumors: (A) dimensionality-reduced plot and clustering of integrated dataset; (B) mRNA markers of 11 clusters. (C) Difference in relative cluster share between ICI+ruxolitinib treated mice and respective ICI treated controls, right: MoMac-VERSE (29) clusters most closely aligned with the observed clusters based on marker genes. (D-F) Bone marrow and blood from mice treated as in Figure 2A were analyzed by CITE-seq and flow cytometry: (D) dimensionality reduced map and clustering of combined dataset. (E) Flow cytometric analysis of bone marrow granulocytes; (F) relative expression of differentially expressed genes between ruxolitinib treated and vehicle treated mice in cluster 0 (differentiated neutrophils), MDSC markers shown in bold italic. (G) Expression of ruxolitinib-regulated genes in myeloid cells cultured in the presence of G-CSF for 0–5 days (GSE147910), MDSC markers in bold italic, right: volcano plot of G-CSF regulated genes at d1-5 vs d0, ruxolitinib-inhibited genes highlighted in blue. (H) MC38 tumor bearing mice were treated with low-dose G-CSF neutralizing antibody or isotype control every 3 days once palpable and ICI or isotype control once palpable and 7 days later, tumor size measured every 2 days; DEG, differentially expressed gene; moDC, monocyte-derived dendritic cell, mac, macrophage; ICI, immune checkpoint blockade. CITE-seq experiments were performed once and integrated data shown; experiments depicted in panels E and H were performed 2–3 times and representative results shown. Bars show standard deviation (E). Statistical comparison of experimental groups was performed using one-way ANOVA with Sidak’s post-test (E), DESeq2 Wald test (F-G) or two-way ANOVA (H); *, p ≤ 0.05; **, p ≤ 0.01; ***, p ≤ 0.001.
Fig. 5.
Fig. 5.. Ruxolitinib and nivolumab show efficacy in patients with relapsed or refractory classical Hodgkin lymphoma in a phase I clinical trial.
(A) Treatment and sample collection schedule. (B) Waterfall plot depicting tumor burden change as quantified by the sum of the product of diameters (SPD) change from baseline and best response as evaluated by LYRIC criteria. (C-K) Peripheral blood samples were collected at baseline and 8 days post-ruxolitinib treatment (C1d8), subjected to hematologic analysis and mononuclear cells isolated for further analysis: (C) absolute lymphocyte counts established by hematologic analyzer. (D) Neutrophil-to-lymphocyte ratio calculated as absolute neutrophil count divided by absolute lymphocyte count. (E) Change in the expression of PMN-MDSC markers by Veglia et al. as quantified by GSEA in bulk RNA-seq data. (F) Flow cytometric quantification of LOX1+ PMN-MDSCs in patients and normal donors. (G) Relative change in cytokine transcriptomic scores after ruxolitinib compared to baseline, MDSC associated cytokines highlighted. (H) Single-cell RNA-seq analysis of live PBMCs from 5 patients pre- and post-ruxolitinib: integrated dimensionality reduction and clustering and relative change in cluster frequencies post-ruxolitinib. (I) Change in NLR grouped by best clinical response. (J) Change in CIBERSORTx-estimated monocyte percentage grouped by best response. (K) Genes whose change in expression differs significantly between responders and non-responders, quantified by bulk RNA-seq; C2d1 is a timepoint after the first nivolumab dose. DEG, differentially expressed gene; ASDC, Axl+ Siglec6+ dendritic cells; GSEA, gene set enrichment analysis; CR, complete response; IR, indeterminate response; PD; progressive disease; PR, partial response; SD, stable disease; ORR, overall response rate; NES, normalized enrichment score; DC, dendritic cell; ILC; innate lymphoid cells; NK, natural killer cell; RBC, red blood cell; prog., progenitor cell; C1d8, Cycle 1 day 8; C2d1, Cycle 2 day 1; FDR, false discovery rate; MAIT, mucosal associated invariant T cell. Bars show standard deviation. Statistical comparison of experimental groups was performed using ratio paired Student’s t-test (C-D, F), GSEA test (E), one-way ANOVA with Sidak’s post-test (I-J), one-way ANOVA (K left) or two-way ANOVA (K right) (89).

References

    1. Weber R, Fleming V, Hu X, Nagibin V, Groth C, Altevogt P, Utikal J, Umansky V, Myeloid-Derived Suppressor Cells Hinder the Anti-Cancer Activity of Immune Checkpoint Inhibitors. Frontiers in immunology 9, (2018). - PMC - PubMed
    1. Liu X, Hogg GD, DeNardo DG, Rethinking immune checkpoint blockade: ‘Beyond the T cell’. Journal for ImmunoTherapy of Cancer 9, e001460 (2021). - PMC - PubMed
    1. Hotchkiss RS, Moldawer LL, Parallels between Cancer and Infectious Disease. New England Journal of Medicine 371, 380–383 (2014). - PubMed
    1. Wherry EJ, Kurachi M, Molecular and cellular insights into T cell exhaustion. Nature reviews. Immunology 15, 486–499 (2015). - PMC - PubMed
    1. Barber DL, Wherry EJ, Masopust D, Zhu B, Allison JP, Sharpe AH, Freeman GJ, Ahmed R, Restoring function in exhausted CD8 T cells during chronic viral infection. Nature 439, 682–687 (2006). - PubMed

Publication types

MeSH terms