Clinical Trial
. 2024 Jun 21;384(6702):eadf1329.
doi: 10.1126/science.adf1329. Epub 2024 Jun 21.

Combined JAK inhibition and PD-1 immunotherapy for non-small cell lung cancer patients

Affiliations
Clinical Trial

Combined JAK inhibition and PD-1 immunotherapy for non-small cell lung cancer patients

Divij Mathew et al. Science. .

Abstract

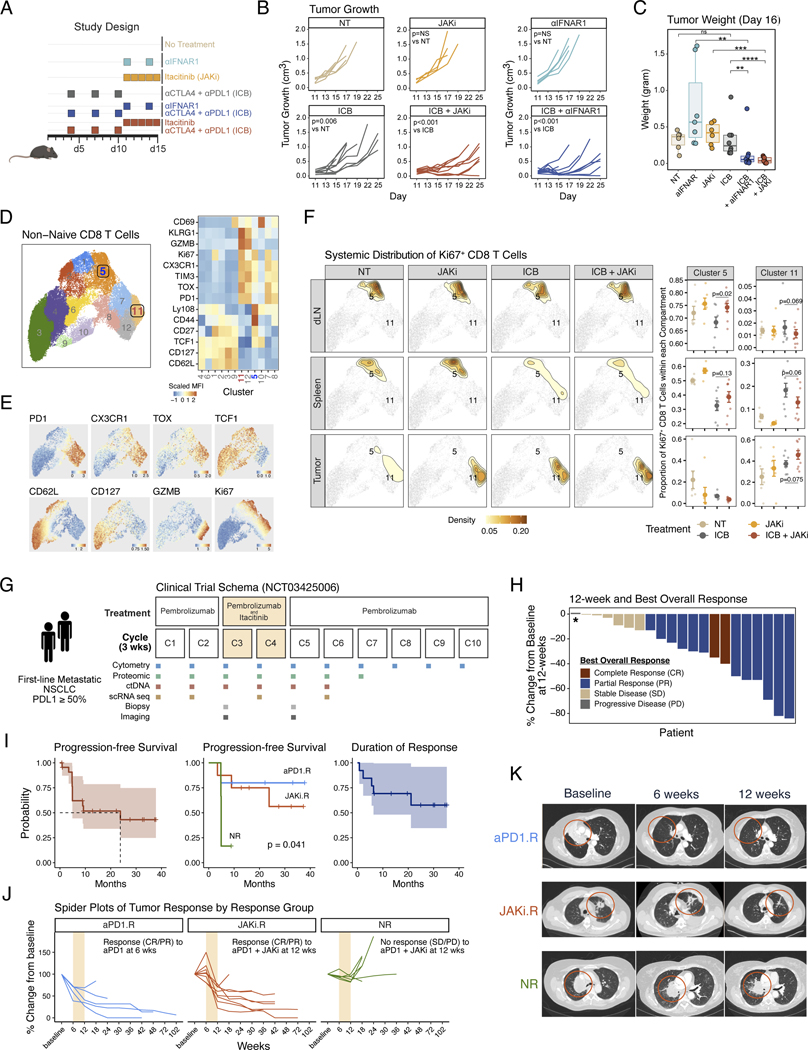
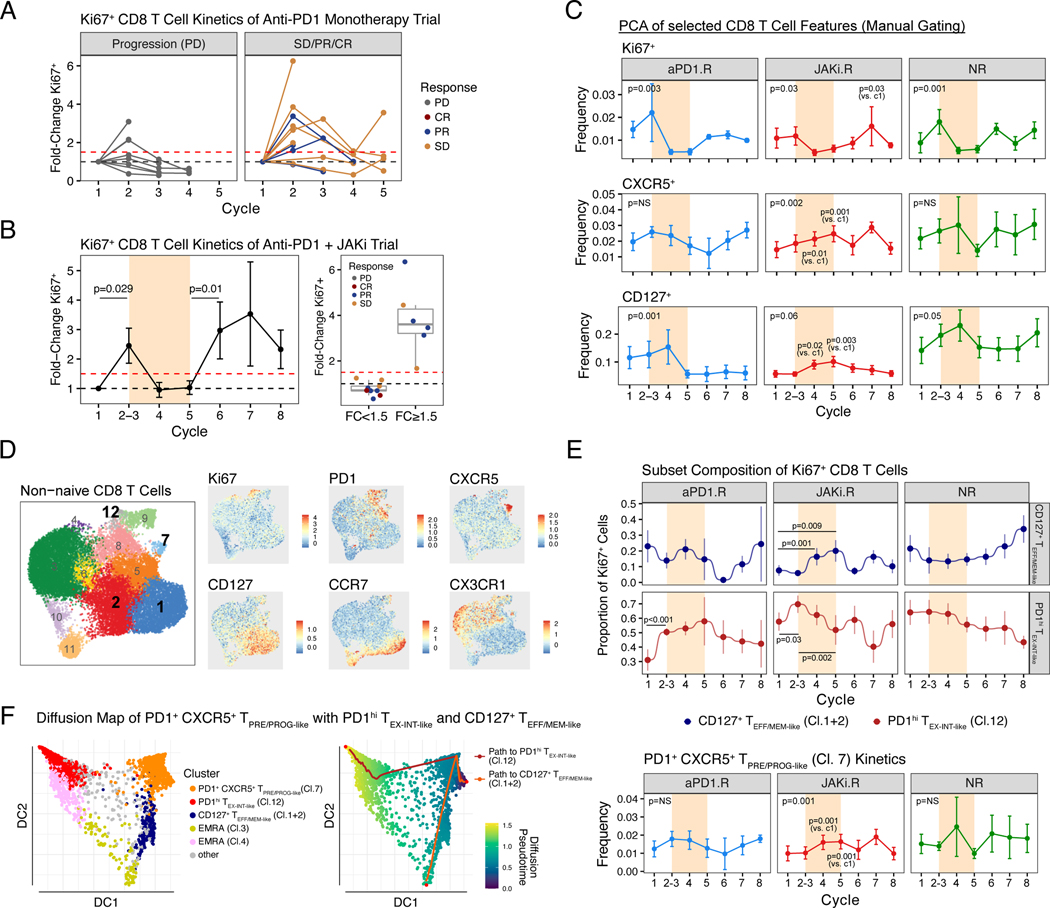
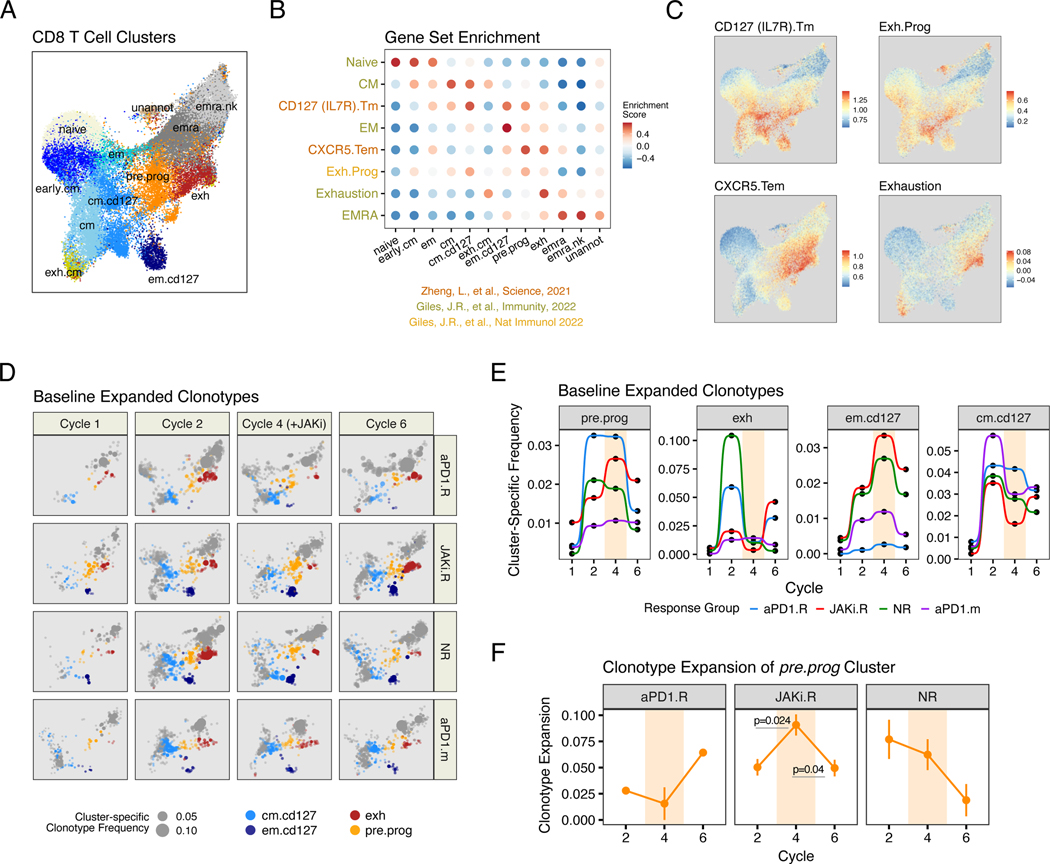
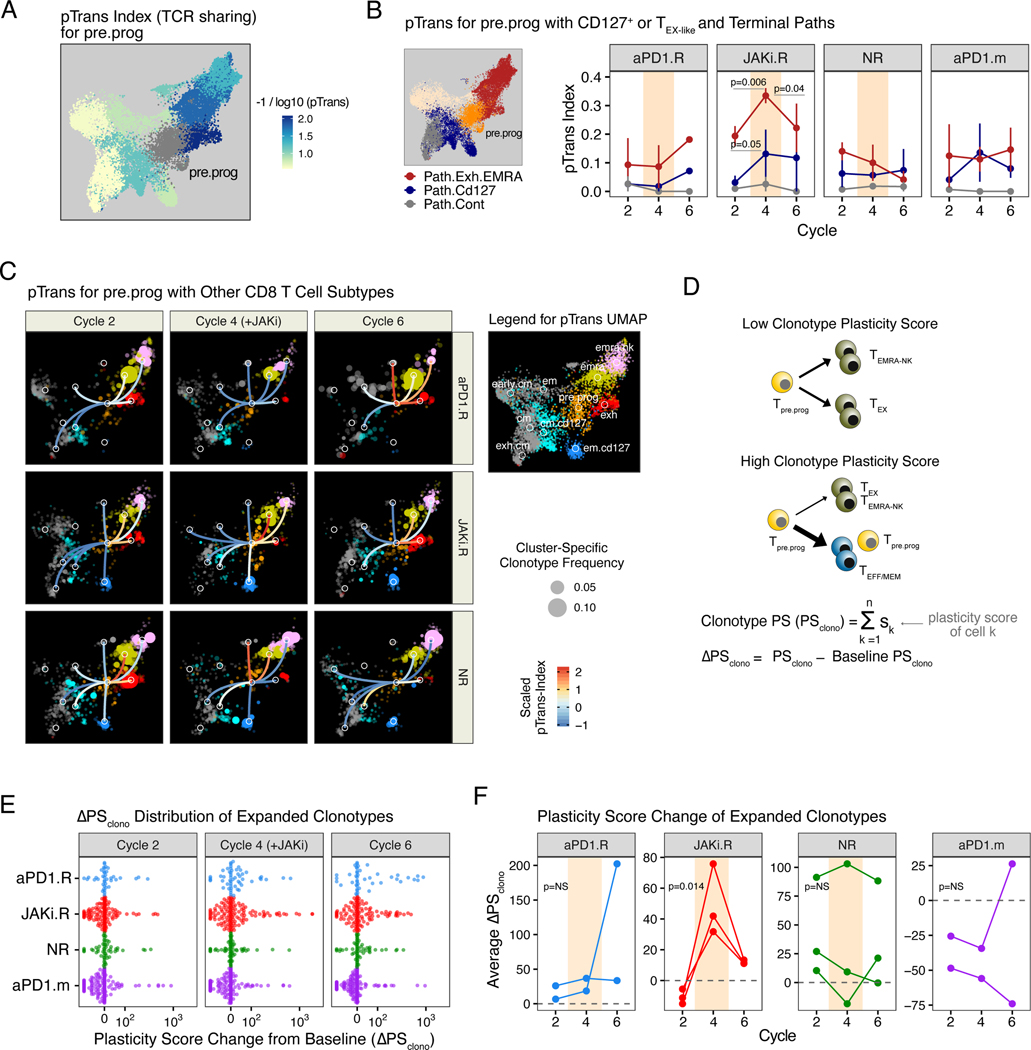
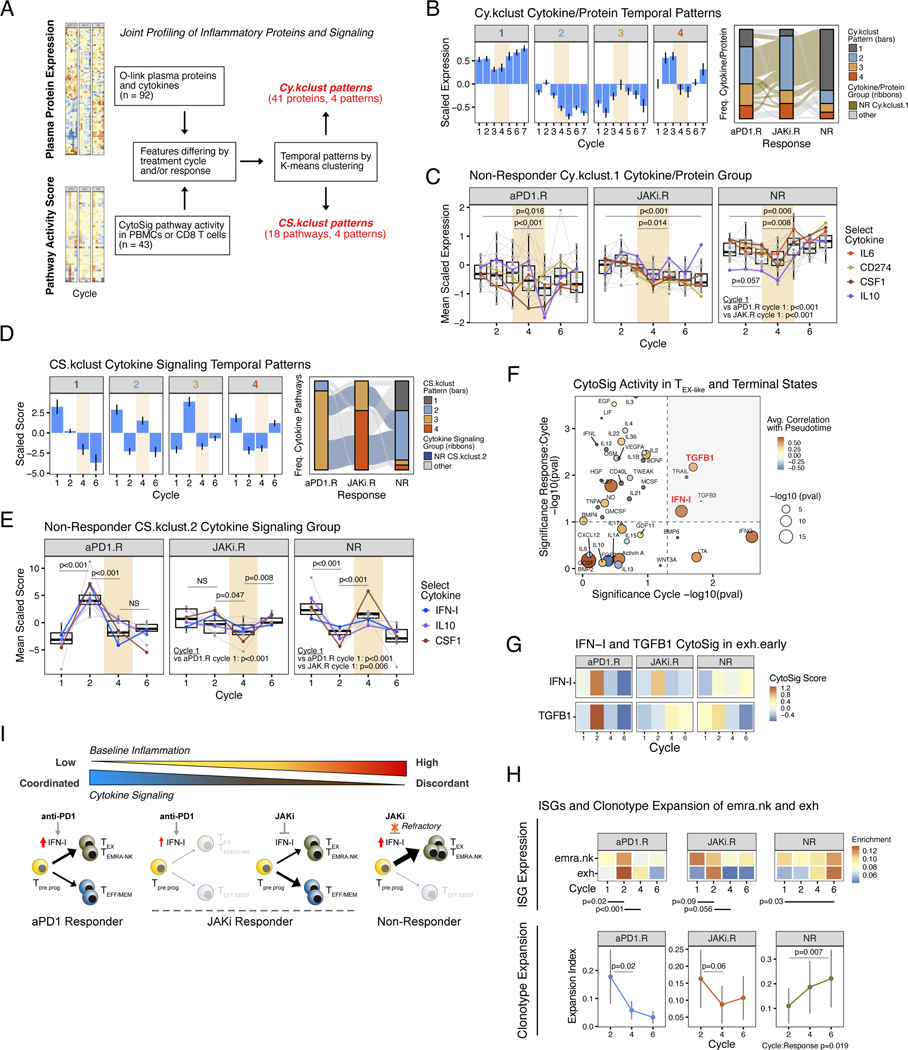
Persistent inflammation driven by cytokines such as type-one interferon (IFN-I) can cause immunosuppression. We show that administration of the Janus kinase 1 (JAK1) inhibitor itacitinib after anti-PD-1 (programmed cell death protein 1) immunotherapy improves immune function and antitumor responses in mice and results in high response rates (67%) in a phase 2 clinical trial for metastatic non-small cell lung cancer. Patients who failed to respond to initial anti-PD-1 immunotherapy but responded after addition of itacitinib had multiple features of poor immune function to anti-PD-1 alone that improved after JAK inhibition. Itacitinib promoted CD8 T cell plasticity and therapeutic responses of exhausted and effector memory-like T cell clonotypes. Patients with persistent inflammation refractory to itacitinib showed progressive CD8 T cell terminal differentiation and progressive disease. Thus, JAK inhibition may improve the efficacy of anti-PD-1 immunotherapy by pivoting T cell differentiation dynamics.


Figures

Fig. 1.
Fig. 1.. Pre-clinical and phase 2 clinical trial results of anti-PD1 immunotherapy and a JAK1 inhibitor for non-small cell lung cancer.
(A) Pre-clinical treatment regimen using ICB plus either itacitinib, a JAK1 inhibitor (JAKi), or anti-IFNAR1 antibody for mice bearing resistant B16-derived Res 499 tumors. (B) Mouse tumor growth curves in response to treatment strategy outlined in (A). (C) Mouse tumor weights at day 16 after the indicated treatment. (D) Flow cytometry features from non-naive CD8 T cells from Res 499 mouse tumors, the draining lymph node (dLN), and spleen projected on UMAP space. Shown are 12 FlowSOM clusters (left) along with heat map of scaled MFI for all marker proteins arranged by hierarchical clustering (right). (E) MFI expression of select protein markers overlaid on cluster UMAP. (F) Systemic distribution of all Ki67+ CD8 T cells compared across dLN, spleen, and tumor (left density plots) overlaid on the UMAP from (D) (light grey dots). Locations for clusters 5 and 11 are labeled on the density plot overlay. The relative frequencies in each tissue compartment for cells belonging to cluster 5 or 11 are also shown (right dot plots). (G) Schema of phase 2 clinical trial for pembrolizumab and delayed administration of itacitinib for first-line metastatic NSCLC with tumor PDL1 ≥ 50%. Times of treatment, sample collection, and response assessment by imaging are shown relative to each 3-week treatment cycle. (H) Waterfall plot of 12-week tumor response for each patient. Patients are color-coded by best objective response (BOR) that includes response with additional follow-up beyond 12-weeks. Asterisk indicates a patient who clinically progressed prior to the 12-week assessment. (I) Survival curves for overall progression-free survival, progression-free survival by response group defined in (J), and overall duration of response. The 95% confidence intervals are shaded. (J) Spider plots indicating change in tumor measurements from baseline for patients in each response group. Patients were categorized as either an anti-PD1 responder (aPD1.R) if a complete response (CR) or partial response (PR) was observed at 6-weeks after pembrolizumab but prior to itacitinib, a JAKi responder (JAKi.R) if a CR or PR was not observed until 12-weeks after itacitinib, or a non-responders (NR) if a CR or PR was not observed at 12-weeks. Cycles when JAKi was added to anti-PD1 are highlighted in bisque. (K) Representative computerized tomography (CT) scan from aPD1.R, JAK1.R, and NR at baseline, 6 weeks, and 12 weeks. Significance for tumor growth was determined by a mixed-effect regression model. For pairwise comparisons, a two-sided Wilcox test or t-test was used for non-parametric or parametric data, respectively. Survival differences were determined by a log-rank test. Error bars represent SEM.
Fig. 2.
Fig. 2.. Patient responses after anti-PD1 immunotherapy or JAK inhibition are associated with longitudinal changes in CD8 T cells.
(A) Fold-change in the percentage of Ki67+ CD8 T from a cohort of NSCLC patients treated with anti-PD1 monotherapy (MSKCC cohort). Patients are faceted by progression of disease (PD) or no progression (SD, PR, or CR) with dotted lines representing baseline (black) or a 1.5-fold increase over baseline (red). (B) Fold-change in the percentage of Ki67+ CD8 T from all analyzable patients treated on a clinical trial (this study) of anti-PD1 + JAKi (left). Cycles when JAKi was added to anti-PD1 are highlighted in bisque. Also shown are responses for patients grouped by the status of a 1.5-fold threshold change in Ki67+ CD8 T cells after cycle 1–2 of anti-PD1 (right). (C) Frequency changes of Ki67+, CXCR5+, and CD127+ CD8 T cells across treatment cycles and faceted by treatment response. Markers were selected based on PCA of manually gated flow cytometry features (fig. S2B-F). (D) UMAP and cluster assignment of peripheral non-naïve CD8 T cells analyzed by flow cytometry (left) along with an overlay of the MFI values for the indicated marker proteins (right). (E) Proportions of CD127+ TEFF/MEM-like clusters 1 and 2 and PDhi TEX-INT-like cluster 12 relative to all Ki67+ CD8 T cells (top) and the frequency of PD1+ CXCR5+ TPRE/PROG-like cluster 7 cells relative to non-naïve CD8 T cells (bottom). (F) Trajectory analysis by diffusion mapping for the indicated CD8 T cell subtypes (left) with pseudotime values and predicted paths overlaid (right). For longitudinal data, significance was determined by beta regression for frequency data and Dirichlet regression for compositional data. Error bars represent SEM.
Fig. 3.
Fig. 3.. Evolution in CD8 T cell clonotypes after anti-PD1 immunotherapy and JAK inhibition correlates with treatment and response.
(A) UMAP of peripheral CD8 T cell subtypes analyzed by scRNA/TCR-seq from the start of cycles 1, 2, 4, and 6 from aPD1.R patients (n=2), JAKi.R patients (n=3), NR patients (n=3), and a separate cohort of patients treated with anti-PD1 monotherapy (aPD1.m) (n=2). (B) GSVA enrichment scores for each CD8 T cell cluster (x-axis) using the indicated CD8 T cell subtype gene set (y-axis). Source of the gene sets are indicated. (C) Enrichment scores for select gene sets overlaid on the UMAP from (A). (D) UMAP from (A) showing the frequency (expansion) of clonotypes belonging to the indicated color-coded CD8 T cell subtype (size of dot). Clonotypes that belonging to other subtypes are shown in grey. (E) Cumulative frequencies for expanded TCR clonotypes belonging to the indicated CD8 T cell subtype. Data for individual patients are pooled by treatment group. Cycles when JAKi was added to anti-PD1 are highlighted in beige. (F) Clonotype expansion score (measuring degree of clonality) for pre.prog CD8 T cells from each indicated response group. Cycles when JAKi was added to anti-PD1 are highlighted. For longitudinal data, significance was determined by a repeated measures ANOVA using a mixed effect model and post-hoc interaction analysis. Error bars represent SEM.
Fig. 4.
Fig. 4.. Response to combined JAK inhibition and anti-PD1 immunotherapy is associated with alterations to CD8 T cell differentiation dynamics and clonotype plasticity.
(A) Pairwise transition (pTrans) index values (measuring TCR sharing) from the pre.prog subtype to other subtypes overlaid on the UMAP shown in Fig. 3A. (B) pTrans-index values between pre.prog CD8 T cells and either exh and terminal EMRA (emra, emra.nk) clusters (Path.Exh.EMRA, red), or em.cd127 and cm.cd127 clusters (Path.Cd127, blue). For comparison, results to the unrelated cm and exh.cm clusters (Path.Cont) are also shown. (C) pTrans-index values between the pre.prog subtype and other subtypes (legend in right margin) overlaid on a UMAP (from Fig. 3A) of expanded CD8 T cell clonotypes faceted by treatment cycle and response group. Edges connecting nodes from the pre.prog subtype to other subtypes are color-coded by the pTrans-index value (higher scores indicate greater TCR sharing and hence developmental relatedness, the absence of edges indicate no detectable sharing). Subtype-specific clonotype frequency is represented by dot size. (D) Schema and derivation of the plasticity scores (PS) using the pTrans-indices for each CD8 T cell subtype and the ΔPSclono using the difference of PS values from baseline. (E) ΔPSclono of all expanded clones colored by response group and faceted by treatment cycles. Positive ΔPSclono represents an altered clonotype subtype composition resulting from an increased plasticity (F) Mean ΔPSclono for patients in each of the indicated response groups. For longitudinal data, significance was determined by a repeated measures ANOVA using a mixed effect model and post-hoc interaction analysis. Error bars represent SEM.
Fig. 5.
Fig. 5.. Refractoriness to JAK inhibition and persistent inflammation are associated with terminal CD8 T cell differentiation and therapy failure.
(A) Schema for joint profiling of plasma cytokines and immune signaling activity and their classification into temporal expression patterns. (B) Temporal expression patterns for plasma cytokines/proteins (Cy.kclust, left bar plots) along with their distribution in each response group (right alluvial plots). The ribbon in the alluvial plot is color-coded to track how Cy.kclust.1 cytokines/proteins from NR patients (tan-colored) change patterns in other response groups. (C) Expression of proteins/cytokines belonging to the Cy.kclust.1 pattern from NR patients (tan ribbon in alluvial plot from (B)) is shown for all response groups. Select suppressive cytokines are color-coded. P-values are for comparisons using all proteins/cytokines plotted (grey dots and lines). Cycles when JAKi was added to anti-PD1 are highlighted in bisque. (D) Temporal expression patterns for cytokine signaling activity in immune cells (CS.kclust, left bar plots) along with their distribution in each response groups (right alluvial plots). The ribbon in the alluvial plot is color-coded to track how CS.kclust.2 pathways from NR patients (blue-colored) change patterns in other response groups. (E) Activity score of cytokine pathways belonging to the CS.kclust.2 pattern from NR patients (blue ribbon in alluvial plot from (D)) is shown for all response groups. Select suppressive cytokines and IFN-I are color-coded. P-values are for comparisons using all pathways plotted (grey dots and lines). Cycles when JAKi was added to anti-PD1 are highlighted in bisque. (F) Cytokine pathway activity associated with CD8 T cell differentiation, treatment cycle, and response. Correlation of CD8 T cell pathway activity with pseudotime from trajectory analysis using all CD8 T cell subtypes are color-coded with circles size representing significance of the correlation (small grey dots are non-significant). The significance of changes in pathway activity in emra.nk and exh subtypes across treatment cycles (main effect) is shown on the x-axis, and the significance of whether changes across cycles differs by response group (interaction effect) is shown on the y-axis. Dotted lines represent significance levels (p=0.05 for main effect, p=0.10 for interaction effect) and grey upper-right quadrant show pathways that significantly differ by main and interaction effects. (G) Inferred CytoSig signaling activity for IFN-I and TGFB1 in exh CD8 T cells across treatment cycles. Shown are averages for each response group. Significance values are shown in (F). (H) Average ISG expression in terminal exh and emra.nk subtypes for each response group across treatment cycles (top). P-values for the indicated comparisons are shown. Also shown are the average expansion index (measure of clonality) for these subtypes (bottom). (I) Model summarizing relationship between inflammation, cytokine signaling in immune cells after anti-PD1, the impact of IFN-I on CD8 T cell differentiation toward either terminal or less committed states, and consequence of JAK inhibition. For longitudinal data, significance was determined by a repeated measures ANOVA using a mixed effect model and post-hoc interaction analysis. Error bars represent SEM.

Comment in

  • JAKing up immunity.
    Gadina M, O'Shea JJ. Gadina M, et al. Science. 2024 Jun 21;384(6702):1303-1304. doi: 10.1126/science.adq1717. Epub 2024 Jun 20. Science. 2024. PMID: 38900897

References

    1. Reck M. et al., Pembrolizumab versus Chemotherapy for PD-L1-Positive Non-Small-Cell Lung Cancer. N. Engl. J. Med. 375, 1823–1833 (2016). doi: 10.1056/NEJMoa1606774; pmid: 27718847 - DOI - PubMed
    1. Memon D. et al., Clinical and molecular features of acquired resistance to immunotherapy in non-small cell lung cancer. Cancer Cell 42, 209–224.e9 (2024). doi: 10.1016/j.ccell.2023.12.013; pmid: 38215748 - DOI - PMC - PubMed
    1. Ng CT et al., Blockade of interferon Beta, but not interferon alpha, signaling controls persistent viral infection. Cell Host Microbe 17, 653–661 (2015). doi: 10.1016/j.chom.2015.04.005; pmid: 25974304 - DOI - PMC - PubMed
    1. Wilson EB et al., Blockade of chronic type I interferon signaling to control persistent LCMV infection. Science 340, 202–207 (2013). doi: 10.1126/science.1235208; pmid: 23580528 - DOI - PMC - PubMed
    1. Teijaro JR et al., Persistent LCMV infection is controlled by blockade of type I interferon signaling. Science 340, 207–211 (2013). doi: 10.1126/science.1235214; pmid: 23580529 - DOI - PMC - PubMed

Publication types

MeSH terms