. 2024 Nov 5;120(13):1607-1621.
doi: 10.1093/cvr/cvae139.

Embryonic alcohol exposure in zebrafish predisposes adults to cardiomyopathy and diastolic dysfunction

Affiliations

Embryonic alcohol exposure in zebrafish predisposes adults to cardiomyopathy and diastolic dysfunction

Olivia Weeks et al. Cardiovasc Res. .

Abstract

Aims: Fetal alcohol spectrum disorders (FASDs) impact up to 0.8% of the global population. However, cardiovascular health outcomes in adult patients, along with predictive biomarkers for cardiac risk stratification, remain unknown. Our aim was to utilize a longitudinal cohort study in an animal model to evaluate the impact of embryonic alcohol exposure (EAE) on cardiac structure, function, and transcriptional profile across the lifespan.

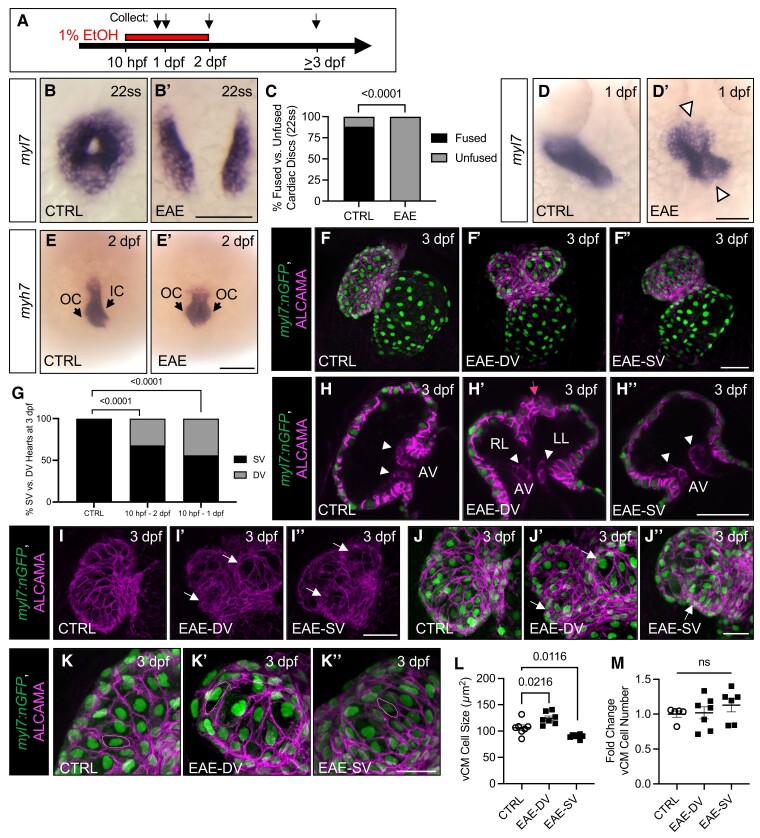
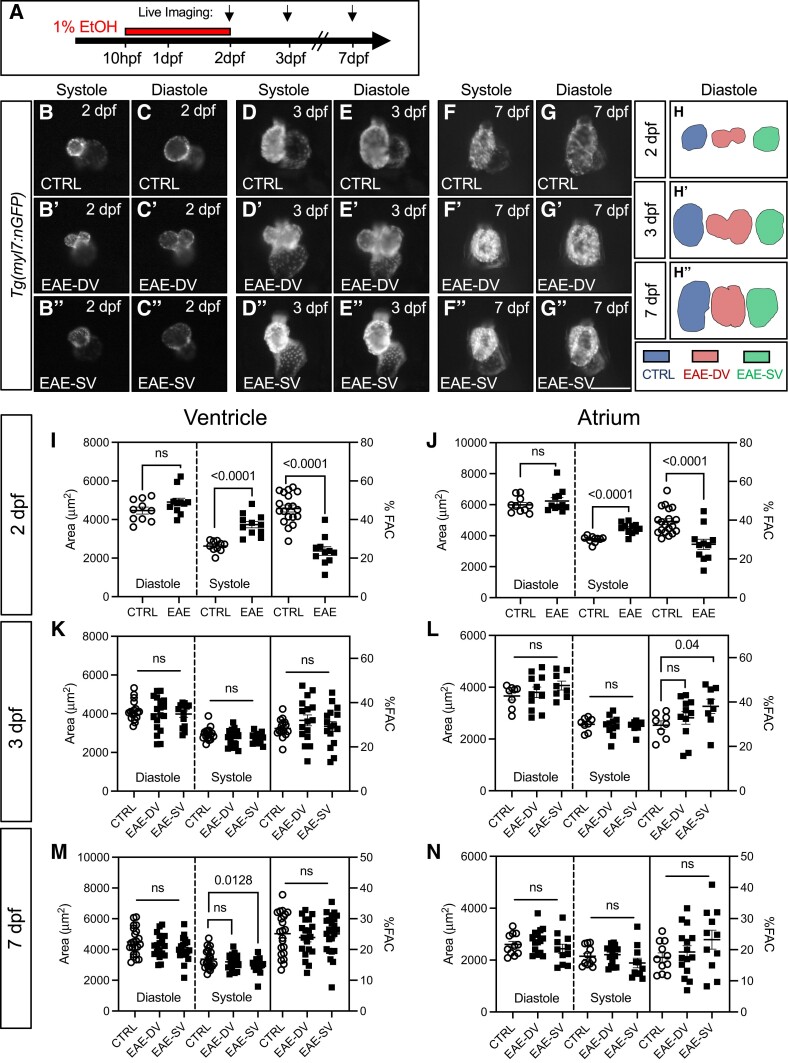
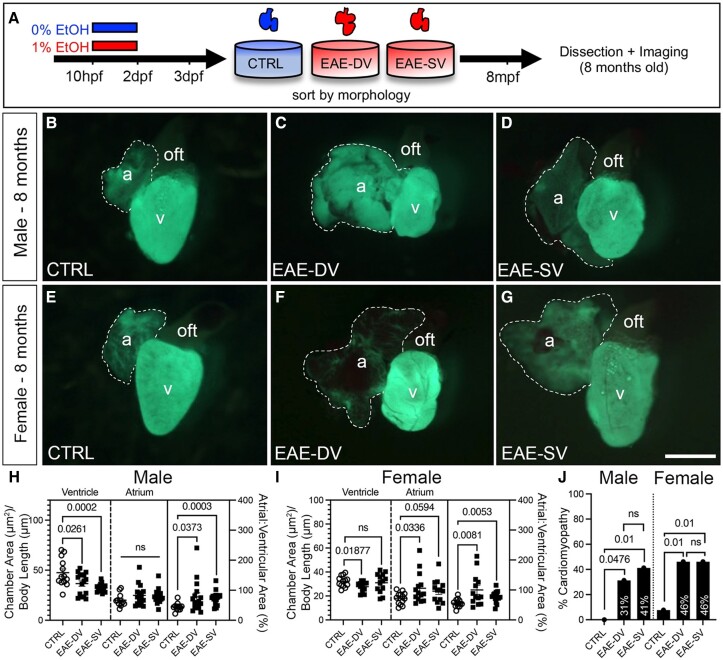
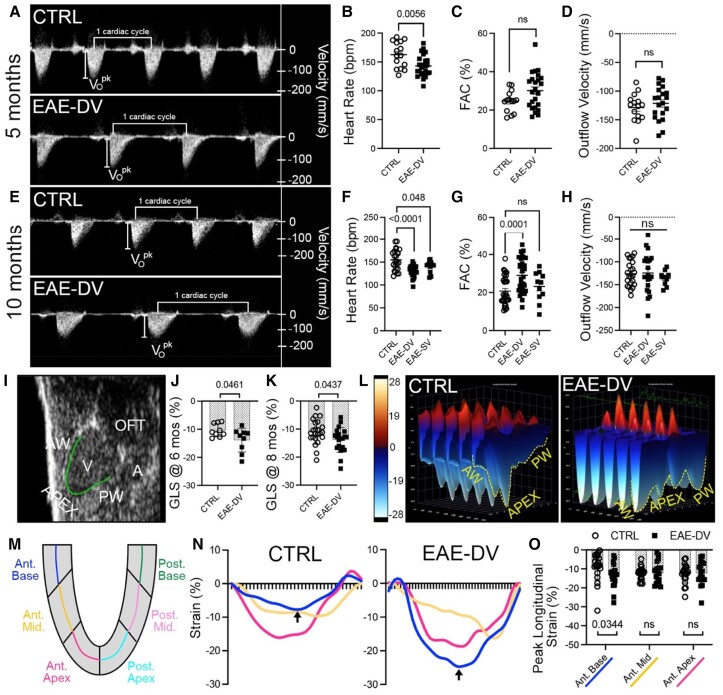
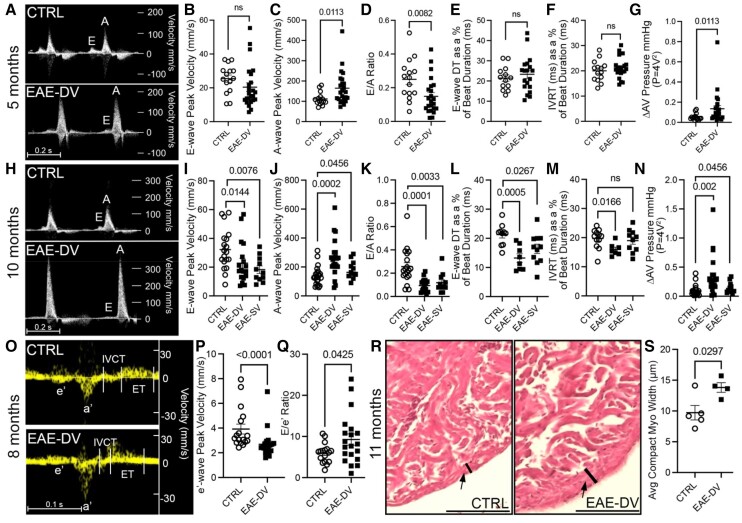
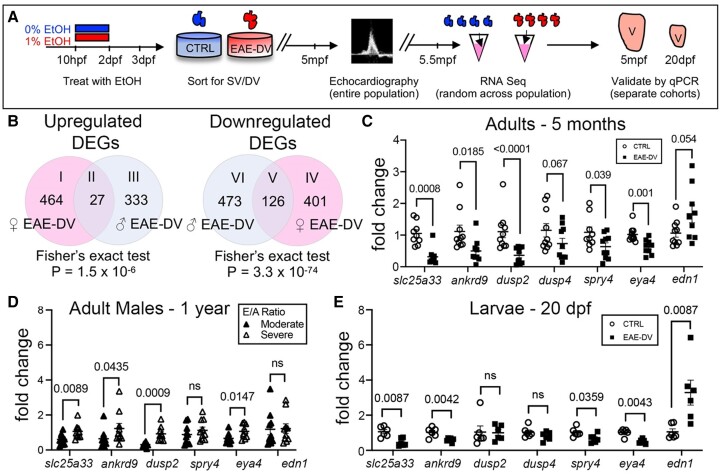
Methods and results: Using zebrafish, we characterized the aftereffects of EAE in adults binned by congenital heart defect (CHD) severity. Chamber sizes were quantified on dissected adult hearts to identify structural changes indicative of cardiomyopathy. Using echocardiography, we quantified systolic function based on ejection fraction and longitudinal strain, and diastolic function based on ventricular filling dynamics, ventricular wall movement, and estimated atrial pressures. Finally, we performed RNA-sequencing on EAE ventricles and assessed how differentially expressed genes (DEGs) correlated with cardiac function. Here, we demonstrate that EAE causes cardiomyopathy and diastolic dysfunction through persistent alterations to ventricular wall structure and gene expression. Following abnormal ventricular morphogenesis, >30% of all EAE adults developed increased atrial-to-ventricular size ratios, abnormal ventricular filling dynamics, and reduced myocardial wall relaxation during early diastole despite preserved systolic function. RNA-sequencing of the EAE ventricle revealed novel and heart failure-associated genes (slc25a33, ankrd9, dusp2, dusp4, spry4, eya4, and edn1) whose expression levels were altered across the animal's lifespan or correlated with the degree of diastolic dysfunction detected in adulthood.

Conclusion: Our study identifies EAE as a risk factor for adult-onset cardiomyopathy and diastolic dysfunction, regardless of CHD status, and suggests novel molecular indicators of adult EAE-induced heart disease.

Keywords: Diastolic dysfunction; Fetal alcohol spectrum disorders; Prenatal alcohol exposure.


Conflict of interest statement

Conflict of interest: none declared.

Figures

Figure 1
Figure 1
EAE disrupts cardiac disc fusion and heart tube formation, leading to downstream ventricular defects. A. Schematic of EtOH exposure window. BB’. ISH for myl7 demonstrating EtOH-induced abnormalities in cardiac disc fusion. C. Percent of embryos with an unfused cardiac disc following 1% EtOH exposure (10 hpf–22ss; n = 81/81 unfused in 1% EtOH vs. 12/102 unfused in 0% EtOH). DE’. ISH for myl7 (24 hpf) and myh7 (48 hpf) demonstrating EtOH-induced abnormalities in the linear heart tube (D–D’) and ventricle (E–E’). FF’’. Confocal imaging of ALCAMA stained Tg(myl7:nGFP) embryos at 76 hpf showing EAE-DV and EAE-SV phenotypes (76 hpf). G. Rate of single and double ventricle formation (72 hpf) following 1% EtOH from 10 to 48 hpf (n = 29/92 bi-lobed in 1% EtOH vs. 0/98 bi-lobed in 0% EtOH) and 10–24 hpf (n = 36/81 bi-lobed in 1% EtOH vs. 0/98 bi-lobed in 0% EtOH). HK’’. Confocal imaging of ALCAMA stained Tg(myl7:nGFP) embryos (76 hpf). All EAE embryos have a single AV canal lined with endocardial cushion cells (white arrows), and EAE-DV larvae have a single outflow tract (pink arrow) despite the DV phenotype (H–H’’). EAE-SV and -DV larvae also have defects in cardiomyocyte organization, with the ventricle wall showing lumpy protrusions (white arrows, I–J’’). Abnormalities in cell size were also observed in EAE adults, with EAE-DV ventricles having larger and EAE-SV ventricles having smaller ventricular cardiomyocytes (vCMs [K–K’’]). LM. Quantification of vCM cell number and cell size (n > 6 per condition, 76 hpf). Data are presented as the standard error of the mean. Statistical significance was determined by Fisher's exact test (C, G) or an unpaired, two-tailed Student's t-test assuming equal variances (LM). P-values or upper bounds are shown. Scale bars: 100 μm (BB’, DD’, EE’), 50 μm (FF’’, HI’), 25 μm (JK’’). OC, outer curvature, IC, inner curvature; RL, right lobe; LL, left lobe; AV, atrioventricular canal, and ns, non-significant (P > 0.05).
Figure 2
Figure 2
EAE causes persistent abnormalities in ventricular shape and acute recoverable systolic failure. A. Schematic of EtOH exposure windows. BG’’. Live imaging of CTRL and EAE Tg(myl7:nGFP) hearts at 48, 75, and 168 hpf in systole and diastole. HH’’. 2D traces of ventricular chamber shape in representative CTRL, EAE-SV, and EAE-DV samples at 48, 75, and 168 hpf. IJ. Quantification of ventricular (I) and atrial (J) chamber area and %FAC from live-imaged CTRL and EAE (EAE-SV and EAE-DV combined) Tg(myl7:nGFP) hearts (n  > 10, 48 hpf). EAE hearts have evidence of acute systolic failure. KL. Quantification of ventricular (K) and atrial (L) chamber area and FAC from live-imaged CTRL, EAE-DV, and EAE-SV Tg(myl7:nGFP) hearts (n  > 8, 75 hpf). M–N. Quantification of ventricular (M) and atrial (N) chamber area and FAC in live-imaged CTRL, EAE-DV, and EAE-SV casper;Tg(myl7:nGFP) hearts (n  > 11, 168 hpf). Data are presented as the standard error of the mean. Statistical significance was determined by an unpaired, two-tailed Student's t-test assuming equal variances (IN). P-values are shown. Scale bars: 100 μm. ns, non-significant (P > 0.05).
Figure 3
Figure 3
EAE predisposes to changes in adult atrial and ventricular chamber shape and size. A. Schematic of embryonic alcohol treatment, embryo sorting, and adult heart evaluations. BG. Fluorescent images of dissected CTRL and EAE Tg(myl7:nGFP) hearts at 8 mpf showing atrial enlargement and reduced ventricle size in 8-month adults. a = atrium, v = ventricle, and oft = outflow tract. H. Ventricle and atrial area normalized to body length and atrial:ventricular area (%) in 8 mpf males (n  > 12). I. Ventricle and atrial area normalized to body length and atrial:ventricular area (%) in 8 mpf females (n  > 13). J. Cardiomyopathy incidence in dissected male and female 8 mpf hearts (Fisher's exact test, n  > 11). For H–I, statistical significance was determined using an unpaired, two-tailed Student's t-test when comparing normally distributed samples or a nonparametric Mann–Whitney test for those without a normal distribution. P-values are shown. Scale bars: 100 μm. ns, non-significant (P > 0.05).
Figure 4
Figure 4
Embryonic alcohol-exposed adults have preserved systolic function by echocardiography. A. Pulsed wave Doppler (PD) measurements of blood movement across the BV valve in representative 5 mpf CTRL and EAE-DV males show bradycardia and normal blood outflow velocity during systole. Vo = peak outflow blood velocity. BD. Quantitative measurements of heart rate (B), FAC (C), and peak outflow velocity (D) for CTRL and EAE males (n  > 15, 5 mpf). E. PD measurement of blood movement across the BV valve in representative 10 mpf CTRL and EAE-DV males shows bradycardia and normal blood outflow velocity during systole. FH. Quantitative measurements of heart rate (F), FAC (G), and peak outflow velocity (H) for CTRL and EAE males (n  > 11, 10 mpf). I. B-mode ultrasound image of a zebrafish heart identifying the region traced for strain analysis (green line). JK. Measurement of GLS showing increased GLS in EAE-DV males at 6 mpf (J) and 8 mpf (K [n  > 9]). L. 3D heatmap of longitudinal strain across five cardiac cycles in 8 mpf males. EAE-DV males have increased strain in the base regions of the AW and PW. M. Diagram showing the segmentation of the ventricle wall into posterior and anterior base, mid, and apex regions. N. Region-specific measurements of % strain in CTRL and EAE-DV males across a single cardiac cycle from peak diastole to peak diastole, with the x-axis as time in image frames. Black arrows indicate areas of difference in peak longitudinal strain in anterior base measurements between cohorts. O. Quantitative measurement of peak longitudinal strain in CTRL and EAE-DV 8 mpf males across the anterior base, mid, and apex regions. Statistical significance was determined using an unpaired, two-tailed Student's t-test assuming equal variances (BD, FH, JK) or a nonparametric Mann–Whitney test (O). P-values are shown. AW = anterior wall, PW, apex; V, ventricle; A, atrium; OFT, outflow tract; ns, non-significant (P > 0.05).
Figure 5
Figure 5
Diastolic dysfunction develops in embryonic alcohol-exposed adults. A. Pulsed wave Doppler (PD) measurements of blood movement across the AV valve in CTRL and EAE-DV 5-month-old males shown increased peak active ventricular filling velocity (A-wave). BF. Quantitative measurements of peak E-wave (B, n  > 15) velocity, peak A-wave velocity (C, n  > 14), E/A ratio (D, n  > 15), E-wave deceleration time (E, n  > 13), and isovolumic relaxation time (F, n  > 14) acquired through pulsed wave Doppler measurements in 5 mpf CTRL and EAE-DV males. G. Estimation of net pressure across the AV valve using the simplified Bernoulli equation in 5 mpf CTRL and EAE-DV males (n  > 15). H. PD measurements of blood movement across the AV valve in CTRL, EAE-SV, and EAE-DV 10-month-old males show decreased peak passive (E-wave) and increased active (A-wave) ventricular filling velocity. IM. Quantitative measurements of peak E-wave (I, n  > 11) velocity, peak A-wave velocity (J, n  > 11), E/A ratio (K, n  > 11), E-wave deceleration time (L, n  > 8), and isovolumic relaxation time (M, n  > 7) acquired through PD measurements in 10 mpf CTRL, EAE-SV, and EAE-DV males. N. Estimation of net pressure across the AV valve using the simplified Bernoulli equation in 10 mpf CTRL, EAE-SV, and EAE-DV males (n  > 9). O. Tissue Doppler echocardiography detecting myocardial wall movement adjacent to the AV valve. PQ. Quantitative assessment of peak e’ velocity (P, n  > 17) and E/e’ ratio (Q, n  > 17) in 8 mpf CTRL and EAE-DV males. R. H&E staining of representative 11 mpf CTRL and EAE-DV males showing thickening of the compact myocardial wall (black arrow, black line). S. Quantification of average compact myocardial wall thickness in 11 mpf males (n  > 4). Statistical significance was determined using an unpaired, two-tailed Student's t-test assuming equal variances (E–F, I (CTRL vs. EAE-SV), L, M, Q, S) or a nonparametric Mann–Whitney test (B–D, F, I (CTRL vs. EAE-DV), J–K, N, P). P-values are shown. Scale bars: 100 μm. E, E-wave; A, A-wave; e’, AV annulus tissue velocity during early diastole; a’, AV annulus tissue velocity during late diastole; IVCT, isovolumic contraction time; ET, ejection time, and ns, non-significant (P > 0.05).
Figure 6
Figure 6
RNA-sequencing identifies novel DEGs that distinguish CTRL from EAE-DV ventricles during larval and adult stages. A. Schematic outlining the RNA-sequencing and qPCR validation pipeline. B. A Venn diagram depicting unique and overlapping upregulated and downregulated DEGs relative to CTRLs between EAE-DV males and females. C. qRT–PCR on pooled isolated 5 mpf male and female ventricles reveals reproducibly dysregulated genes (n = pools of 3 males, >6 females per condition). D. qRT–PCR on pooled isolated 1-year-old male ventricles show that slc25a33, ankrd9, dusp2, and eya4 are significantly decreased in individuals with a moderate reduction in E/A ratio relative to those with a severe decrease in E/A ratio (n  > 8). Fold change is calculated relative to the average normalized gene expression level of all sampled individuals. E. qRT–PCR on pooled isolated 20 dpf ventricles identifies a subset of the adult DEGs that are dysregulated during larval stages (n = 6). For CE, statistical significance was determined using an unpaired, two-tailed Student's t-test assuming equal variances for groups with a normal distribution or a nonparametric Mann–Whitney test for comparisons between groups without normal distribution. For E, outliers were excluded using ROUT (Q = 1%). P-values are shown. ns, non-significant (P > 0.05).

Similar articles

Cited by

References

    1. Hoyme EH, Kalberg WO, Elliott AJ, Blankenship J, Buckley D, Marais A-S, Manning MA, Robinson LK, Adam MP, Abdul-Rahman O. Updated clinical guidelines for diagnosing fetal alcohol spectrum disorders. Pediatrics 2016;138:e20154256.2. - PMC - PubMed
    1. Wozniak JR, Riley EP, Charness ME. Clinical presentation, diagnosis, and management of fetal alcohol spectrum disorder. Lancet Neurol 2019;18:760–770. - PMC - PubMed
    1. May PA, Baete A, Russo J, Elliott AJ, Blankenship J, Kalberg WO, Buckley D, Brooks M, Hasken J, Abdul-Rahman O, Adam MP, Robinson LK, Manning M, Hoyme HE. Prevalence and characteristics of fetal alcohol spectrum disorders. Pediatrics 2014;134:855–866. - PMC - PubMed
    1. Beaulieu D, Treit S, Pagano JJ, Beaulieu C, Thompson R. Cardiac magnetic resonance imaging in individuals with prenatal alcohol exposure. CJC Pediatr Congenit Hear Dis 2023;2:150–161. - PMC - PubMed
    1. Jones KL, Smith DW, Hanson JW. The fetal alcohol syndrome: clinical deliniation. Ann Ny Acad Sci 1976;273:130–137. - PubMed

MeSH terms