Postmortem Analysis of Dolutegravir, Tenofovir, Lamivudine, and Efavirenz Penetration in Multiple Central Nervous System Compartments
- PMID: 38900910
- PMCID: PMC11565900
- DOI: 10.1093/infdis/jiae325
Postmortem Analysis of Dolutegravir, Tenofovir, Lamivudine, and Efavirenz Penetration in Multiple Central Nervous System Compartments
Abstract
Background: Central nervous system (CNS) compartmentalization provides opportunity for human immunodeficiency virus (HIV) persistence and resistance development. Differences between cerebrospinal fluid (CSF) and cerebral matter regarding HIV persistence are well described. However, CSF is often used as surrogate for CNS drug exposure, and knowledge from solid brain tissue is rare.
Methods: Dolutegravir, tenofovir, lamivudine, and efavirenz concentrations were measured across 13 CNS regions plus plasma in samples collected during autopsy in 49 Ugandan decedents. Median time from death to autopsy was 8 hours (interquartile range, 5-15 hours). To evaluate postmortem redistribution, a time course study was performed in a mouse model.
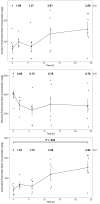
Results: Regions with the highest penetration ratios were choroid plexus/arachnoid (dolutegravir and tenofovir), CSF (lamivudine), and cervical spinal cord/meninges (efavirenz); the lowest were corpus callosum (dolutegravir and tenofovir), frontal lobe (lamivudine), and parietal lobe (efavirenz). On average, brain concentrations were 84%, 87%, and 76% of CSF for dolutegravir, tenofovir, and lamivudine, respectively. Postmortem redistribution was observed in the mouse model, with tenofovir and lamivudine concentration increased by 350% and efavirenz concentration decreased by 24% at 24 hours postmortem.
Conclusions: Analysis of postmortem tissue provides a unique opportunity to investigate CNS antiretroviral penetration. Regional differences were observed paving the way to identify mechanisms of viral compartmentalization and/or neurotoxicity.
Keywords: HIV; antiretroviral; central nervous system; penetration; postmortem analysis.
© The Author(s) 2024. Published by Oxford University Press on behalf of Infectious Diseases Society of America. All rights reserved. For commercial re-use, please contact reprints@oup.com for reprints and translation rights for reprints. All other permissions can be obtained through our RightsLink service via the Permissions link on the article page on our site—for further information please contact journals.permissions@oup.com.
Conflict of interest statement
Potential conflicts of interest. All authors: No reported conflicts. All authors have submitted the ICMJE Form for Disclosure of Potential Conflicts of Interest. Conflicts that the editors consider relevant to the content of the manuscript have been disclosed.
Figures


References
-
- Tong CYW, Costelloe S, Hubb J, et al. Deep sequencing of HIV-1 in cerebrospinal fluid. Clin Infect Dis 2015; 61:1022–5. - PubMed
MeSH terms
Substances
Grants and funding
LinkOut - more resources
Full Text Sources
Medical

