. 2024 Aug 16;385(6710):eado3867.
doi: 10.1126/science.ado3867. Epub 2024 Aug 16.

Structure and repair of replication-coupled DNA breaks

Affiliations

Structure and repair of replication-coupled DNA breaks

Raphael Pavani et al. Science. .

Abstract

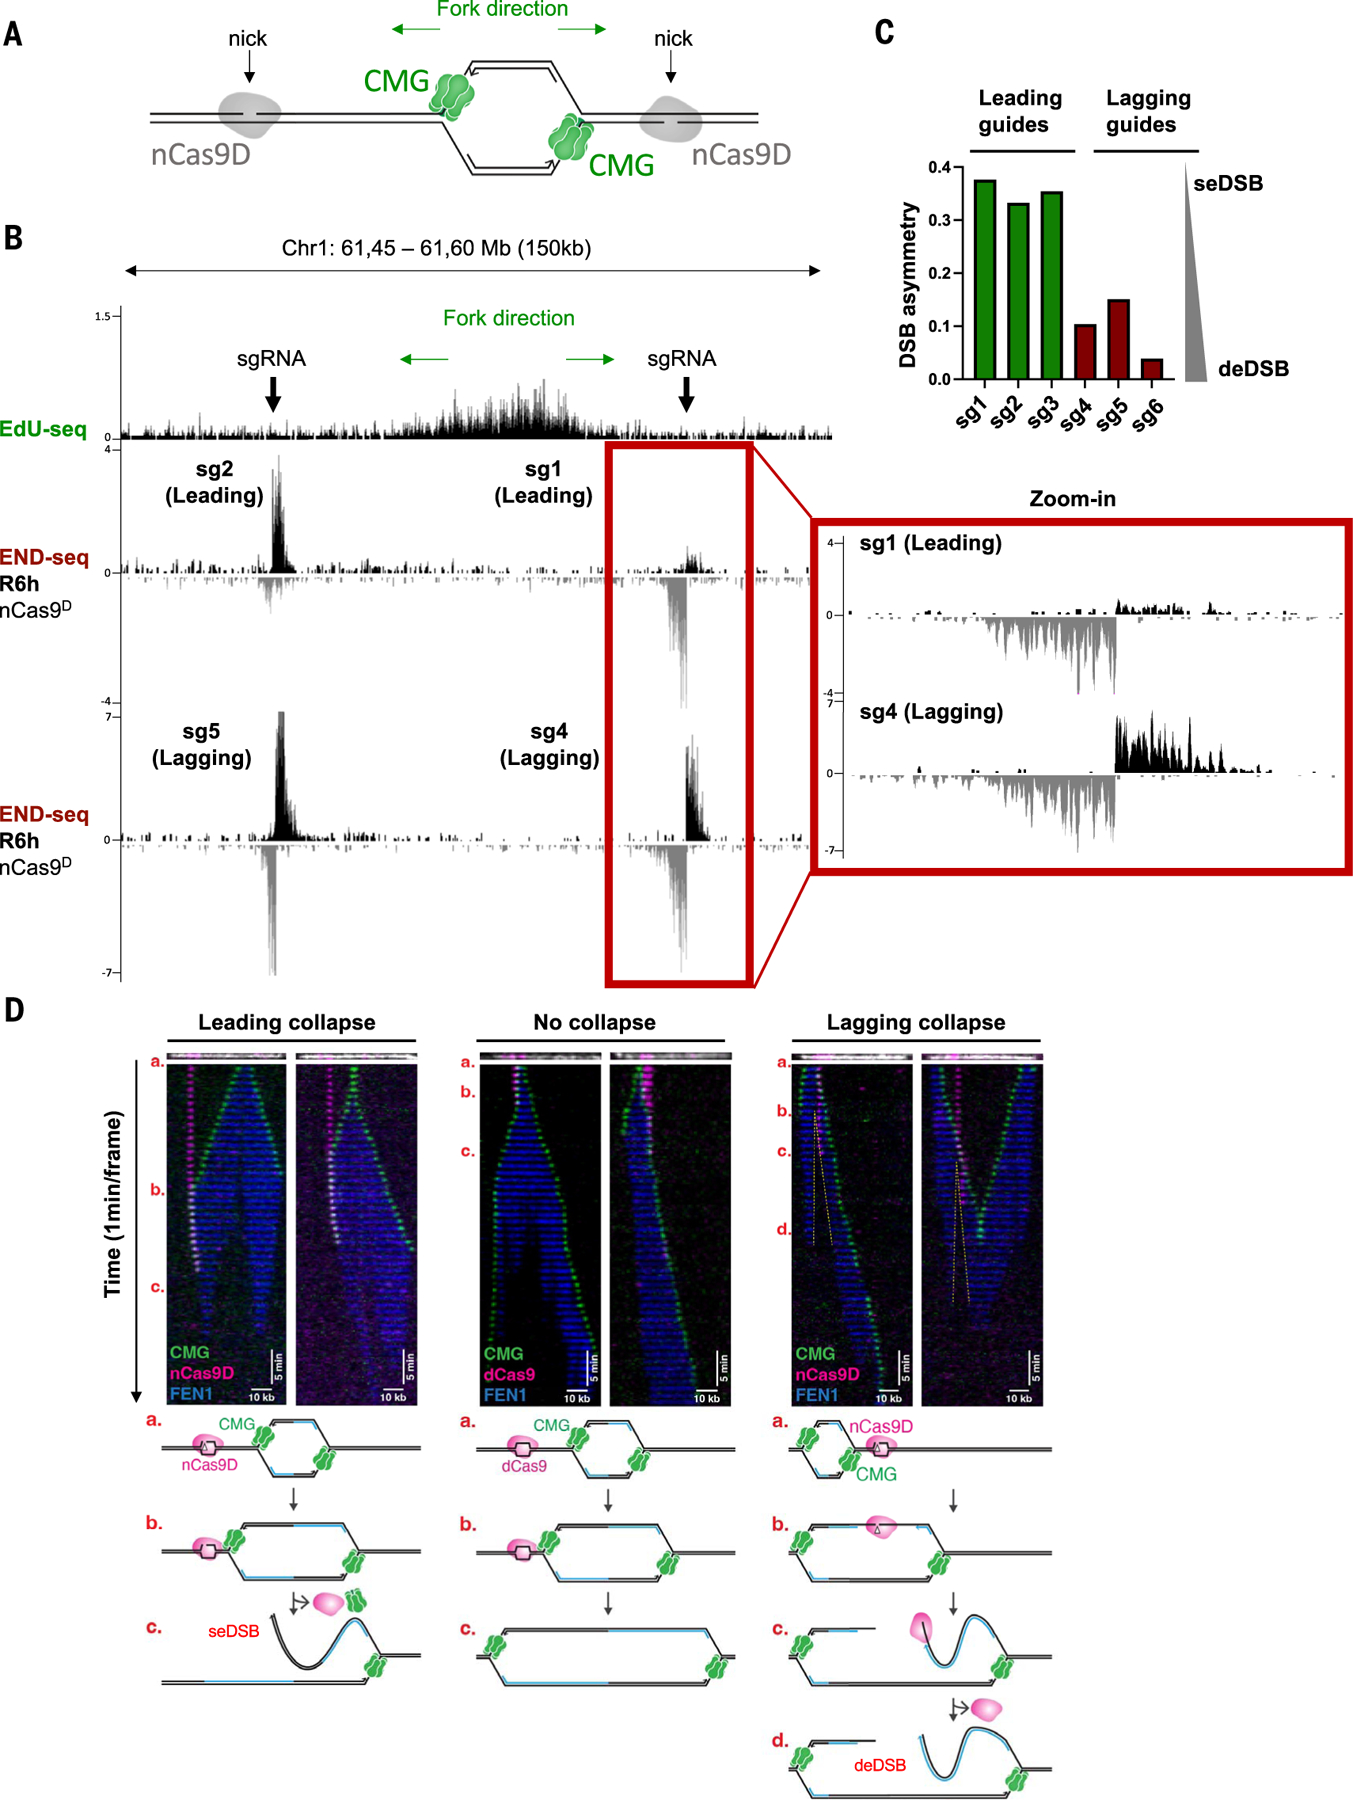
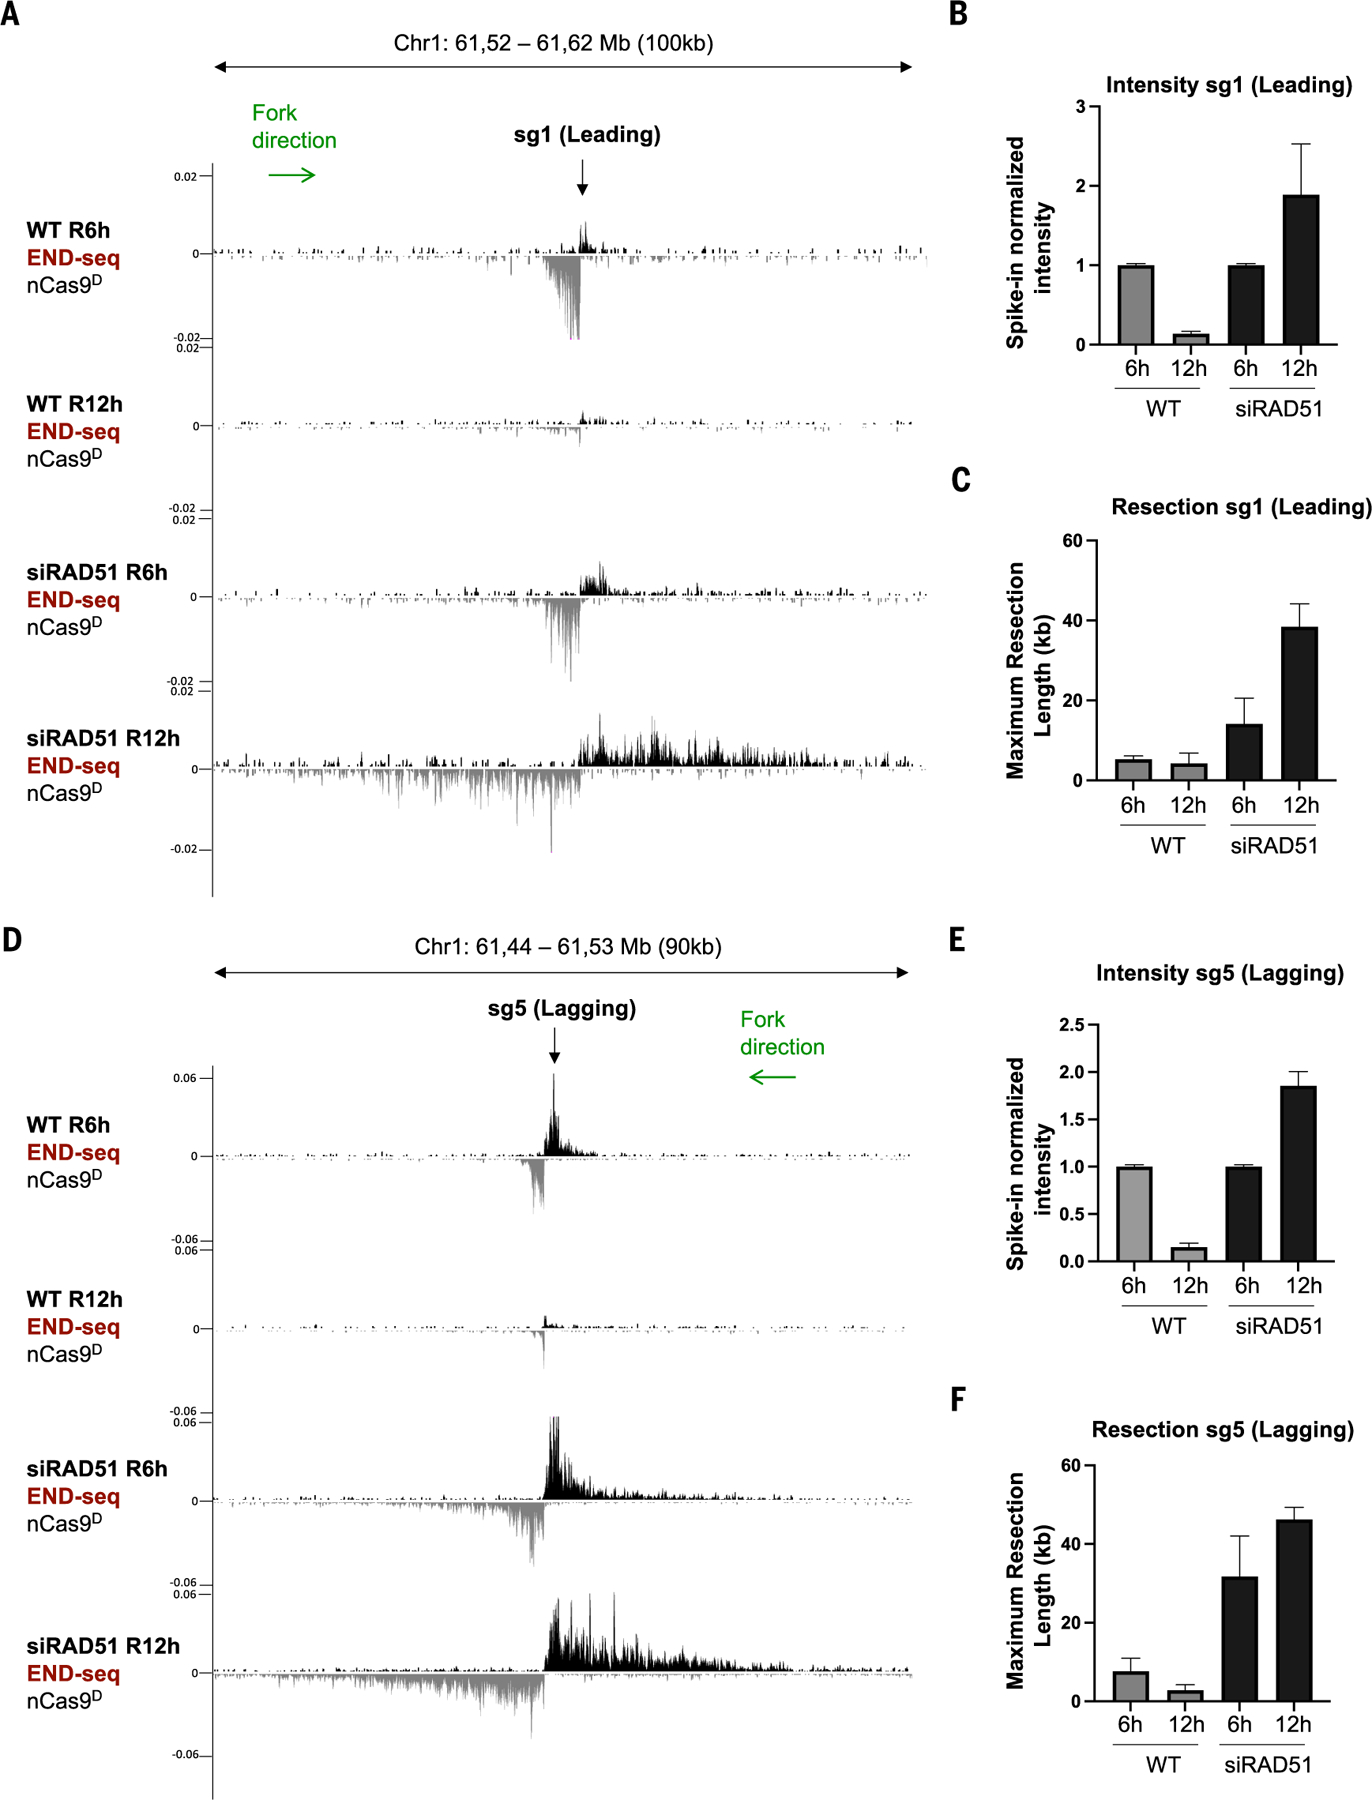
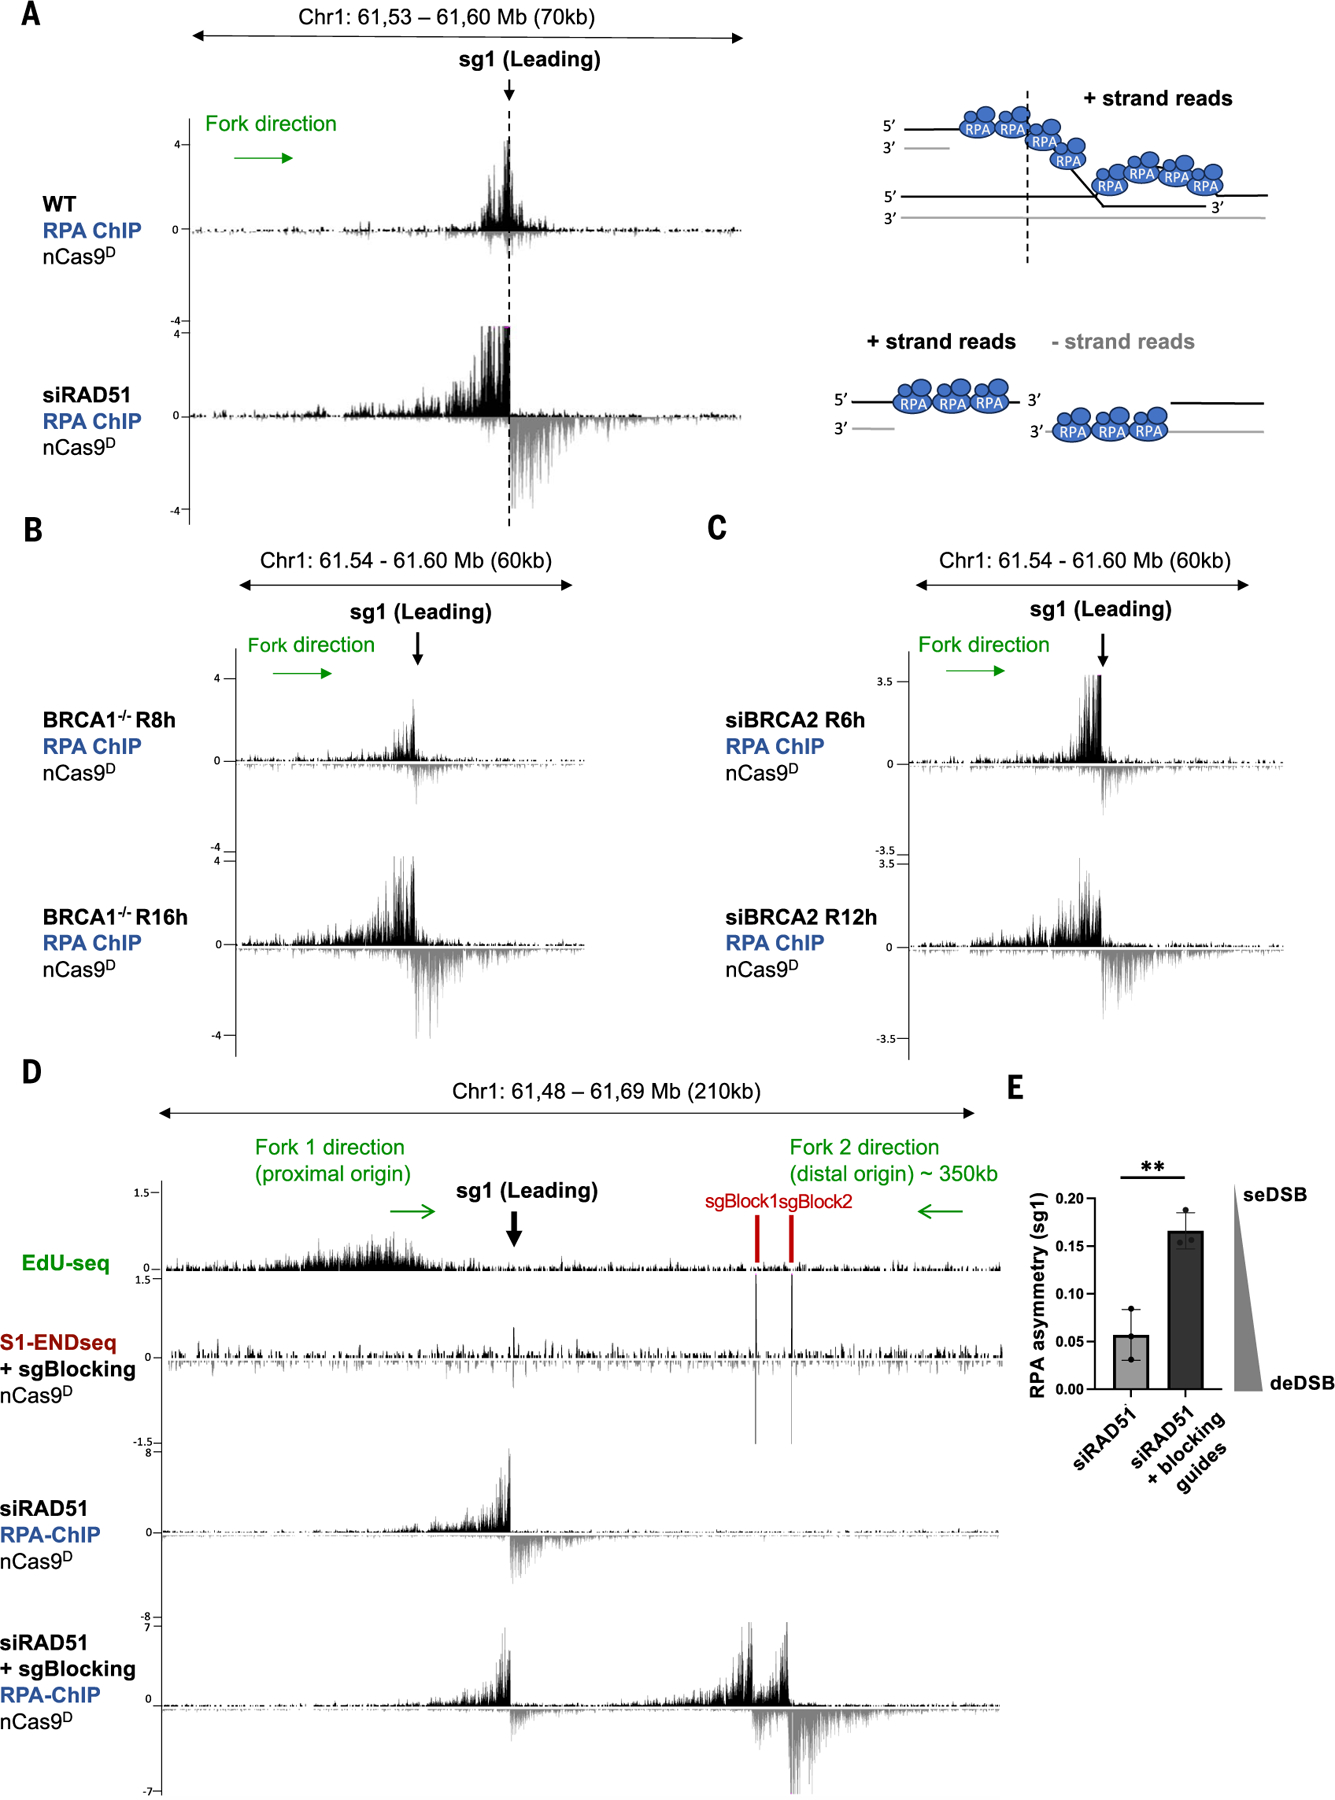
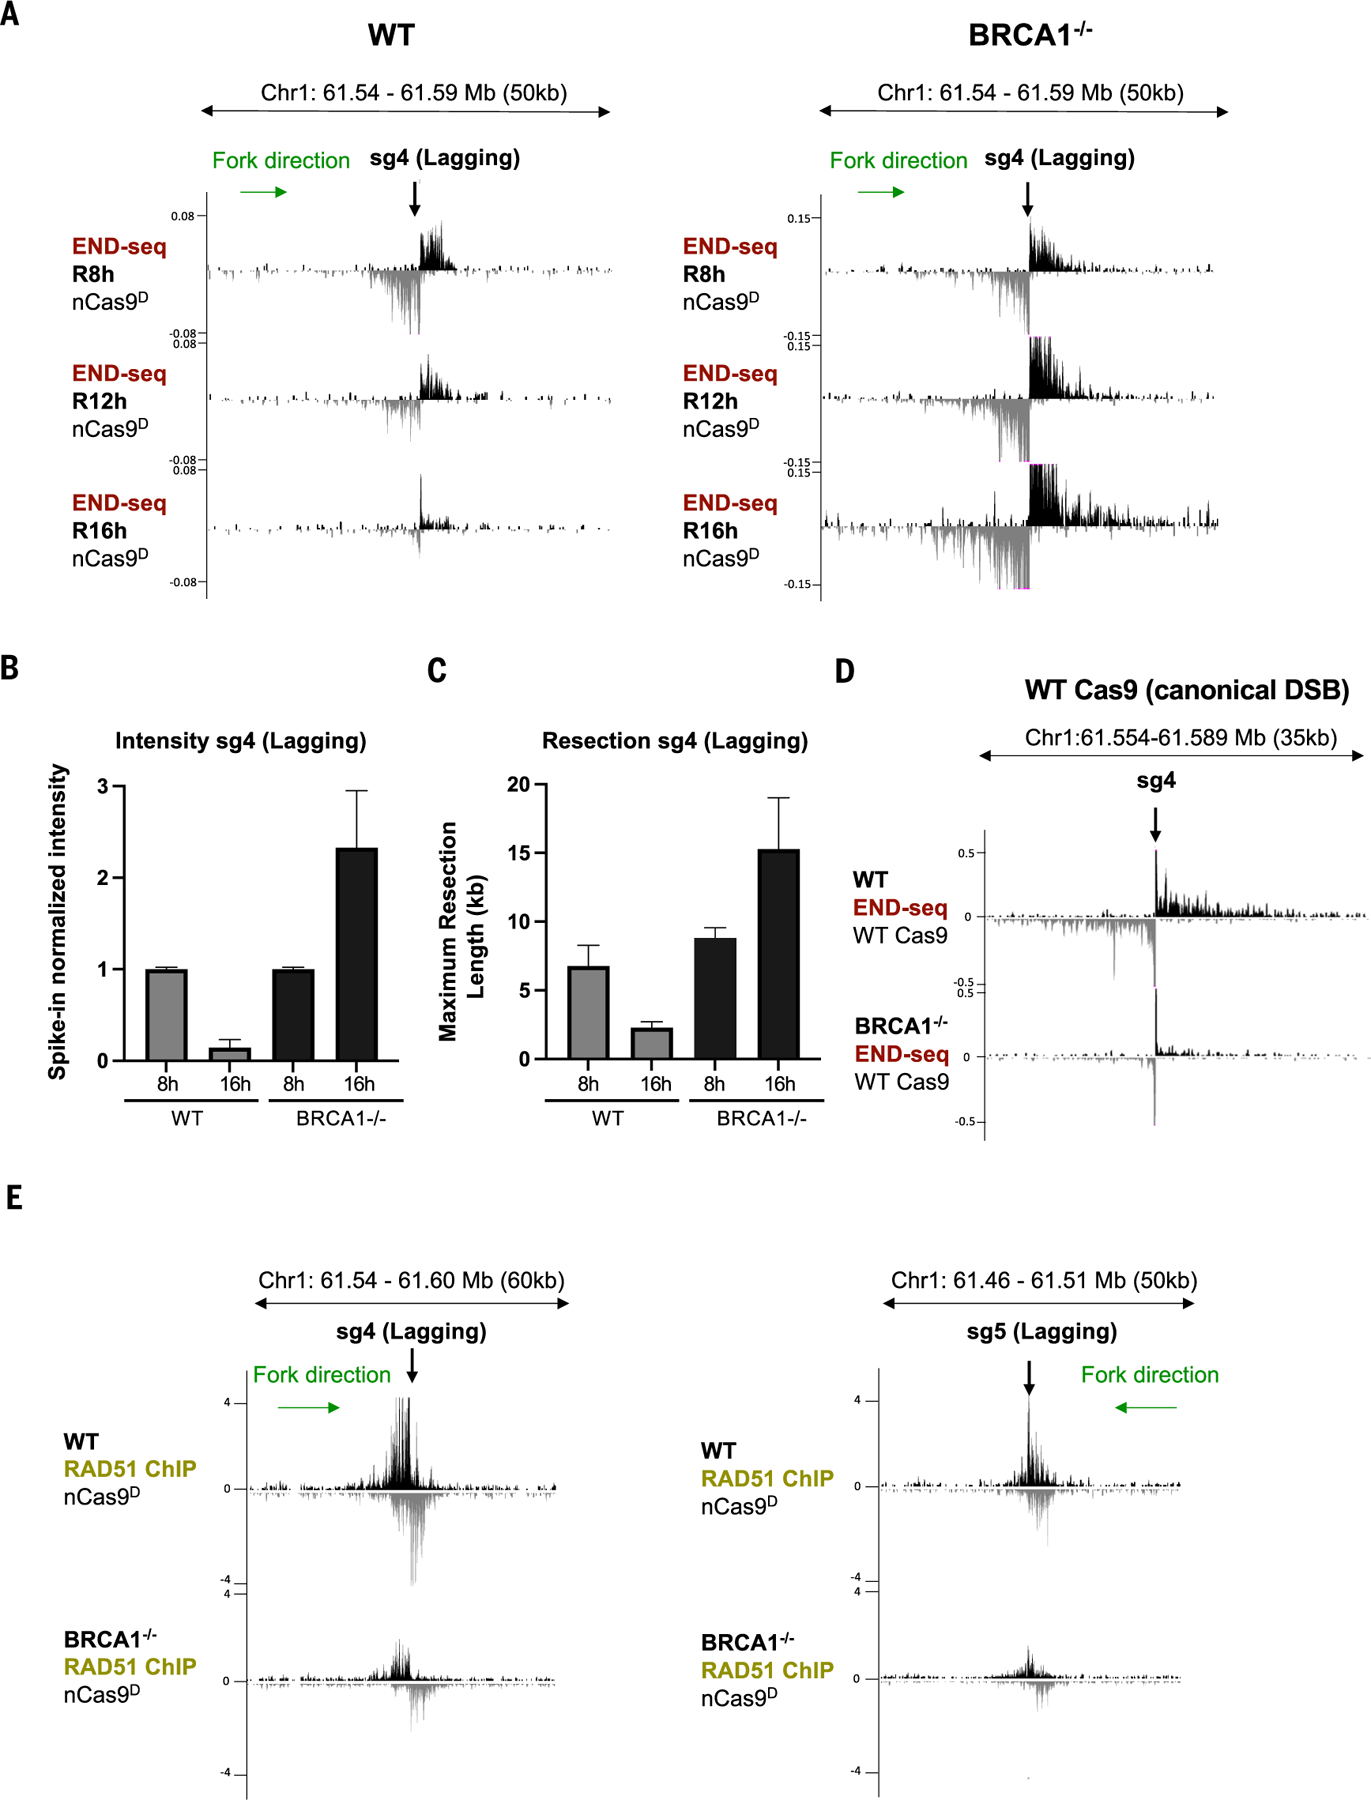
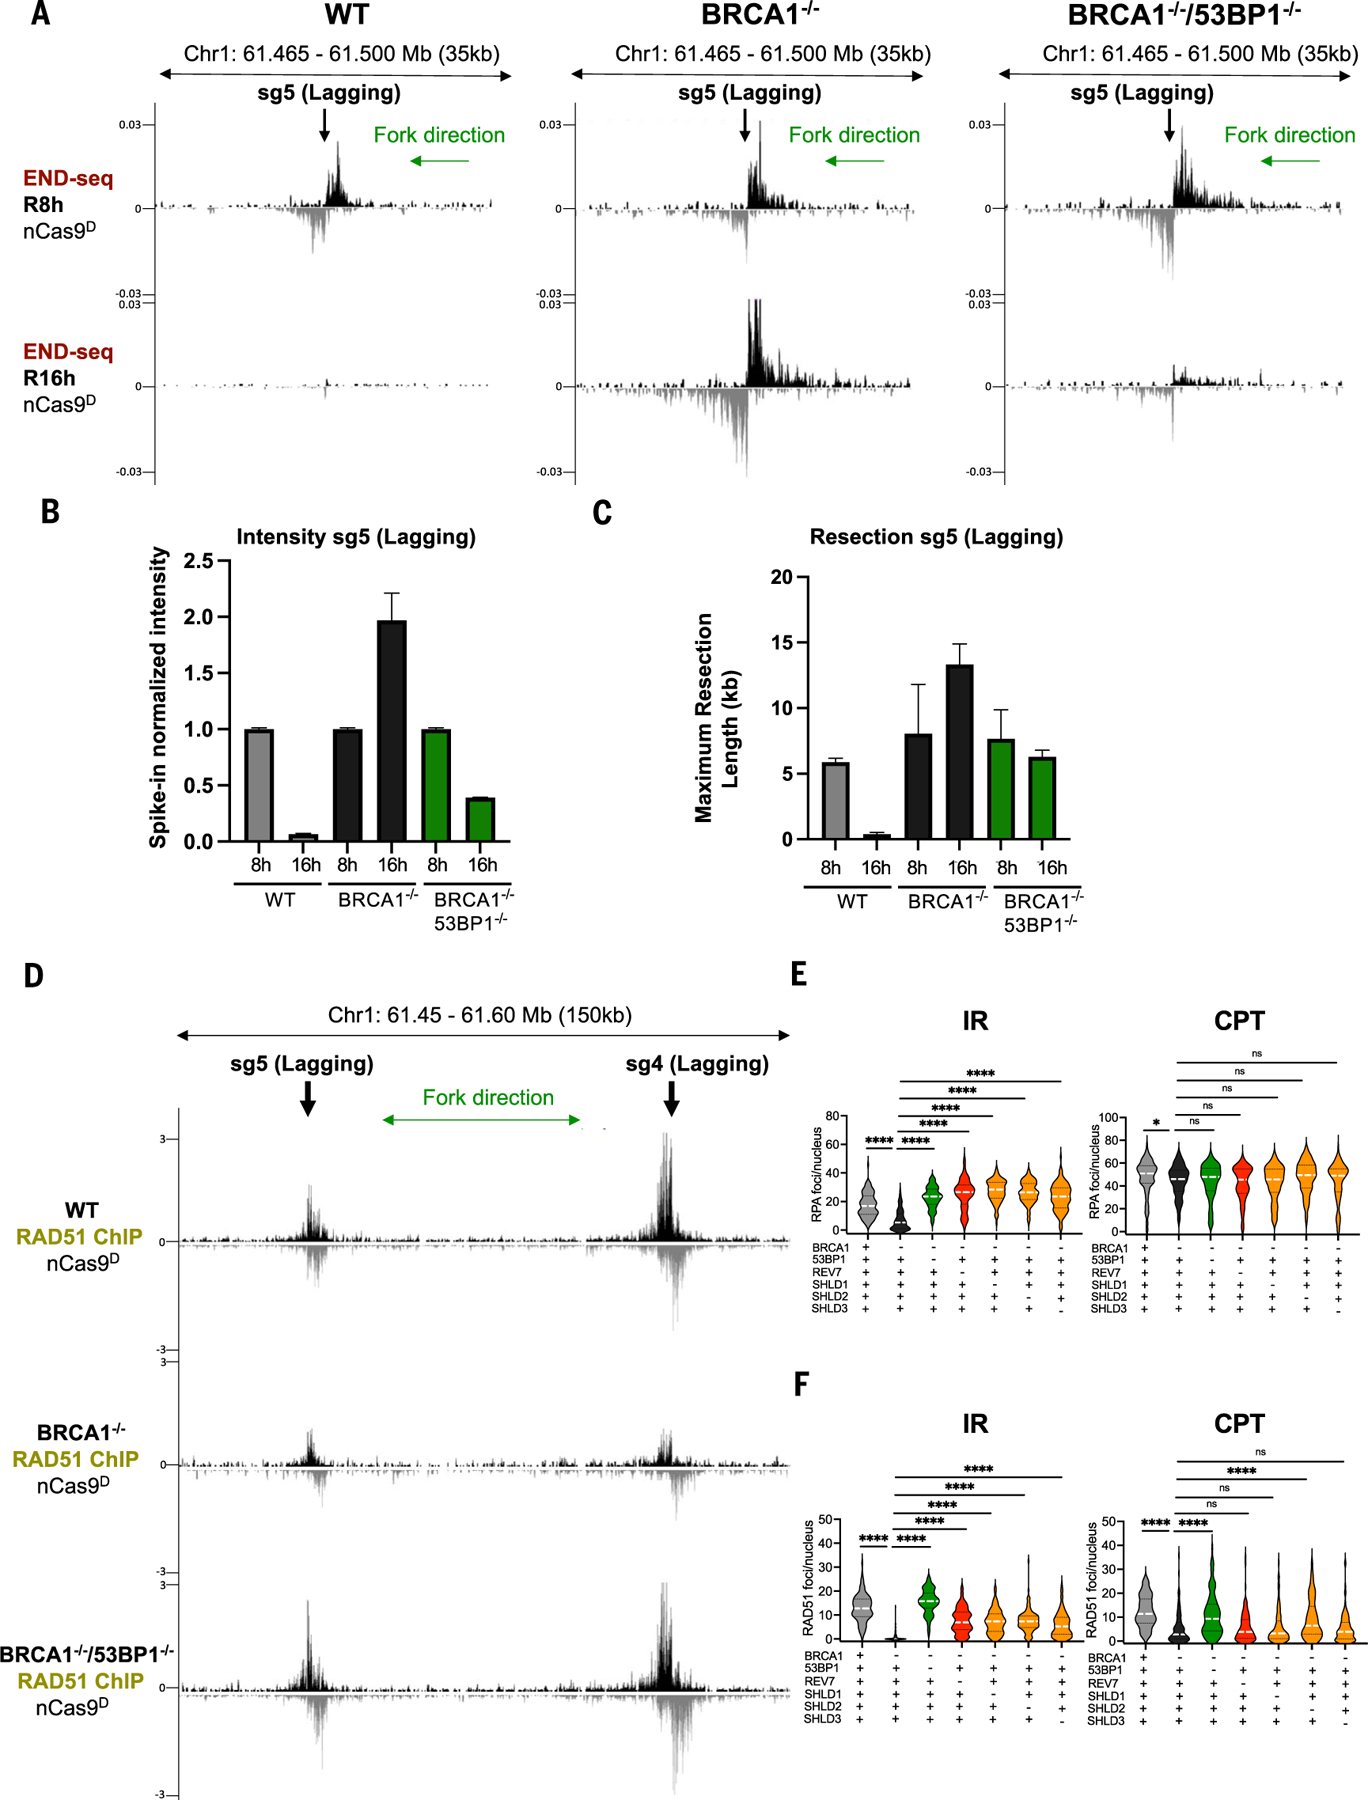
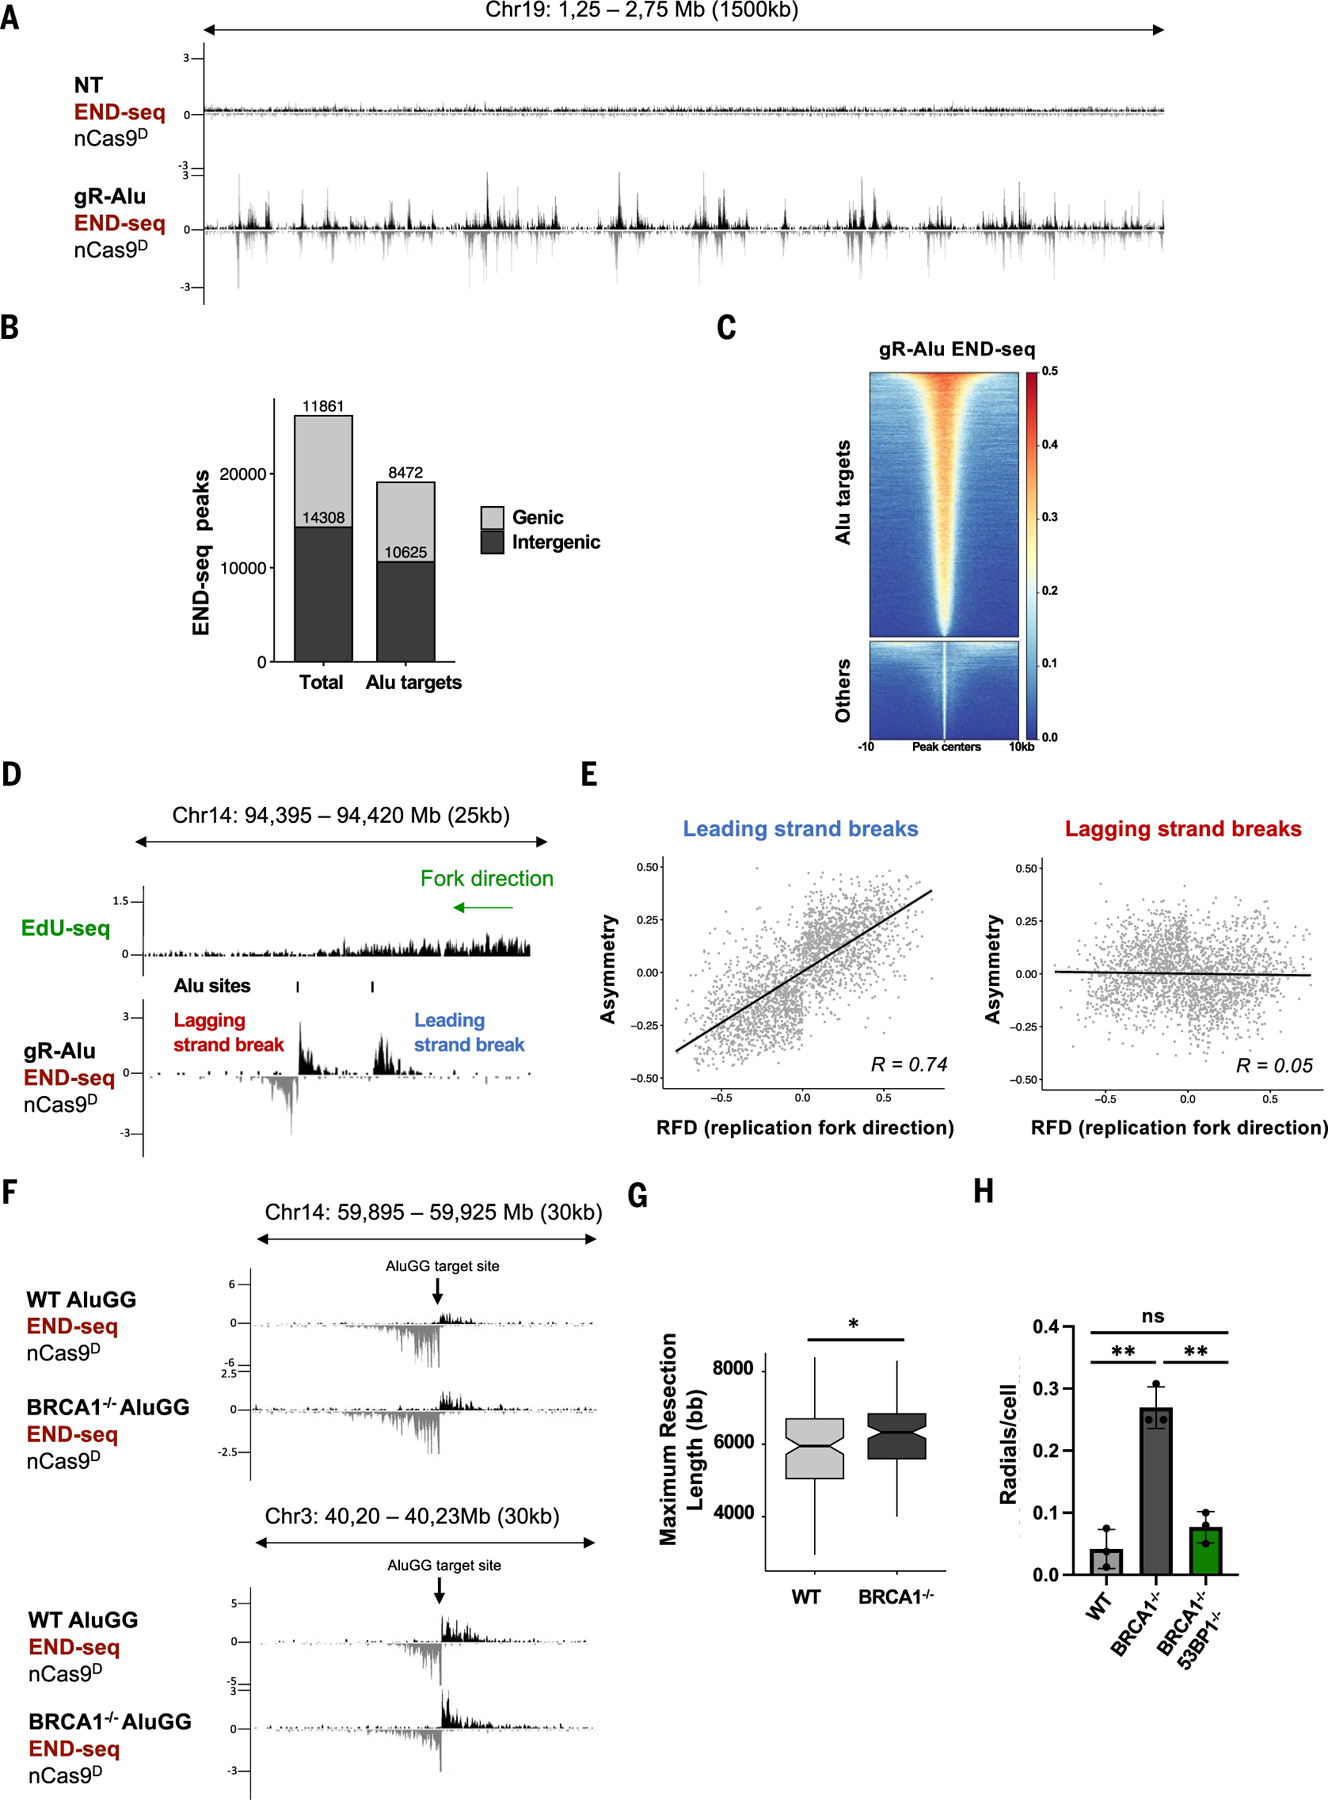
Using CRISPR-Cas9 nicking enzymes, we examined the interaction between the replication machinery and single-strand breaks, one of the most common forms of endogenous DNA damage. We show that replication fork collapse at leading-strand nicks generates resected single-ended double-strand breaks (seDSBs) that are repaired by homologous recombination (HR). If these seDSBs are not promptly repaired, arrival of adjacent forks creates double-ended DSBs (deDSBs), which could drive genomic scarring in HR-deficient cancers. deDSBs can also be generated directly when the replication fork bypasses lagging-strand nicks. Unlike deDSBs produced independently of replication, end resection at nick-induced seDSBs and deDSBs is BRCA1-independent. Nevertheless, BRCA1 antagonizes 53BP1 suppression of RAD51 filament formation. These results highlight distinctive mechanisms that maintain replication fork stability.


Conflict of interest statement

Competing interests: J.C.W. is a cofounder of MOMA Therapeutics, in which he has a financial interest.

Figures

Fig. 1.
Fig. 1.. Distinct DNA end structures are generated by fork collision with leading-strand versus lagging-strand nicks.
(A) Schematic showing origin firing, Cas9 nickase D10A (nCas9D), and the CMG helicase. (B) Genome browser screenshots displaying EdU-seq and END-seq profiles as normalized read density [reads per million (RPM)] in MCF10A cells. Top panels depict the position of individual nicking sgRNAs with respect to the targeted replication initiation zones, as mapped by EdU-seq in MCF10A cells released from G1 arrest in the presence of 4 μM APH. We chose relatively isolated origins with strong fork unidirectionality: Forks converging from the left and right side of the targeted replication origin shown in (B) are predicted to be ~1200 and ~350 kb away, respectively. Lower panels show END-seq signals generated by Cas9 D10A nickase (nCasD) at leading-strand (middle) or lagging-strand (bottom) fork collapse in MCF10A cells 6 hours after release from G1 arrest (R6h). Doxycycline was added during G1 arrest to induce nCasD expression. Positive- and negative-strand END-seq reads are displayed in black and gray, respectively. Green arrows show replication fork direction. (C) Asymmetry at leading-strand versus lagging-strand nick-induced DSBs. The degree of DSB asymmetry was calculated as described in the Materials and methods. Values closer to 0 denote more symmetrical breaks (deDSB). (D) Single-molecule imaging of replication fork collapse. Tethered DNA was nicked in the leading or lagging strand with nCas9D-Atto550 or incubated with dCas9Atto550 and replicated in Xenopus extracts containing Fen1mKikGR and GINSAF647. CMG is shown in green, Fen1mKikGR in blue, and nCas9D or dCas9 in magenta. Kymographs were created by stacking the frames of a movie (1-min intervals) and show representative molecules from two independent biological replicates. For leading-strand collapse (left panel), a total of 89 molecules were quantified, and CMG was lost at the break site in 70% of the events (63/89). For lagging-strand collapse (right panel), a total of 58 molecules were quantified, and CMG bypasses nCas9 in 86% of the events (50/58). For “no collapse” (dCas9) (middle panel), CMG helicase bypasses dCas9 in 97% of the molecules (57/59), which dissociates from DNA soon after CMG collision. Top panels above each kymograph show tethered DNA (white) and nCas9 (magenta) imaged before egg extract addition. Schematic representation of different replication fork–nCas9 collision outcomes are shown at the bottom.
Fig. 2.
Fig. 2.. Resolution of collapsed forks is dependent on RAD51.
(A) Genome browser screenshots displaying END-seq signals at a leading-strand fork collapse generated by nCas9D/sg1 in MCF10A cells treated with siRAD51 or untreated. Cells were collected 6 hours (R6h) or 12 hours (R12h) after release from G1 arrest. (B) Spike-in normalized END-seq intensity signal at sg1 collapsed forks quantified from three independent replicates. Intensity at the R6h time point was normalized to 1, with signals at R12h calculated relative to R6h. (C) Maximum resection tract lengths at nCas9D/sg1-induced DSB quantified from three independent replicates. (D) Genome browser screenshots displaying END-seq signals at a lagging-strand nick-induced DSB generated by nCas9D/sg5 in MCF10A cells treated with siRAD51 or untreated. Cells were collected 6 hours (R6h) or 12 hours (R12h) after release from G1 arrest. Positive- and negative-strand END-seq reads in (A) and (D) are displayed in black and gray, respectively. Green arrows show replication fork direction. (E) Normalized END-seq intensity at nCas9D/sg5-induced DSB quantified from three independent replicates. (F) Maximum resection tract lengths quantified from three independent replicates. Error bars in (B), (C), (E), and (F) represent standard deviation.
Fig. 3.
Fig. 3.. Generation of deDSBs at leading-strand collapse in the absence of RAD51.
(A) Genome browser screen-shots displaying normalized RPA-bound ssDNA ChIP-seq signals (RPM) at a leading-strand fork collapse generated by nCas9D/sg1 in MCF10A cells treated with siRAD51 or untreated. Dashed line indicates the position of sg1. Schematic representations of RPA binding in WT and RAD51-depleted cells are shown on the right. In WT, RPA is bound to the resected strand (left side of dashed line) of a seDSB and potentially also to the exposed ssDNA in the migrating D-loop (right side of dashed line) after strand invasion. In RAD51-depleted cells, RPA is instead bound to resected ends on both sides of a deDSB. (B) Genome browser screen-shots displaying RPA ChIP-seq signals at a leading-strand fork collapse generated by nCas9D/sg1 in BRCA1−/− RPE-1 cells released for 8 and 16 hours after G1 arrest. (C) Genome browser screenshots displaying RPA ChIP-seq at a leading-strand fork collapse generated by nCas9D/sg1 in BRCA2-depleted MCF10A cells released for 6 and 12 hours after G1 arrest. (D) Genome browser screen-shots displaying EdU-seq, S1-END-seq, and RPA-bound ssDNA ChIP-seq profiles. Top panel depicts the positions of the nicking and blocking sgRNAs with respect to the targeted replication initiation zone (fork 1 corresponds to the proximal origin) as well as the expected location of the converging fork (fork 2 corresponds to distal origin). Second panel from the top shows S1-END-seq in G1-arrested cells confirming successful expression and activities of nCas9D, sg1, sgBlock1, and sgBlock2. Third panel from the top and bottom panel show RPA-bound ssDNA ChIP-seq signals generated by nCas9D/sg1 in MCF10A in the absence or presence of blocking sgRNAs 6 hours after release from G1. Positive- and negative-strand RPA-bound ssDNA ChIP-seq and S1-END-seq reads in (A) to (D) are displayed in black and gray, respectively. (E) RPA asymmetry calculated as the ratio of positive/negative strand RPA reads from three independent replicates. Data are represented as mean ± standard deviation, and statistical significance is calculated using unpaired t test (**P < 0.005).
Fig. 4.
Fig. 4.. Resection at collapsed forks is BRCA1 independent.
(A) Genome browser screenshots displaying END-seq signals at a lagging-strand nick-induced DSB generated by nCas9D/sg4 in WT and BRCA1−/− RPE-1 cells. Cells were collected 8 hours (R8h), 12 hours (R12h), and 16 hours (R16h) after release from G1 arrest. (B) Spike-in normalized END-seq intensity signal at nCas9D/sg4-induced DSB quantified from three independent replicates. Intensity at the R8h time point was normalized to 1, with the signal at R16h calculated relative to R8h. (C) Maximum resection tract lengths at nCas9D/sg4-induced DSB quantified from three independent replicates. (D) Genome browser screenshots displaying END-seq signals at a canonical DSB generated by Cas9/sg4 in WT and BRCA1−/− RPE-1 cells. (E) Genome browser screenshots displaying normalized RAD51 ChIP-seq signals at a lagging-strand nick-induced DSB generated by nCas9D/sg4 (left) and nCas9D/sg5 (right) in WT and BRCA1−/− RPE-1 cells released for 8 hours after G1 arrest (n = 3 independent replicates). Positive- and negative-strand END-seq reads in (A) and (D) and RAD51 ChIP-seq reads in (E) are displayed in black and gray, respectively. Green arrows show replication fork direction. Error bars in (B) and (C) represent standard deviation.
Fig. 5.
Fig. 5.. 53BP1 inhibits RAD51 loading at collapsed forks.
(A) Genome browser screenshots displaying END-seq signals at a lagging strand nick-induced DSB generated by nCas9D/sg5 in WT, BRCA1−/−, and BRCA1−/−53BP1−/− RPE-1 cells. Cells were collected 8 hours (R8h) and 16 hours (R16h) after release from G1 arrest. (B) Spike-in normalized END-seq signal intensity at nCas9D/sg5-induced DSB quantified from two independent replicates. Intensity at the R8h time point was normalized to 1, with the signal at R16h calculated relative to R8h. (C) Maximum resection tract lengths quantified from two independent replicates. (D) Genome browser screenshots displaying normalized RAD51 ChIP-seq signals at lagging strand nick-induced DSB generated by nCas9D/sg4 and nCas9D/sg5 in WT, BRCA1−/−, and BRCA1−/−53BP1−/− RPE-1 cells (n = 3 independent replicates). Positive- and negative-strand END-seq and RAD51 ChIP-seq reads in (A) and (D) are displayed in black and gray, respectively. Green arrows show replication fork direction. (E) RPA foci in EdU positive nuclei measured 3 hours after 5 Gy IR or 1 hour after 1 μM CPT treatment in WT, BRCA1−/−, BRCA1−/−53BP1−/−, BRCA1−/− SHLD1−/−, BRCA1−/−SHLD2−/−, BRCA1−/−SHLD3−/−, and BRCA1−/−REV7−/− RPE-1 cells. (F) RAD51 foci in EdU positive nuclei measured 3 hours after 5 Gy IR or 1 hour after 1 μM CTP treatment in WT, BRCA1−/−, BRCA1−/−53BP1−/−, BRCA1−/−SHLD1−/−, BRCA1−/− SHLD2−/−, BRCA1−/−SHLD3−/−, and BRCA1−/−REV7−/− RPE-1 cells (Mann-Whitney test, *P < 0.01, ****P < 0.0001; white dashed line represents the median, and black dashed lines represent the quartiles; ns, not significant).
Fig. 6.
Fig. 6.. Generation of collapsed forks at diverse genomic loci.
(A) Genome browser screenshots displaying END-seq signals in MCF10A cells that were either nontreated (NT) or expressing nCas9D/gR-Alu. (B) Genomic distribution of total and Alu-specific END-seq peaks in MCF10A cells expressing nCas9D/gR-Alu. (C) Heatmap of END-seq signals at Alu-specific and off-target (“Others”) sites. (D) Genome browser screenshot displaying EdU-seq and END-seq profiles. Both lagging- and leading-strand nick-induced DSBs are generated near a unidirectional fork. (E) Scatterplots showing the correlation between END-seq peak asymmetry and RFD of leading and lagging strand nCas9D/gR-Alu-induced breaks (Spearman correlation; correlation coefficient, r, of 0.74, for leading-strand breaks, and 0.05, for lagging-strand breaks). (F) Genome browser screenshot displaying END-seq signals at nick-induced DSBs generated by nCas9D/AluGG in WT and BRCA1−/− RPE-1 cells. (G) Box plot showing maximum resection lengths in WT and BRCA1−/− cells at AluGG-induced DSBs (Wilcoxon test, *P = 0.033). (H) Radial chromosomes in metaphase spreads from WT, BRCA1−/−, and BRCA1−/−53BP1−/− cells expressing nCas9D/AluGG (n =3 independent replicates, >40 metaphases analyzed per replicate, **P < 0.005 unpaired t test). Radials in Dox-induced cells were determined by subtracting the radials present before nCas9D/AluGG induction.

References

    1. Mirkin EV, Mirkin SM, Replication fork stalling at natural impediments. Microbiol. Mol. Biol. Rev 71, 13–35 (2007). doi: 10.1128/MMBR.00030-06; - DOI - PMC - PubMed
    1. Cortez D, Replication-Coupled DNA Repair. Mol. Cell 74, 866–876 (2019). doi: 10.1016/j.molcel.2019.04.027; - DOI - PMC - PubMed
    1. Chen CC, Feng W, Lim PX, Kass EM, Jasin M, Homology-Directed Repair and the Role of BRCA1, BRCA2, and Related Proteins in Genome Integrity and Cancer. Annu. Rev. Cancer Biol 2, 313–336 (2018). doi: 10.1146/annurev-cancerbio-030617-050502; - DOI - PMC - PubMed
    1. Liu W et al., RAD51 bypasses the CMG helicase to promote replication fork reversal. Science 380, 382–387 (2023). doi: 10.1126/science.add7328; - DOI - PMC - PubMed
    1. Mayle R et al., Mus81 and converging forks limit the mutagenicity of replication fork breakage. Science 349, 742–747 (2015). doi: 10.1126/science.aaa8391; - DOI - PMC - PubMed

Publication types