. 2024 Jun;21(215):20230756.
doi: 10.1098/rsif.2023.0756. Epub 2024 Jun 20.

A mechanistic modelling approach of the host-microbiota interactions to investigate beneficial symbiotic resilience in the human gut

Affiliations

A mechanistic modelling approach of the host-microbiota interactions to investigate beneficial symbiotic resilience in the human gut

Marie Haghebaert et al. J R Soc Interface. 2024 Jun.

Abstract

The health and well-being of a host are deeply influenced by the interactions with its gut microbiota. Contrasted environmental conditions, such as diseases or dietary habits, play a pivotal role in modulating these interactions, impacting microbiota composition and functionality. Such conditions can also lead to transitions from beneficial to detrimental symbiosis, viewed as alternative stable states of the host-microbiota dialogue. This article introduces a novel mathematical model exploring host-microbiota interactions, integrating dynamics of the colonic epithelial crypt, microbial metabolic functions, inflammation sensitivity and colon flows in a transverse section. The model considers metabolic shifts in epithelial cells based on butyrate and hydrogen sulfide concentrations, innate immune pattern recognition receptor activation, microbial oxygen tolerance and the impact of antimicrobial peptides on the microbiota. Using the model, we demonstrated that a high-protein, low-fibre diet exacerbates detrimental interactions and compromises beneficial symbiotic resilience, underscoring a destabilizing effect towards an unhealthy state. Moreover, the proposed model provides essential insights into oxygen levels, fibre and protein breakdown, and basic mechanisms of innate immunity in the colon and offers a crucial understanding of factors influencing the colon environment.

Keywords: PDE–ODE coupling; colon flows model; colonic crypt model; host–microbiota interactions modelling; human gut microbiota.


Conflict of interest statement

The authors declare no conflict of interest.

Figures
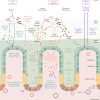
Biological representation of the main symbiotic mechanisms present in our model
Figure 1.
Biological representation of the main symbiotic mechanisms present in our model. This figure delineates the key interactions between the host and its gut microbiota as represented in the model. The major components of the model are enclosed in coloured boxes, with text and arrows in corresponding colours to describe the mechanistic aspects. Bacterial metabolism is highlighted in red. It accounts for dietary fibres and protein as well as host-derived mucus glycoprotein degradation, microbial metabolites production (lactate, SFCAs: acetate, propionate, butyrate) and gases: hydrogen, carbon dioxide, hydrogen sulfide, methane and oxygen. Volume flows, representing transit, mucus secretion and epithelial absorption, are indicated in purple. Innate immunity mechanisms are in blue, they include AMP secretion and control of microbes as well as pattern recognition receptor (PRR) activation. Epithelial cell populations include stem cells, deep secretovolume flows in itry cells (DCS), progenitor cells and differentiated cells (goblet and enterocytes). The metabolism of differentiated cells, focused on the β-oxidation of SCFA, is in orange, and crypt dynamics, comprising mechanical interactions and cell fate events, in green. Note that the graphical elements are not to scale. Created with BioRender.com.
Schematic representation of flows in the model
Figure 2.
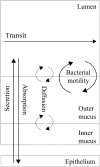
Schematic representation of flows in the model. We represent transit, absorption, secretion, diffusion and bacterial motility flows within the model compartments. The epithelium is depicted by the crypt model. Secretion refers to mucus, AMP and oxygen production; absorption refers to liquid, dissolved metabolites and H2S . Diffusion is linked to gases and monosaccharides, bacterial motility is a shortcut for adherence, residence and shear effects and finally, transit flow influences all state variables in the lumen compartment.
Metabolic and regulatory processes representation
Figure 3.
Metabolic and regulatory processes representation. This diagram elucidates the intricate relationships between various microbial groups that participate in the degradation of polysaccharides and protein breakdown as depicted in our model. (a) Each metabolic process is designated by a unique number and colour. Arrows originate from the reaction substrates and culminate at the end-products, linking them to the corresponding microbial groups. The term +O2 denotes oxygen consumption and signifies an oxidation reaction. Related end-products are grouped within light-blue boxes. We also represent the transfer from liquid to gaseous phase of methane ( CH4 ), carbon dioxide ( CO2 ), hydrogen ( H2 ) and hydrogen sulfide ( H2S ). Regulatory processes included in the model encompass H2S toxicity on mucus bounds. (b) The model accounts for basal and AMPs and oxygen concentration-dependent death rates. Here, oxygen is a proxy for inflammation, with three sensitivity levels for the microbes: high ( ϕ ), moderate ( μ ) and low ( δ ). The proposed partition into eight microbial groups is provided in panel (c).
Diagram illustrating the geometrical representation of the compartmental model of the colon section
Figure 4.
Diagram illustrating the geometrical representation of the compartmental model of the colon section. The model consists of three compartments: lumen, outer mucus and inner mucus, their respective volumes are denoted by VxxX . The interface between the lumen and outer mucus compartments is denoted by ΓL , the interface between the outer mucus and inner mucus compartments is denoted by ΓO , and the interface between the inner mucus and the epithelium is denoted by ΓI . The total length of the section is Lsec , and the radius is R , while the total mucus thickness is em . The input and output surfaces of the system are represented by Γin and Γout .
Bacterial group proportions in the lumen and the outer mucus layer
Figure 5.
Bacterial group proportions in the lumen and the outer mucus layer. We used plot pie to represent microbiota composition in the lumen and the outer mucus compartment of the model. Results were obtained at a steady state for the last of the five sections analysed.
Longitudinal and transverse gradients in colon physiology
Figure 6.
Longitudinal and transverse gradients in colon physiology. (a) Evolution of total bacterial fraction volume, total SCFAs concentration and transit flows in the lumen compartment along five sections. Depicted values are divided by their maximum, for SCFAs: 94.5mM , for transit vin : 0.416 cm h−1 and for bacterial fraction volume fB : 6.1 × 10⁻³[.]. (b) Concentration gradient from lumen to the inner mucus layer for oxygen, H2S , AMPs and SCFAs. Values are divided by their max, for SCFAs: 92.7mM , for H2S : 0.2 mM, for AMPs: 0.47mM and for oxygen 6.7 arb. units.
Cell densities along the crypt
Figure 7.
Cell densities along the crypt. Cell densities are plotted as a function of the height in the crypt. The total number of cells is reported in the box for each cell type (sc, stem cells; dcs, deep crypt secretory cells; pc, progenitor cells; ent, enterocytes; gc, goblet cells).
Normalized solute concentration along the crypt
Figure 8.
Normalized solute concentration along the crypt. Concentration is divided by their maximum values, for oxygen: 48.8 arb. units, lactate (la) : 0.48 mM, acetate (ac) : 34.05 mM, propionate (pro) : 14.30 mM and butyrate (but) : 14.72 mM.
xygen concentration in lumen () influenced by diet
Figure 9.
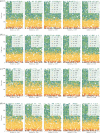
Oxygen concentration in lumen ( cO2L ) influenced by diet. This impact is displayed when varying fibre and protein intake on a grid [0.02,0.06]×[0.01,0.03] as a function of fibre and protein supply.
Ratio of volume to total bacterial volume in the lumen influenced by diet
Figure 10.
Ratio of BH2sδ volume to total bacterial volume in the lumen influenced by diet. This impact is displayed when varying fibre and protein intake on a grid [0.02,0.06]×[0.01,0.03] . (a) Function of fibre and protein supply. (b) Function of the total nutrient supply and the ratio of protein over fibre.
PRRs activation influenced by diet
Figure 11.
PRRs activation ( R¯(fBO) ) influenced by diet. Visualization of the effect of varying fibre and protein supply on PPR activation. This impact is displayed when varying fibre and protein intake on a grid [0.02,0.06]×[0.01,0.03] . (a) Function of fibre and protein supply. (b) Function of the total nutrient supply and the ratio of protein over fibre.
Total number of differentiated cells in one crypt influenced by diet
Figure 12.
Total number of differentiated cells in one crypt ( ρgc+ρpc ) influenced by diet. This number is displayed when varying fibre and protein intake on a grid [0.02,0.06]×[0.01,0.03] as a function of fibre and protein supply.
Spatial distribution of cells in crypts under varying diet and breach scenario C
Figure 13.
Spatial distribution of cells in crypts under varying diet and breach scenario C. The distribution is visualized in colon sections under different conditions: (a) reference diet, (b) reference diet with an epithelial breach, (c) HP/LF diet, and (d) HP/LF diet with an epithelial breach. In each depiction, cells are represented by circles, with their colours indicating distinct cell types. The distribution patterns are based on cell densities derived from the model.
Scenario A: effects of increased AMP secretion
Figure 14.
Scenario A: effects of increased AMP secretion. This figure showcases the effects of a surge in AMP secretion, simulating a reduction in mucus quality, under two different dietary regimes (reference and HP/LF diets).
Scenario B: combined effects of an oxygen bloom and increased AMP secretion
Figure 15.
Scenario B: combined effects of an oxygen bloom and increased AMP secretion. This figure demonstrates the combined impact of an oxygen bloom at the crypt base and an increased AMP secretion, under two different dietary regimes (reference and HP/LF diets).

Similar articles

Cited by

References

    1. Sender R, Fuchs S, Milo R. 2016. Revised estimates for the number of human and bacteria cells in the body. PLoS Biol. 14 , e1002533. (10.1371/journal.pbio.1002533) - DOI - PMC - PubMed
    1. Belkaid Y, Harrison OJ. 2017. Homeostatic Immunity and the Microbiota. Immunity 46 , 562–576. (10.1016/j.immuni.2017.04.008) - DOI - PMC - PubMed
    1. Liwinski T, Zheng D, Elinav E. 2020. The microbiome and cytosolic innate immune receptors. Immunol. Rev. 297 , 207–224. (10.1111/imr.12901) - DOI - PubMed
    1. Schroeder BO. 2019. Fight them or feed them: how the intestinal mucus layer manages the gut microbiota. Gastroenterol. Rep. 7 , 3–12. (10.1093/gastro/goy052) - DOI - PMC - PubMed
    1. Thaiss CA, Zmora N, Levy M, Elinav E. 2016. The microbiome and innate immunity. Nature 535 , 65–74. (10.1038/nature18847) - DOI - PubMed

LinkOut - more resources