. 2024 Sep:75:103241.
doi: 10.1016/j.redox.2024.103241. Epub 2024 Jun 17.

Extracellular vesicles from II trimester human amniotic fluid as paracrine conveyors counteracting oxidative stress

Affiliations

Extracellular vesicles from II trimester human amniotic fluid as paracrine conveyors counteracting oxidative stress

Giorgia Senesi et al. Redox Biol. 2024 Sep.

Abstract

Background: We previously demonstrated that the human amniotic fluid (hAF) from II trimester of gestation is a feasible source of stromal progenitors (human amniotic fluid stem cells, hAFSC), with significant paracrine potential for regenerative medicine. Extracellular vesicles (EVs) separated and concentrated from hAFSC secretome can deliver pro-survival, proliferative, anti-fibrotic and cardioprotective effects in preclinical models of skeletal and cardiac muscle injury. While hAFSC-EVs isolation can be significantly influenced by in vitro cell culture, here we profiled EVs directly concentrated from hAF as an alternative option and investigated their paracrine potential against oxidative stress.

Methods: II trimester hAF samples were obtained as leftover material from prenatal diagnostic amniocentesis following written informed consent. EVs were separated by size exclusion chromatography and concentrated by ultracentrifugation. hAF-EVs were assessed by nanoparticle tracking analysis, transmission electron microscopy, Western Blot, and flow cytometry; their metabolic activity was evaluated by oximetric and luminometric analyses and their cargo profiled by proteomics and RNA sequencing. hAF-EV paracrine potential was tested in preclinical in vitro models of oxidative stress and dysfunction on murine C2C12 cells and on 3D human cardiac microtissue.

Results: Our protocol resulted in a yield of 6.31 ± 0.98 × 10⁹ EVs particles per hAF milliliter showing round cup-shaped morphology and 209.63 ± 6.10 nm average size, with relevant expression of CD81, CD63 and CD9 tetraspanin markers. hAF-EVs were enriched in CD133/1, CD326, CD24, CD29, and SSEA4 and able to produce ATP by oxygen consumption. While oxidative stress significantly reduced C2C12 survival, hAF-EV priming resulted in significant rescue of cell viability, with notable recovery of ATP synthesis and concomitant reduction of cell damage and lipid peroxidation activity. 3D human cardiac microtissues treated with hAF-EVs and experiencing H2O2 stress and TGFβ stimulation showed improved survival with a remarkable decrease in the onset of fibrosis.

Conclusions: Our results suggest that leftover samples of II trimester human amniotic fluid can represent a feasible source of EVs to counteract oxidative damage on target cells, thus offering a novel candidate therapeutic option to counteract skeletal and cardiac muscle injury.

Keywords: Amniotic fluid; Cell viability; Extracellular vesicles; Metabolic dysfunction; Oxidative stress; Paracrine effect.


Conflict of interest statement

Declaration of competing interest The authors have nothing to disclose nor competing interests to declare.

Figures

Image 1
Graphical abstract
Fig. 1
Fig. 1
Characterization of hAF-EVs. A) Representative graphical output of hAF-EVs size distribution by nanoparticle tracking analysis; B) hAF-EVs morphology and ultrastructure analysis by TEM with representative image of hAF-EVs and evaluation of the particle distribution according to size (n = 3); scale bar: 500 nm; C) Flow cytometry analysis of hAF-EVs for the expression of the CD9, CD63 and CD81 tetraspanin antigens; graph shows the mean ± s.e.m value referring to each antigen expression MFI (n = 4); D) Representative cropped images of Western Blot analyses of hAF-EVs and hAF for the expression of the canonical EV markers Syntenin-1, TSG101, ALIX, CD81 and CD63 and for APO B48 as lipoprotein marker (n = 4); E) Immunophenotyping of hAF-EVs by flow cytometry and MacsPlex Assay for surface antigens profiling; the graph shows the mean ± s.e.m value referring to each antigen expression MFI (n = 6); F) Super-resolution microscopy analysis on hAF-EV for the expression of CD9, CD63 and HLA-G; the graph on the left shows the mean ± s.e.m value referring to the percentage of clusters positive for: triple expression of HLA-G, CD9 and CD63 and single expression of HLA-G or CD63 or CD9 (n = 5); representative images on the right represent single hAF-EV expressing CD63 (green), HLA-G (red), CD9 (magenta), scale bar: 200 and 100 nm. (For interpretation of the references to colour in this figure legend, the reader is referred to the Web version of this article.)
Fig. 2
Fig. 2
hAF-EV paracrine potential against oxidative stress from H2O2injury. A) On the left: representative images of C2C12 cells under control conditions (Ctrl); after 2 h exposure to 1 μM H2O2 (H2O2), following 3 h treatment with hAF-EVs (hAF-EVs) and after being primed with hAF-EVs for 3 h and exposed to 1 μM H2O2 for 2 h (hAF-EVs + H2O2), scale bar: 200 μm. On the right: graph showing the mean ± s.e.m value referring to C2C12 viability with and without oxidative stress and hAF-EV priming by MTT assay (Ctrl: 100 %, n = 9; H2O2: 71.80 ± 3.10 %, n = 9; hAF-EVs + H2O2: 91.30 ± 3.71 %, n = 12; hAF-EVs: 89.30 ± 3.90 %, n = 12; ****p < 0.0001; *p = 0.0228 H2O2 versus hAF-EVs + H2O2). B) Representative images of hAF-EV uptake from target C2C12 cells in vitro; images were obtained on live cells visualized by means of phase contrast microscopy (Bright-field) while DiR + hAF-EVs were in red (CYN5); scale bar: 200 μm. C) Metabolic profile of C2C12 with and without oxidative stress (n = 8) and with hAF-EV priming (n = 12). The graphs show the mean ± s.e.m value of the following analyses: ATP synthesis by nmol ATP/min/106 cells (Ctrl: 53.91 ± 0.70; H2O2: 24.54 ± 0.70; hAF-EVs + H2O2: 49.15 ± 0.90; hAF-EVs: 52.80 ± 0.61; ****p < 0.0001; ***p = 0.0005 Ctrl versus hAF-EVs + H2O2; **p = 0.0032 hAF-EVs + H2O2 versus hAF-EVs, nmol: nanomoles, min: minutes); oxygen consumption rate (OCR) by nmol O/min/106 cells (Ctrl: 21.81 ± 0.34; H2O2: 12.41 ± 0.31; hAF-EVs + H2O2: 19.70 ± 0.92; hAF-EVs: 21.75 ± 0.30; ****p < 0.0001; *p = 0.0382 and p = 0.0241 for Ctrl versus hAF-EVs + H2O2and hAF-EVs + H2O2 versus hAF-EVs, respectively; O: oxygen) and P/O ratio (Ctrl: 2.45 ± 0.01; H2O2: 1.98 ± 0.01; hAF-EVs + H2O2: 2.41 ± 0.01; hAF-EVs: 2.43 ± 0.01; ****p < 0.0001); LDH activity by U/mg (Ctrl: 0.65 ± 0.01; H2O2: 1.30 ± 0.02; hAF-EVs + H2O2: 0.63 ± 0.01; hAF-EVs: 0.62 ± 0.01; ****p < 0.0001; U: units; mg: milligrams) and MDA activity by μM/mg (Ctrl: 4.10 ± 0.08; H2O2: 7.15 ± 0.15; hAF-EVs + H2O2: 4.71 ± 0.07; hAF-EVs: 3.86 ± 0.08; ****p < 0.0001; μM: micromolar; U: units; mg: milligrams). D) Viability analysis on hMT under control conditions (Ctrl), after 2 h exposure to 1 mM H2O2 (H2O2), following 3 h treatment with hAF-EVs (hAF-EVs) and after being primed with hAF-EVs for 3 h and exposed to 1 mM H2O2 for 2 h (hAF-EVs + H2O2). The graph on the left refers to the CCK8 viability assay showing the mean ± s.e.m value referring to hMT viability in fold change with and without oxidative stress and hAF-EVs priming (n = 7; Ctrl: 1.00 ± 0.01; H2O2: 0.84 ± 0.02; hAF-EVs + H2O2: 0.95 ± 0.01; ****p < 0.0001; *p = 0.0217). Panel on the right refers to cleaved Caspase-3 expression (C-Casp3) by hMT under control conditions (Ctrl), after 2 h exposure to 1 mM H2O2 (H2O2), following 3 h treatment with hAF-EVs (hAF-EVs) and after being primed with hAF-EVs for 3 h and exposed to 1 mM H2O2 for 2 h (hAF-EVs + H2O2) with representative images of immunohistochemical staining for cTnT-positive cardiomyocytes (green) and apoptotic C-Casp3-positive cells (red); nuclei are in blue by DAPI; scale bar: 50 μm. On the right graph showing mean ± s.e.m value of C-Casp3 area in percentage (Ctrl: 0.30 ± 0.02 %, n = 4; H2O2: 0.70 ± 0.13 %, n = 7; hAF-EVs + H2O2: 0.24 ± 0.03 %, n = 6; *p = 0.0374; **p = 0.0074); E) Representative images of hAF-EV uptake from hMT in vitro; images were obtained on live hMT visualized by phase contrast microscopy (Bright-field) while DiR + hAF-EVs were in red (CYN5); scal bar: 200 μm. (For interpretation of the references to colour in this figure legend, the reader is referred to the Web version of this article.)
Fig. 3
Fig. 3
hAF-EV paracrine potential against oxidative stress from pro-fibrotic activation. A) Real-time qRT-PCR analysis for Collagen 1 (COLL-1) expression over GAPDH as housekeeping. The graph shows the mean ± s.e.m fold change value of COLL-1/GAPDH of hMT with and without oxidative stress and hAF-EVs priming (n = 7; Ctrl: 1.00 ± 0.10; H2O2: 1.93 ± 0.39; hAF-EVs + H2O2: 0.91 ± 0.20; *p = 0.049 Ctrl versus H2O2; *p = 0.0292 H2O2 versus hAF-EVs + H2O2). B) Evaluation of ROS production by DHE assay on hCF with and without TGFβ treatment; the graph shows the mean ± s.e.m of fold change value (Ctrl: 1.02 ± 0.03, n = 15; TGFβ: 1.12 ± 0.02, n = 16; *p = 0.023). C) Evaluation of hMT size variation (Δ size in μm) cultured in control conditions (Ctrl), with TGFβ treatment (TGFβ) and with hAF-EV and TGFβ treatment (hAF-EVs + TGFβ) after 7 days (Ctrl: 22.30 ± 4.50, n = 21; TGFβ: −1.93 ± 3.20, n = 22; hAF-EVs + TGFβ: 5.63 ± 4.00, n = 13; ****p < 0.0001; *p = 0.0256; μm: micron). D) Immunohistochemical staining for Vimentin (VIM) over cardiac Troponin T (cTnT) expression within hMT cultured in control conditions (Ctrl), with TGFβ treatment (TGFβ) and with hAF-EV and TGFβ treatment (hAF-EVs + TGFβ); on the left: representative images showing cTnT-positive cardiomyocytes (green) and VIM-positive fibroblasts (red), nuclei are in blue by DAPI staining; scale bar: 50 μm; on the right, the graph shows the mean ± s.e.m of VIM/cTnT area in arbitrary units (Ctrl: 37.74 ± 3.36, n = 14; TGFβ: 73.68 ± 7.51, n = 21; hAF-EVs + TGFβ: 41.77 ± 4.35, n = 16; **p = 0.002; *p = 0.0476). E) Immunohistochemical staining for alpha smooth muscle actin (aSMA) over cardiac Troponin T (cTnT) expression within hMT cultured in control conditions (Ctrl), with TGFβ treatment (TGFβ) and with hAF-EV and TGFβ treatment (hAF-EVs + TGFβ); on the left: representative images showing cTnT-positive cardiomyocytes (green) and aSMA-positive myofibroblasts (red), nuclei are in blue by DAPI staining; scale bar: 50 μm; on the right, the graph shows the mean ± s.e.m of aSMA/cTnT area in arbitrary units (Ctrl: 2.90 ± 0.39, n = 18; TGFβ: 7.20 ± 1.20, n = 21; hAF-EVs + TGFβ: 0.80 ± 0.18, n = 10; *p = 0.0498; **p = 0.0085; ****p < 0.0001). (For interpretation of the references to colour in this figure legend, the reader is referred to the Web version of this article.)
Fig. 4
Fig. 4
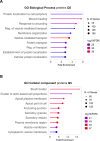
Characterization of hAF-EV cargo. A) Heatmap of protein expression levels in hAF-EV samples (n = 6). The 3351 identified proteins are divided into five quantiles (Q1-Q5) based on their median log2 intensity, with Q1 representing the lowest and Q5 representing the highest values. B) Rank plot showing proteins detected in hAF-EVs (x-axis) ranked from highest to lowest median log2 protein abundance (y-axis). Proteins related to energy metabolism and antioxidant response are highlighted. C) Metabolic profile of hAF-EV samples (n = 6) in terms of ATP synthesis (523.97 ± 18.64 nmol ATP/min/mg), OCR (328.61 ± 13.63 nmol O/min/mg) and P/O (1.60 ± 0.03). D-F) Enrichment analysis from RNAseq of hAF-EV samples (n = 7) with enrichment analysis for GO biological process, GO molecular function and KEGG human gene ontology sorted by p-value ranking; arrows pointing at ATP biosynthetic process, oxidoreduction-driven active transmembrane transporter activity and oxidative phosphorylation. GO: gene ontology; Q: quantile; SOD: superoxide dismutase; OxPhos: oxidative phosphorylation; nmol: nanomoles; min: minutes; mg: milligrams; O: oxygen; KEGG: Kyoto encyclopaedia of genes and genomes.
figs1
figs1
figs2
figs2

References

    1. Pozzobon M., D'Agostino S., Roubelakis M.G., Cargnoni A., Gramignoli R., Wolbank S., Gindraux F., Bollini S., Kerdjoudj H., Fenelon M., Di Pietro R., Basile M., Borutinskaite V., Piva R., Schoeberlein A., Eissner G., Giebel B., Ponsaert P. General consensus on multimodal functions and validation analysis of perinatal derivatives for regenerative medicine applications. Front. Bioeng. Biotechnol. 2022;10 doi: 10.3389/fbioe.2022.961987. - DOI - PMC - PubMed
    1. Silini A.R., Di Pietro R., Lang-Olip I., Alviano F., Banerjee A., Basile M., Borutinskaite V., Eissner G., Gellhaus A., Giebel B., Huang Y., Janev A., Erdani Kreft M., Kupper N., Abadia-Molina A.C., Olivares E.G., Pandolfi A., Papait A., Pozzobon M., Ruiz-Ruiz C., Soritau O., Susman S., Szukiewicz D., Weidinger A., Wolbank S., Huppertz B., Parolini O. Perinatal derivatives: where do we stand? A roadmap of the human placenta and consensus for tissue and cell nomenclature. Front. Bioeng. Biotechnol. 2020;8 doi: 10.3389/fbioe.2020.610544. - DOI - PMC - PubMed
    1. Papait A., Silini A.R., Gazouli M., Malvicini R., Muraca M., O'Driscoll L., Pacienza N., Toh W.S., Yannarelli G., Ponsaerts P., Parolini O., Eissner G., Pozzobon M., Lim S.K., Giebel B. Perinatal derivatives: how to best validate their immunomodulatory functions. Front. Bioeng. Biotechnol. 2022;10 doi: 10.3389/fbioe.2022.981061. - DOI - PMC - PubMed
    1. Bollini S., Cheung K.K., Riegler J., Dong X., Smart N., Ghionzoli M., Loukogeorgakis S.P., Maghsoudlou P., Dube K.N., Riley P.R., Lythgoe M.F., De Coppi P. Amniotic fluid stem cells are cardioprotective following acute myocardial infarction. Stem Cell. Dev. 2011;20:1985–1994. doi: 10.1089/scd.2010.0424. - DOI - PubMed
    1. Zani A., Cananzi M., Fascetti-Leon F., Lauriti G., Smith V.V., Bollini S., Ghionzoli M., D'Arrigo A., Pozzobon M., Piccoli M., Hicks A., Wells J., Siow B., Sebire N.J., Bishop C., Leon A., Atala A., Lythgoe M.F., Pierro A., Eaton S., De Coppi P. Amniotic fluid stem cells improve survival and enhance repair of damaged intestine in necrotising enterocolitis via a COX-2 dependent mechanism. Gut. 2014;63:300–309. doi: 10.1136/gutjnl-2012-303735. - DOI - PubMed

LinkOut - more resources