. 2024 Aug 6;36(8):1711-1725.e8.
doi: 10.1016/j.cmet.2024.05.015. Epub 2024 Jun 19.

PKD1 mutant clones within cirrhotic livers inhibit steatohepatitis without promoting cancer

Affiliations

PKD1 mutant clones within cirrhotic livers inhibit steatohepatitis without promoting cancer

Min Zhu et al. Cell Metab. .

Abstract

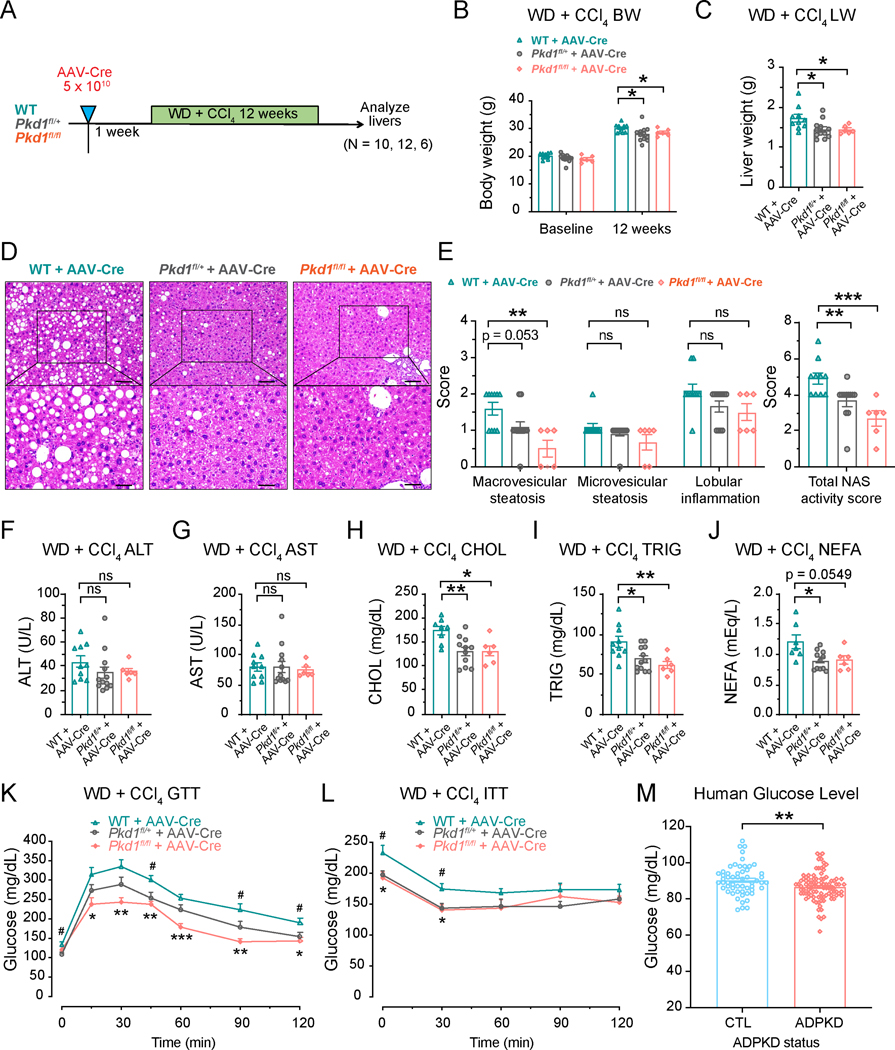
Somatic mutations in non-malignant tissues are selected for because they confer increased clonal fitness. However, it is uncertain whether these clones can benefit organ health. Here, ultra-deep targeted sequencing of 150 liver samples from 30 chronic liver disease patients revealed recurrent somatic mutations. PKD1 mutations were observed in 30% of patients, whereas they were only detected in 1.3% of hepatocellular carcinomas (HCCs). To interrogate tumor suppressor functionality, we perturbed PKD1 in two HCC cell lines and six in vivo models, in some cases showing that PKD1 loss protected against HCC, but in most cases showing no impact. However, Pkd1 haploinsufficiency accelerated regeneration after partial hepatectomy. We tested Pkd1 in fatty liver disease, showing that Pkd1 loss was protective against steatosis and glucose intolerance. Mechanistically, Pkd1 loss selectively increased mTOR signaling without SREBP-1c activation. In summary, PKD1 mutations exert adaptive functionality on the organ level without increasing transformation risk.

Keywords: HCC; NASH; PKD1; fatty liver; liver cancer; mTOR; somatic mutations; steatosis.


Conflict of interest statement

Declaration of interests H.Z. is an academic co-founder of Quotient Therapeutics and Jumble Therapeutics, has sponsored research agreements with Alnylam Pharmaceuticals and Chroma Medicines, and serves on the scientific advisory boards of Newlimit and Ubiquitix. A.S.L.Y. has served as a consultant or advisory board member for Regulus, Calico, Otsuka, Navitor, Palladio, and Reata. A.G.S. serves as a consultant for Verve Therapeutics.

Figures

Figure 1.
Figure 1.. Ultra-deep targeted sequencing in human cirrhotic samples.
A. Gender, liver disease etiology, and fibrosis stage of patients. B. Gross picture of liver samples used for ultra-deep targeted sequencing (Scale bar = 10 mm). C. Mutant clone volume and mass calculated from the product of VAF and liver sample mass. D. Variants per sample, variant classification, SNV class. E. Examples of mutations that are shared by adjacent tissues. The clone size is proportional to the VAF of that mutation. F. Waterfall plot of the somatic mutations detected. G. Mutations within the PKD1 gene. H. Table of the top recurrently mutated genes. See also Figure S1, Table S1–S3.
Figure 2.
Figure 2.. PKD1 does not have tumor suppressor activities in multiple HCC mouse models.
A. Representative pictures of WT or Pkd1 mutant livers from different liver cancer models. Pkd1 was deleted specifically in the liver using AAV-Cre, as specified in the figure. In most cases, only one allele of Pkd1 was deleted, except for the DEN + CCl4 model where either one or both alleles was deleted. B.Quantitation of surface tumor numbers in DEN (p35) treated livers where Pkd1 was deleted using AAV-Cre prior to DEN was given (N = 6, 8), DEN (p14) treated livers where Pkd1 was deleted using AAV-Cre after DEN was given (N = 15, 13), and that of DEN (p35) plus chronic CCl4 treated livers where Pkd1 was deleted prior to DEN was given (N = 3, 9, 6). C. Liver/Body weight ratio (%) of livers shown in A. D. Representative H&E images of liver sections from the DEN (p35), DEN (p14), and DEN (p35) + CCl4 treated livers shown in A. E. Quantitation of microscopic tumor area (%) in DEN (p35) treated livers (N = 6, 8), DEN (p14) treated livers (N = 15, 13), and that of DEN (p35) +CCl4 treated livers (N = 3, 9, 6). *, p<0.05. F. Representative pictures of WT or Pkd1 mutant livers from different HDT induced liver cancer models. Pkd1 was deleted specifically in the liver using AAV-Cre, as specified in the figure. G. Left: Quantitation of surface tumor numbers in HDT induced cMyc; shTp53 liver cancers. Pkd1 was deleted using AAV-Cre prior to oncogene delivery via HDT (N = 7, 10). Middle: Incidence of HCC development in the HDT induced NrasG12V; shTp53 liver cancer model. Pkd1 was deleted using AAV-Cre prior to oncogene delivery via HDT. Right: Quantitation of surface tumor numbers in HDT induced ΔN90-CTNNB1 and sgArid2/Cas9 liver cancers. Pkd1 was deleted using AAV-Cre prior to oncogene delivery via HDT (N = 9, 10). H. Liver/Body weight ratio (%) of livers shown in F. All data are presented as mean ± SEM. *, p<0.05. See also Figure S2.
Figure 3.
Figure 3.. Pkd1 loss promotes liver regeneration after PHx.
A. Schema of Pkd1 deletion and PHx experiment. B. Representative regenerating livers from AAV-Cre injected Pkd1+/+, Pkd1fl/+, and Pkd1fl/fl mice taken 48 hours after PHx. C. Liver/body weights of surgically resected (N = 12, 11, 11) and regenerating livers taken 48 hours post-PHx (N = 10, 10, 11). *, p<0.05. D. Representative images of BrdU stained liver sections from AAV-Cre injected Pkd1+/+, Pkd1fl/+, and Pkd1fl/fl mice taken 48 hours post-PHx (Scale bar = 250 μm). E. Quantitation of BrdU positive cells per image field in D (N = 10, 9, 11). F. Representative images of CTNNB1 staining of WT, Pkd1 Het or Pkd1 Homo KO livers before and after partial hepatectomy (upper row scale bar = 200 μm; lower row scale bar = 100 μm). G. Statistical analysis of the average number of cells per mm2 of an image in F. Each data point is one image, and 3 images were taken for each mouse (N = 9, 9, 10 mice). *, p<0.05; **, p<0.01. All data are presented as mean ± SEM. *, p<0.05.
Figure 4.
Figure 4.. Liver-specific Pkd1 mutant mice are protected from fatty liver disease.
A. Schema for the NASH experiment. Pkd1 deletion is induced by high dose AAV-Cre (5 × 10¹⁰ GC) and NASH is induced with WD and weekly injection of CCl4. B. Body weights of mice before and after 12 weeks of WD + CCl4 (N = 10, 12, 6). *, p<0.05. C. Liver weights of mice after 12 weeks of WD + CCl4. *, p<0.05. D. H&E images of WT, Pkd1fl/+, and Pkd1fl/fl mice injected with AAV-Cre (upper row scale bar = 100 μm; lower row scale bar = 50 μm). E. Left: Quantification of macrovesicular steatosis, microvesicular steatosis, and lobular inflammation (N = 10, 12, 6). **, p<0.01. Right: Total NAS activity score (N = 10, 12, 6). **, p<0.01; ***, p<0.001. F-J. Plasma levels of ALT (N = 10, 12, 6), AST (N = 10, 12, 6), cholesterol (N = 8, 11, 6), triglyceride (N = 10, 12, 6), and NEFA (N = 7, 11, 6) at the study endpoint. *, p<0.05; **, p<0.01. K. Glucose tolerance test (N = 10, 12, 6). #, WT vs. heterozygous, p<0.05. *, WT vs. homozygous, p<0.05; **, WT vs. homozygous, p<0.01; ***, WT vs. homozygous, p<0.001. L. Insulin tolerance test (N = 10, 12, 6). #, WT vs. heterozygous, p<0.05. *, WT vs. homozygous, p<0.05. M. Fasting blood glucose in patients with and without ADPKD (N = 56, 96), **, p<0.01 (p=0.006). All data are presented as mean ± SEM. *, p<0.05; **, p<0.01; ***, p<0.001. See also Figure S3–S5.
Figure 5.
Figure 5.. Pkd1 mutant clones expand in the context of NASH.
A. Left panel: Schema for labeling mosaic clones with low dose AAV-Cre. Middle panel: Representative image of Tomato+ clones in a Rosa-LSL-tdTomato+/− liver collected one week after receiving low dose AAV-Cre (1.25 × 10⁹ GC) (scale bar = 200 μm). Right panel: Statistical analysis of Tomato+ stained area (%) per image. Each triangle is one image, and 3 images are taken from each mouse (N = 2 total mice). B. Schema for the NASH experiment. Mosaic Pkd1 deletion is induced with low dose AAV-Cre and NASH is induced with WD and weekly injection of CCl4. C. Representative H&E staining images of WT, Pkd1fl/+, and Pkd1fl/fl livers (upper row scale bar = 100 μm; lower row scale bar = 50 μm). D. Left: Representative Ki67 staining images of WT, Pkd1fl/+, and Pkd1fl/fl livers (Scale bar = 100 μm). Right: Quantification of Ki67 positive hepatocytes (N = 6, 8, 6). *, p<0.05. E. Schema for the NASH experiment using a different genetic approach. Mosaic Pkd1 deletion is induced with low dose AAV-Cre and NASH is induced with WD and weekly injection of CCl4. Control mice are generated with the same low dose of AAV-GFP. F. Representative H&E staining images (upper row scale bar = 100 μm; lower row scale bar = 50 μm). G. Left: Representative Ki67 staining images (Scale bar = 100 μm). Right: Quantification of Ki67 positive hepatocytes (N = 5, 5). *, p<0.05. H. Left panel: Schema for labeling mosaic clones with a lower dose of AAV-Cre. Middle panel: Representative image of Tomato+ clones in a Rosa-LSL-tdTomato+/− liver collected one week after receiving a very low dose AAV-Cre (6.25 × 10⁸ GC) (scale bar = 200 μm). Right panel: Statistical analysis of Tomato+ stained area (%) per image. Each triangle is one image, and 3 images are taken from each mouse (N = 2 total mice). VLD = very low dose. I. Schema of the lineage tracing experiment. J. Representative images of Tomato+ clones in Pkd1 WT vs. mutant livers at 12 weeks of the WD + CCl4 assay (scale bar = 200 μm). K. Statistical analysis of Tomato+ area (%) in “J”. (N = 10, 9). *, p<0.05. L. Statistical analysis of Tomato+ clone numbers of different size (nuclei) in “J”. (N = 10, 9). **, p<0.01. M. Representative H&E images of livers from each group in “I” (scale bar = 100 μm). All data are presented as mean ± SEM. *, p<0.05; **, p<0.01; ***, p<0.001. See also Figure S6.
Figure 6.
Figure 6.. RNA seq data and validation by qPCR and Western Blot.
A. All panels in this figure are from livers after 12 weeks of WD + CCl4. Shown in this panel is RNA seq pathway analysis of WD + CCl4 livers. B. Western blot analysis of mTOR pathway components and downstream targets. C. Quantification of blots from panel B (N = 10, 12, 6). *, p<0.05; **, p<0.01. D. p-S6 IHC staining of the liver (Scale bar = 100 μm). E. WD + CCl4 livers RNA seq heat map. F. qPCR of top regulated genes in E (N = 10, 12, 6). *, p<0.05; **, p<0.01; ***, p<0.001. G. Western blot for Cyclin D1 in WD + CCl4 treated livers (N = 10, 12, 6). H. Quantification of blots from panel g (N = 10, 12, 6). **, p<0.01. All data are presented as mean ± SEM. *, p<0.05; **, p<0.01; ***, p<0.001. See also Figures S7.
Figure 7.
Figure 7.. Pkd1 mutant livers exhibit mTOR pathway activation.
A. All panels in this figure are from livers after 12 weeks of WD + CCl4. Shown in this panel is qPCR of glycolysis related genes (N = 9, 9, 6). *, p<0.05. B. qPCR of gluconeogenesis related genes (N = 9, 9, 6). C. Western blot analysis of SREBP and FASN. GAPDH blot image is the same as the one shown in Figure 6B. D. Quantification of blots from panel C (N = 10, 12, 6). **, p<0.01. E. Western blot of precursor and cleaved active forms of Srebp-1c in the cytosol (Cyt) and nuclear (NE) fractions. F. qPCR of de novo lipogenesis or cholesterol synthesis related genes (N = 10, 12, 6). G. qPCR of fatty acid oxidation related genes (N = 9, 9, 6). **, p<0.01. All data are presented as mean ± SEM. *, p<0.05; **, p<0.01; ***, p<0.001. See also Figure S7.

References

    1. Martincorena I, Fowler JC, Wabik A, Lawson ARJ, Abascal F, Hall MWJ, Cagan A, Murai K, Mahbubani K, Stratton MR, et al. (2018). Somatic mutant clones colonize the human esophagus with age. Science 362, 911–917. 10.1126/science.aau3879. - DOI - PMC - PubMed
    1. Martincorena I, and Campbell PJ (2015). Somatic mutation in cancer and normal cells. Science 349, 1483–1489. 10.1126/science.aab4082. - DOI - PubMed
    1. Lee-Six H, Olafsson S, Ellis P, Osborne RJ, Sanders MA, Moore L, Georgakopoulos N, Torrente F, Noorani A, Goddard M, et al. (2019). The landscape of somatic mutation in normal colorectal epithelial cells. Nature 574, 532–537. 10.1038/s41586-019-1672-7. - DOI - PubMed
    1. Jaiswal S, and Ebert BL (2019). Clonal hematopoiesis in human aging and disease. Science 366. 10.1126/science.aan4673. - DOI - PMC - PubMed
    1. Zhu M, Lu T, Jia Y, Luo X, Gopal P, Li L, Odewole M, Renteria V, Singal AG, Jang Y, et al. (2019). Somatic mutations increase hepatic clonal fitness and regeneration in chronic liver disease. Cell 177, 608–621.e12. 10.1016/j.cell.2019.03.026. - DOI - PMC - PubMed

MeSH terms

Substances