. 2024 Jun 20;15(1):5272.
doi: 10.1038/s41467-024-49529-x.

Single-cell transcriptional profile of CD34+ hematopoietic progenitor cells from del(5q) myelodysplastic syndromes and impact of lenalidomide

Affiliations

Single-cell transcriptional profile of CD34+ hematopoietic progenitor cells from del(5q) myelodysplastic syndromes and impact of lenalidomide

Guillermo Serrano et al. Nat Commun. .

Abstract

While myelodysplastic syndromes with del(5q) (del(5q) MDS) comprises a well-defined hematological subgroup, the molecular basis underlying its origin remains unknown. Using single cell RNA-seq (scRNA-seq) on CD34+ progenitors from del(5q) MDS patients, we have identified cells harboring the deletion, characterizing the transcriptional impact of this genetic insult on disease pathogenesis and treatment response. Interestingly, both del(5q) and non-del(5q) cells present similar transcriptional lesions, indicating that all cells, and not only those harboring the deletion, may contribute to aberrant hematopoietic differentiation. However, gene regulatory network (GRN) analyses reveal a group of regulons showing aberrant activity that could trigger altered hematopoiesis exclusively in del(5q) cells, pointing to a more prominent role of these cells in disease phenotype. In del(5q) MDS patients achieving hematological response upon lenalidomide treatment, the drug reverts several transcriptional alterations in both del(5q) and non-del(5q) cells, but other lesions remain, which may be responsible for potential future relapses. Moreover, lack of hematological response is associated with the inability of lenalidomide to reverse transcriptional alterations. Collectively, this study reveals transcriptional alterations that could contribute to the pathogenesis and treatment response of del(5q) MDS.


Conflict of interest statement

The authors declare no competing interests.

Figures

Fig. 1
Fig. 1. Hematopoietic CD34+ cells from four independent del(5q) MDS patients were assayed by scRNAseq.
A CD34+ cells were obtained from bone marrow aspirates of newly diagnosed del(5q) MDS patients, healthy donors and patients treated with Lenalidomide, and were subjected to single-cell RNA sequencing and analysis. PCR partial cytogenetic responder, CCR complete cytogenetic responder, NR non-responder. Part of this figure was created with BioRender.com. B Uniform Manifold Approximation and Projection (UMAP) of 42,494 cells representing the expected 14 hematopoietic progenitors: HSC hematopoietic stem cells, LMPP lymphoid-primed multipotent progenitors, GMP granulocyte-monocyte progenitors; granulocyte progenitors; monocyte progenitors; dendritic cell progenitors; CLP common lymphoid progenitors; B-cell progenitors; T-cell progenitors; MEP megakaryocyte-erythroid progenitors; MK_Prog megakaryocyte progenitors; early erythroid progenitors; late erythroid progenitors; basophil progenitors. C Per patient UMAP showing the identity of the cells projected from the integrated space. D Dotplot showing the percentage and value of the normalized expression of the canonical marker genes used to assign the cell identity to each cluster. E Barplot representing the contribution of cells from each patient to the different cell types. F Barplot representing the number of cells assigned to each cell type for the studied patients. G Barplot representing the percentage of cells assigned to each cell type for del(5q) MDS patients and healthy samples. N = 7 biologically independent samples were used (n = 3 healthy donors and 4 del(5q) MDS patients). Data are presented as mean values +/−SD. Two-sided Wilcoxon signed-rank test was used to calculate statistical significance. Exact p-values for the differential abundance of each hematopoietic progenitor between the del(5q) MDS and the healthy condition were the following: HSC: p = 0.63; LMPP: p = 0.23; GMP: p = 0.06; Granulocyte: p = 0.23; Monocytes: p = 0.06; DendriticCell: p = 0.63; CLP: p = 1; pro-B: p = 0.23; T: p = 0.04; MEP: p = 0.11; MK_Prog: p = 0.63; EarlyErythroid: p = 1; LateErythroid: p = 0.23; Basophil: p = 0.4.
Fig. 2
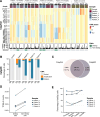
Fig. 2. Identification of cells harboring del(5q) deletion in MDS patients.
A Heatmap of the results of CopyKat showing the copy number alteration score given to each 200 kb bins in chromosome 5. In order to represent cells, a clustering has been performed within each sample (kmeans with k = 80), and a posterior clustering has been applied to detect the clusters containing the cells harboring the deletion. The control sample used by the algorithm is an MDS sample with normal karyotype, while the healthy sample with normal karyotype represents an additional negative control for the analysis. B Barplot representing the percentage of cells inferred by CaSpER that harbor an amplification, a deletion or a normal number of copy number variation in each branch of chromosome 5 per patient. The control corresponds to an MDS sample with normal karyotype, which is used as a reference by the algorithm. C Venn diagram representing the number and percentage of cells classified as del(5q) by both algorithms. D Pseudobulk normalized expression of the 6 CDR-genes with higher expression in our dataset (CD74, RPS14, BTF3, COX7C, HINT1 and RPS23) separated by genotype. N = 4 biologically independent samples were used. The number of del(5q) and non-del(5q) cells were used to generate the pseudobulks for each patient can be found in the Source Data. E Graph depicting the percentages of del(5q) cells inferred by karyotype, CaSpER and CopyKat for each patient. Selected cells correspond to the cells classified as del(5q) cells by both computational algorithms.
Fig. 3
Fig. 3. Distribution of del(5q) cells within the CD34+ compartment of MDS patients.
A UMAP representing all the MDS samples integrated and colored by cell type. The density map represents the distribution of the cells classified as del(5q) by the two algorithms. B UMAPs with density maps representing the distribution of del(5q) cells per individual patient. C Barplots showing the number of del(5q) and non-del(5q) cells composing each cell type for each MDS patient. D Heatmap representing the enrichment of del(5q) cells (-log10(p-value)) in each cell type. Any color different from white represents a statistically significant enrichment of del(5q) cells (p-value < 0.05). p-values were calculated using the one-sided hypergeometric test. The number of biologically independent replicates (cells) used for the hypergeometric test and the exact enrichment p-values can be found in the Source Data.
Fig. 4
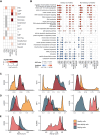
Fig. 4. Differential expression analysis between del(5q) and non-del(5q) cells within MDS samples exposes transcriptional similarities.
A Heatmap representing the differentially expressed genes (Benjamini–Hochberg-adjusted p-values < 0.05 and |logFC|>2) between del(5q) and non-del(5q) cells within each hematopoietic progenitor. The heatmap was created by combining n = 4 del(5q) MDS patients and generating pseudobulks per cell type. The two-sided edgeR’s Likelihood Ratio Test was used to calculate p-values. The exact number of biologically independent replicates (del(5q) and non-del(5q) progenitor cells), as well as the specific p-values for each differentially expressed gene can be found in the Source Data. B Dotplot representing statistically significant biological processes and pathways (Benjamini–Hochberg-adjusted p-values < 0.05) for differentially expressed genes obtained in del(5q) versus Healthy and the non-del(5q) versus Healthy contrasts. The one-sided hypergeometric test was used to calculate p-values. Del(5q) and non-del(5q) cells were derived from n = 4 del(5q) MDS patients, whereas healthy cells were derived from n = 3 healthy donors. Biologically independent replicates (del(5q), non-del(5q) and healthy progenitor cells) used for each comparison are specified in the Source Data. CE Histograms representing the activity score in all the cells separated by conditions. Some regulons behaved similarly in the MDS samples (non-del(5q) and del(5q) cells) compared to healthy cells (C), while other regulons behaved differently in the three different conditions (D). Some inferred regulons had an activity score on the MDS samples, while lacking on the healthy samples (E).
Fig. 5
Fig. 5. Cell-to-cell communication analysis reveals shared and unique interactions in del(5q), non-del(5q) and healthy cells.
A Venn diagram showing the number of unique interactions in del(5q) MDS and healthy samples. Healthy unique interactions were considered as those present in at least one of the healthy individuals, while MDS unique interactions were those that were present in all the patients. Interactions were inferred from n = 4 del(5q) MDS patients and n = 3 healthy donors. B Heatmap depicting the number of interactions triggered by del(5q) and non-del(5q) MDS cells, C as well as those established among healthy hematopoietic progenitors. The Source represents the cell types that express the ligand, whereas the Target represents the cells that express the receptor. D Dotplot representing statistically significant biological processes and pathways (Benjamini–Hochberg-adjusted p-value < 0.05) in which are enriched the encoding genes taking part in the healthy and MDS interactions. The one-sided hypergeometric test was used to calculate p-values, whose exact values can be found in the Source Data. E Chord diagram representing the unique MDS interaction AGTRAP-RACK1 among different del(5q) and non-del(5q) progenitors. F Chord diagram depicting the unique healthy interaction HMGB1-CXCR4 established by healthy hematopoietic progenitors.
Fig. 6
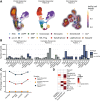
Fig. 6. Distribution of del(5q) cells within CD34+ progenitors after lenalidomide treatment.
A UMAP depicting the del(5q) density across the different hematopoietic progenitors obtained in three patients after lenalidomide treatment. HSC hematopoietic stem cells, LMPP lymphoid-primed multipotent progenitors, GMP granulocyte-monocyte progenitors; granulocyte progenitors; monocyte progenitors; dendritic cell progenitors, CLP common lymphoid progenitors; B-cell progenitors; T-cell progenitors, MEP megakaryocyte-erythroid progenitors, MK_Prog megakaryocyte progenitors; early erythroid progenitors; late erythroid progenitors; basophil progenitors. B Barplots showing the number of del(5q) and non-del(5q) cells composing each cell type for each MDS patient. C Percentage of the cells identified as del(5q) by karyotype, CASPER, CopyKat, and the selection by intersecting the two algorithms. D Heatmap representing the enrichment of del(5q) cells (log10(p-value)) in each cell type. Any color different from white represents a statistically significant enrichment of del(5q) cells (p-value < 0.05). P-values were calculated using the one-sided hypergeometric test. The number of biologically independent replicates (cells) used for the hypergeometric test and the exact enrichment p-values can be found in the Source Data.
Fig. 7
Fig. 7. Differential expression between treated and untreated patients unravels persistent transcriptional alterations after lenalidomide treatment.
A Dotplot representing statistically significant biological processes and pathways (Benjamini–Hochberg-adjusted p-value < 0.05 and |logFC|>2) for differentially expressed genes obtained in different comparisons: non-del(5q) cells of the complete responder vs at diagnosis (1st panel); non-del(5q) cells of the partial responder vs at diagnosis (2nd panel); del(5q) cells of the partial responder vs the non-responder (3rd panel); non-del(5q) cells of the complete responder vs healthy cells (4th panel); non-del(5q) cells of the partial responder vs healthy cells (5th panel). For p-value calculation, one-sided hypergeometric test was used. Specific p-values for statistically significant biological processes can be found in the Source Data. The detailed breakdown of the grouped processes shown can be found in Supplementary Table 2. B Boxplot showing the normalized expression of erythroid differentiation-related genes for non-del(5q) cells in MDS at diagnosis (n = 4) or after treatment with lenalidomide (partial responder, n = 1; complete responder, n = 1). Biologically independent replicates (cells) for hematopoietic progenitors were: Early Erythroid: n = 5196 (MDS at diagnosis); n = 2200 (Partial Responder); n = 3496 (Complete Responder); Late Erythroid: n = 7168 (MDS at diagnosis); n = 1056 (Partial Responder); n = 1880 (Complete Responder); MEP: n = 3108 (MDS at diagnosis); n = 824 (Partial Responder); n = 844 (Complete Responder). Two-sided Wilcoxon signed-rank test was used to calculate p-values, that were then Benjamini–Hochberg-adjusted. Box plots indicate median (middle line), 25th, 75th percentile (box) and 5th and 95th percentile (whiskers) as well as outliers (single points). Exact p-values are shown within the figure. C Graphs representing the activity scores of proliferation and differentiation-associated transcription factors in healthy cells and non-del(5q) cells of MDS patients at diagnosis and after lenalidomide treatment, as well as D in del(5q) cells of MDS patients at diagnosis, with a partial response and with no response to lenalidomide. Specific activity scores can be found in the Source Data.

References

    1. Acha P, Solé F. Myelodysplastic Syndromes with Isolated del(5q): Value of Molecular Alterations for Diagnostic and Prognostic Assessment. Cancers. 2022;14:5531. doi: 10.3390/cancers14225531. - DOI - PMC - PubMed
    1. Ebert BL. Molecular dissection of the 5q deletion in myelodysplastic syndrome. Semin. Oncol. 2011;38:621–626. doi: 10.1053/j.seminoncol.2011.04.010. - DOI - PMC - PubMed
    1. Komrokji RS, Padron E, Ebert BL, List AF. Deletion 5q MDS: Molecular and therapeutic implications. Best. Pr. Res. Clin. Haematol. 2013;26:365–375. doi: 10.1016/j.beha.2013.10.013. - DOI - PubMed
    1. Ebert BL, et al. Identification of RPS14 as a 5q 2 syndrome gene by RNA interference screen. Nature. 2008;451:335–339. doi: 10.1038/nature06494. - DOI - PMC - PubMed
    1. Starczynowski DT, et al. Identification of miR-145 and miR-146a as mediators of the 5q– syndrome phenotype. Nat. Med. 2010;16:49–58. doi: 10.1038/nm.2054. - DOI - PubMed

MeSH terms