. 2024 Jun 20;14(1):100.
doi: 10.1038/s41408-024-01080-0.

Multiomic analysis identifies a high-risk signature that predicts early clinical failure in DLBCL

Affiliations

Multiomic analysis identifies a high-risk signature that predicts early clinical failure in DLBCL

Kerstin Wenzl et al. Blood Cancer J. .

Abstract

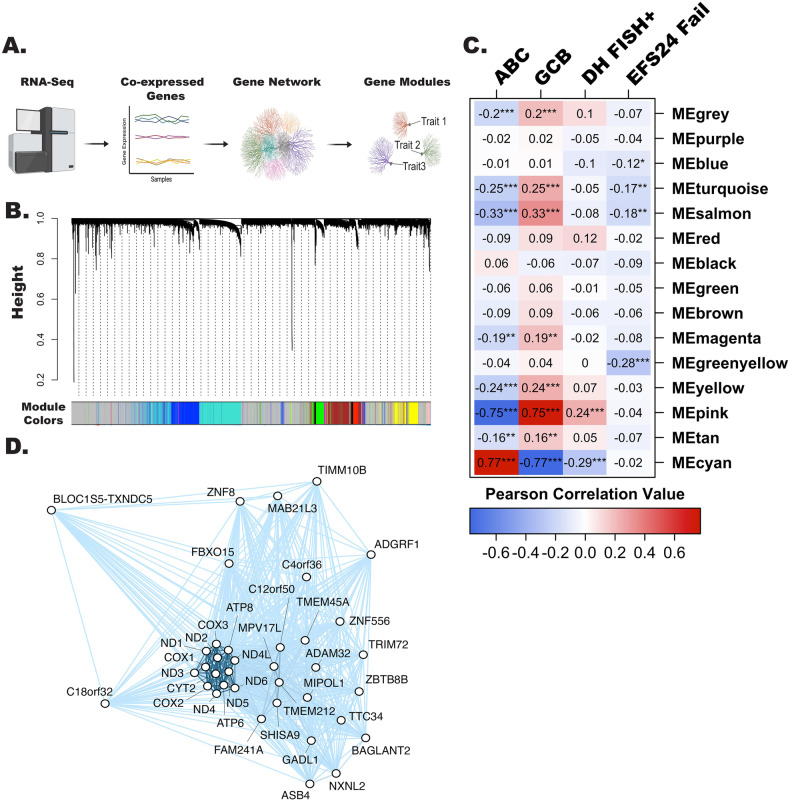
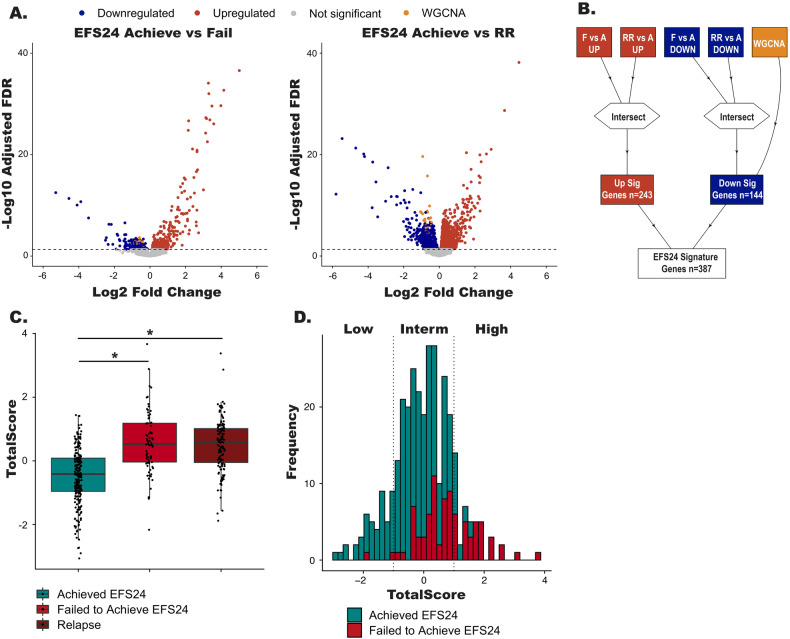
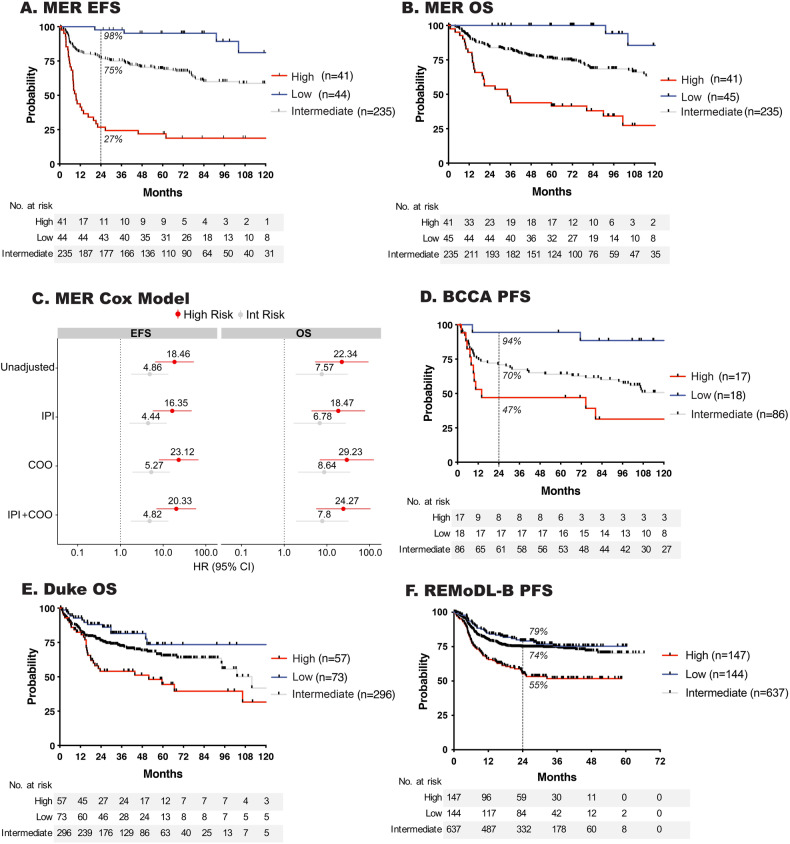
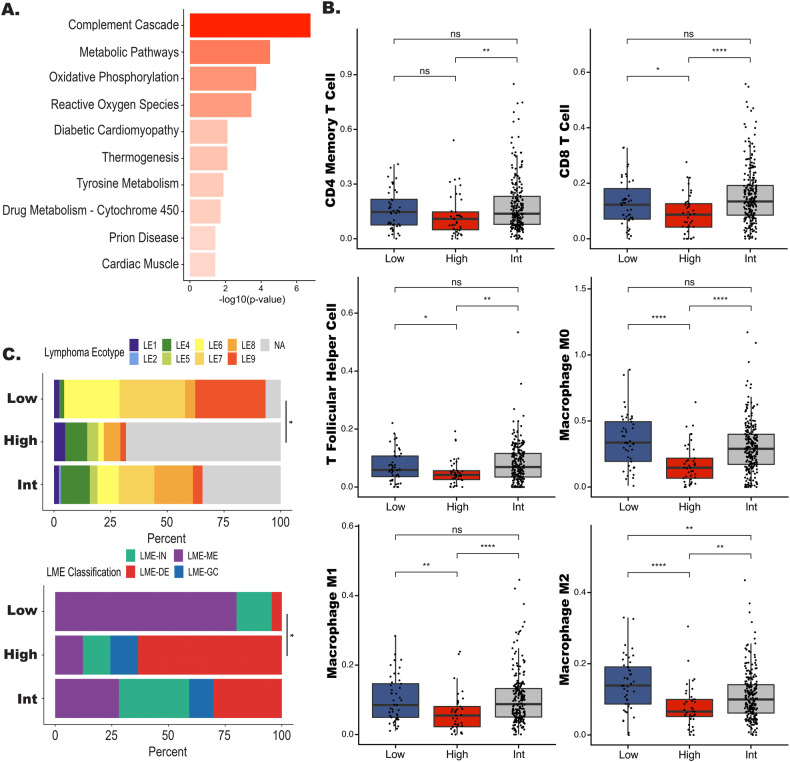
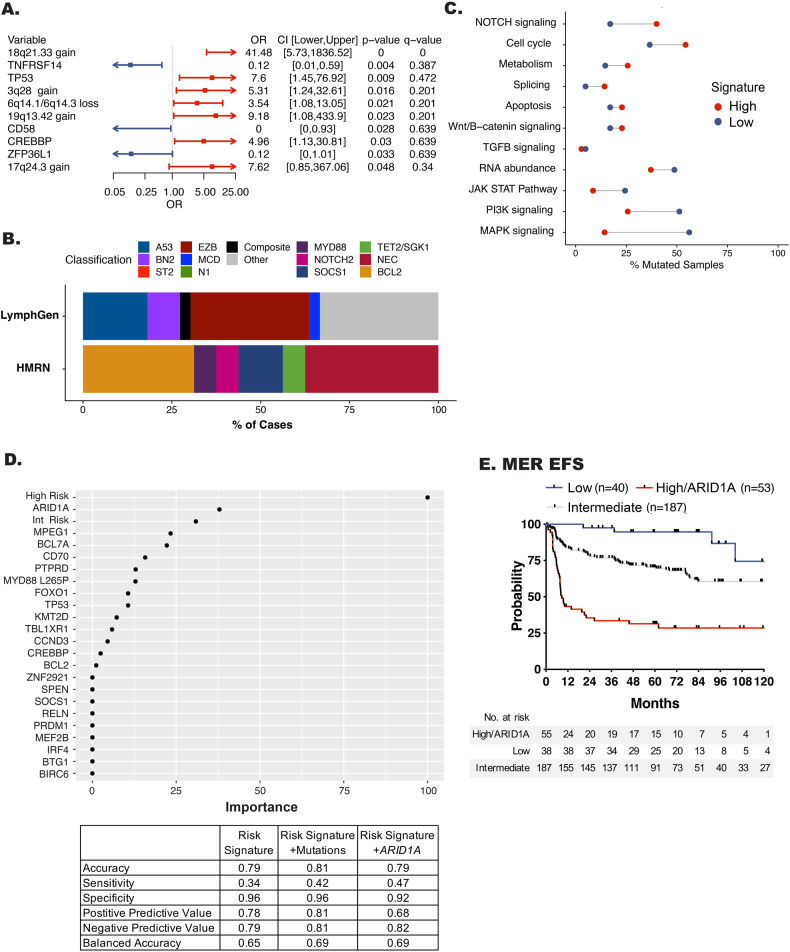
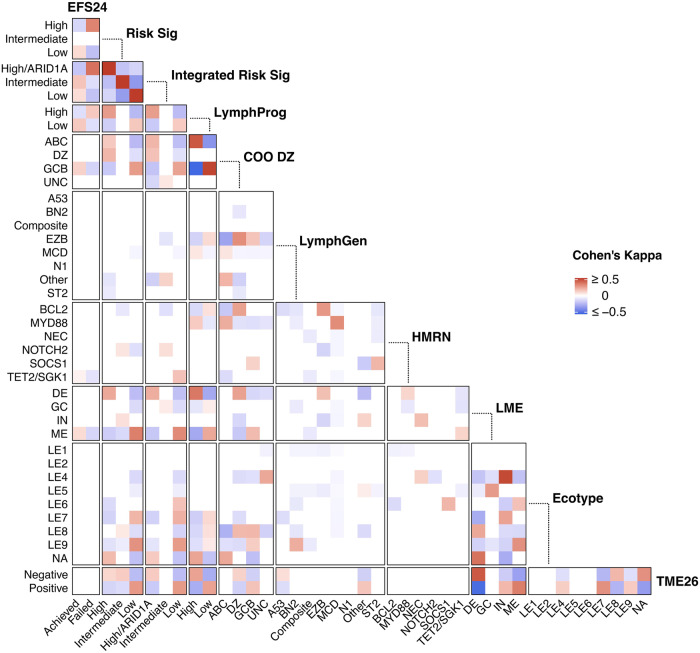
Recent genetic and molecular classification of DLBCL has advanced our knowledge of disease biology, yet were not designed to predict early events and guide anticipatory selection of novel therapies. To address this unmet need, we used an integrative multiomic approach to identify a signature at diagnosis that will identify DLBCL at high risk of early clinical failure. Tumor biopsies from 444 newly diagnosed DLBCL were analyzed by WES and RNAseq. A combination of weighted gene correlation network analysis and differential gene expression analysis was used to identify a signature associated with high risk of early clinical failure independent of IPI and COO. Further analysis revealed the signature was associated with metabolic reprogramming and identified cases with a depleted immune microenvironment. Finally, WES data was integrated into the signature and we found that inclusion of ARID1A mutations resulted in identification of 45% of cases with an early clinical failure which was validated in external DLBCL cohorts. This novel and integrative approach is the first to identify a signature at diagnosis, in a real-world cohort of DLBCL, that identifies patients at high risk for early clinical failure and may have significant implications for design of therapeutic options.


Conflict of interest statement

AJN: Research funding from BMS. MES, MO, NS, CCH, and AKG: employed by BMS.

Figures

Fig. 1
Fig. 1. Current DLBCL classifiers do not discriminate early clinical failures.
LymphGen (A), HMRN (B), and EcoTyper B Cell State (C) classification of ndDLBCL. Pie charts (upper panel) show distribution of cases for each classifier. Sankey plots (middle panel) show the distribution of EFS24 fail or achieve cases for each classifier. Kaplan−Meier analysis (lower panel) of EFS24 for each classifier, LymphGen P = 0.96, HMRN P = 0.98, and B Cell State P = 0.73.
Fig. 2
Fig. 2. WGCNA analysis identifies biological modules associated with DLBCL clinical traits.
A Schematic representation of WGCNA analysis workflow, created with BioRender.com. B Cluster dendrogram showing the 15 identified modules defined by color. The gray module consists of genes that could not be assigned to a co-expression module. C Correlation of individual WGCNA modules with selected traits (COO of ABC or GCB, n = 279, DH-FISH n = 252, and EFS24, n = 321) was performed using Pearson correlation, *P < 0.05, **P < 0.001 and ***P < 0.0001. D Correlation network representation of greenyellow module genes (n = 37) analyzed using the igraph R package.
Fig. 3
Fig. 3. Generation of the RNA risk signatures.
A Volcano plots showing differentially expressed genes (FDR < 0.05) between EFS24 achieve vs fail or EFS24 achieve vs rrDLBCL cases. Red dots represent upregulated genes, blue dots represent downregulated genes, gold dots represent genes identified in the WGCNA analysis, and gray dots are non-significant genes. B Schematic representation of how the 387 gene risk signature was generated. C Boxplots TotalScores for the risk signature foreach patient. *P < 0.05. D Distribution of the scaled Totalscores. Vertical lines represent +/- standard deviation which groups the scaled Totalscores samples into high, low and intermediated risk cases.
Fig. 4
Fig. 4. Outcome and clinical characteristics of risk signature groups.
A Event free and (B) overall survival of MER ndDLBCL cases according to RNA risk signature classification. Cox model of high and intermediate risk signatures compared to low risk unadjusted or adjusted for IPI and/or COO, HR shown on image. DF Validation of RNA risk signature association with outcome in the BCCA, Duke and REMoDL-B DLBCL cohorts. The hashed line and percentage shown on EFS curves indicate the percent of case achieving EFS24 in each risk group.
Fig. 5
Fig. 5. Pathway and TME characteristics of high risk signature DLBCL.
A Bar plot displaying results from overrepresentation analysis for high risk cases. B Boxplots of individual cell populations identified by CIBERSORTX in the low, high, and intermediate risk groups. P values represent comparison between all three groups performed by a Kruskal–Wallis test and the line represents a *P < 0.05 between high and low risk groups performed by Wilcoxon test. C Bar plot showing the distribution of Lymphoma EcoType and LME classification in each risk group. The line represents a *P < 0.05 for the comparison of the number of NA or LME-Depleted between the high and low risk groups.
Fig. 6
Fig. 6. Genetic features of high risk DLBCL.
A Forest plot showing enrichment of mutations and copy number events between the high and low risk groups. B Bar plot showing the distribution of LymphGen and HMRN classification in the high risk group. C Dot plot showing the percentage of samples which have mutations in the represented pathways. Red dots represent the percentage of samples in the high risk group while blue dots represent the percentage of cases in the low risk group. Shown pathways have at least a 1.3 fold increase or decrease between both groups. D Lasso regression model of the predictive value of the risk signatures alone (left panel) or with inclusion of mutations (right panel). Lasso metrics of the risk signature alone, with mutations, or with ARID1A are shown in the Table. E Kaplan−Meir curve showing event free survival of high risk DLBCL with the inclusion of ARID1A mutations.
Fig. 7
Fig. 7. Agreement between DLBCL classifiers in MER DLBCL.
To measure the agreement, or co-occurance, between individual classifiers (ie LympGen EZB with HMRN BCL2), Cohen’s kappa statistic was used. Agreements that had a 95% CI that did not span 0 in a positive (red) or negative (blue) direction are shown in the heatmap.

Update of

References

    1. Coiffier B, Sarkozy C. Diffuse large B-cell lymphoma: R-CHOP failure-what to do? Hematol Am Soc Hematol Educ Program. 2016;2016:366–78. doi: 10.1182/asheducation-2016.1.366. - DOI - PMC - PubMed
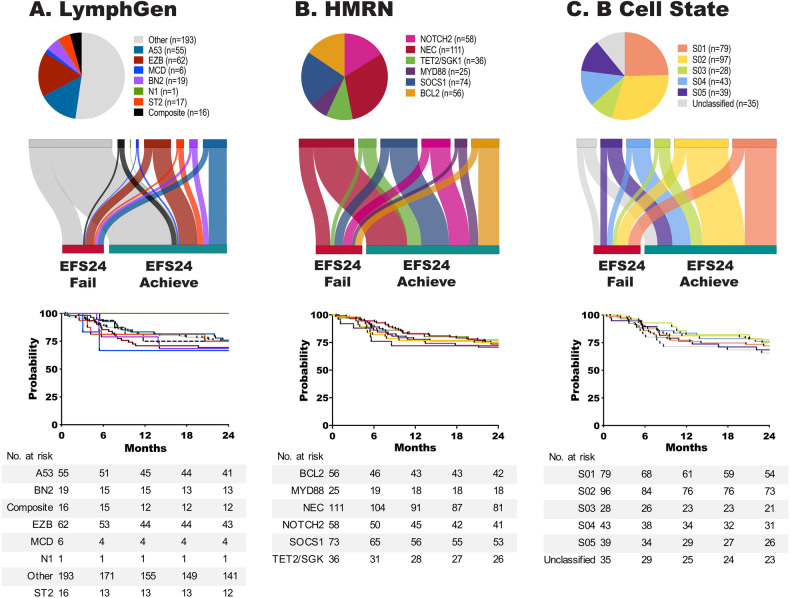
    1. Maurer MJ, Ghesquieres H, Jais JP, Witzig TE, Haioun C, Thompson CA, et al. Event-free survival at 24 months is a robust end point for disease-related outcome in diffuse large B-cell lymphoma treated with immunochemotherapy. J Clin Oncol. 2014;32:1066–73. doi: 10.1200/JCO.2013.51.5866. - DOI - PMC - PubMed
    1. Maurer MJ, Jais JP, Ghesquieres H, Witzig TE, Hong F, Haioun C, et al. Personalized risk prediction for event-free survival at 24 months in patients with diffuse large B-cell lymphoma. Am J Hematol. 2016;91:179–84. doi: 10.1002/ajh.24223. - DOI - PMC - PubMed
    1. Shipp MA, Harrington DP, Anderson JR, Armitage JO, Bonadonna G, Brittinger G, et al. A predictive model for aggressive non-Hodgkin’s lymphoma. The International Non-Hodgkin’s Lymphoma Prognostic Factors Project. N. Engl J Med. 1993;329:987–94. doi: 10.1056/NEJM199309303291402. - DOI - PubMed
    1. Alizadeh AA, Eisen MB, Davis RE, Ma C, Lossos IS, Rosenwald A, et al. Distinct types of diffuse large B-cell lymphoma identified by gene expression profiling. Nature. 2000;403:503–11. doi: 10.1038/35000501. - DOI - PubMed