. 2024 Jun 20;9(1):113.
doi: 10.1038/s41541-024-00900-5.

Distinct dynamics of mRNA LNPs in mice and nonhuman primates revealed by in vivo imaging

Affiliations

Distinct dynamics of mRNA LNPs in mice and nonhuman primates revealed by in vivo imaging

Katia Lemdani et al. NPJ Vaccines. .

Abstract

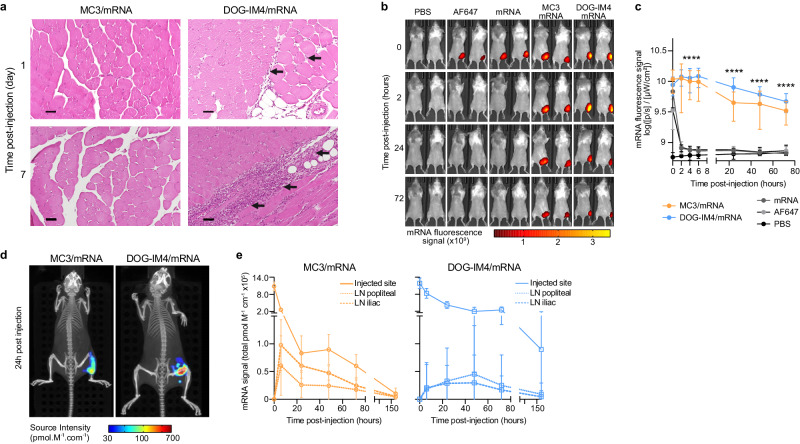
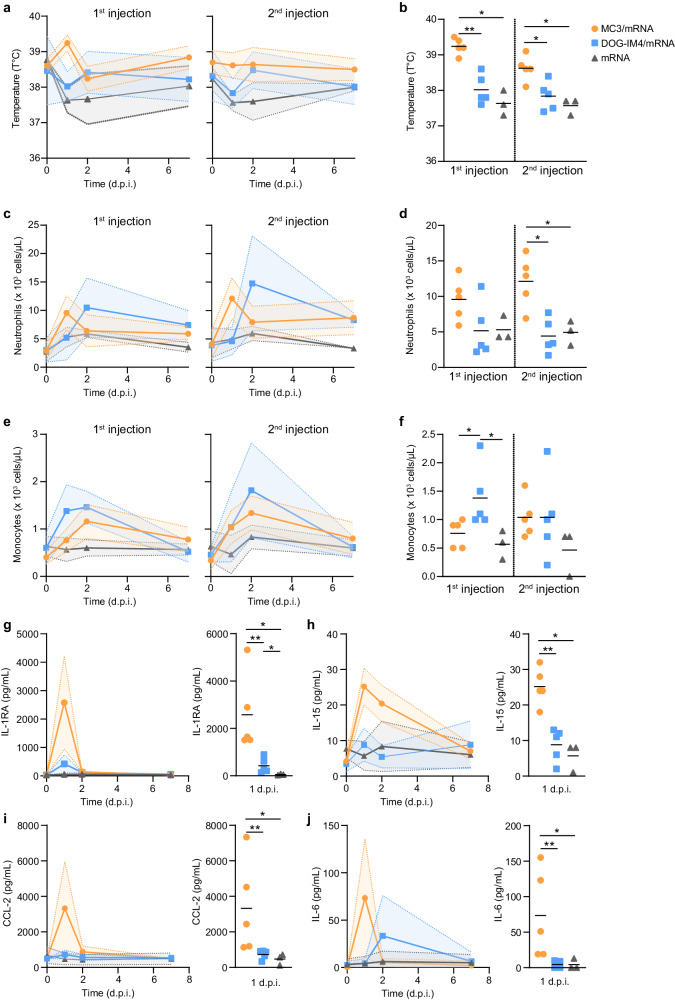
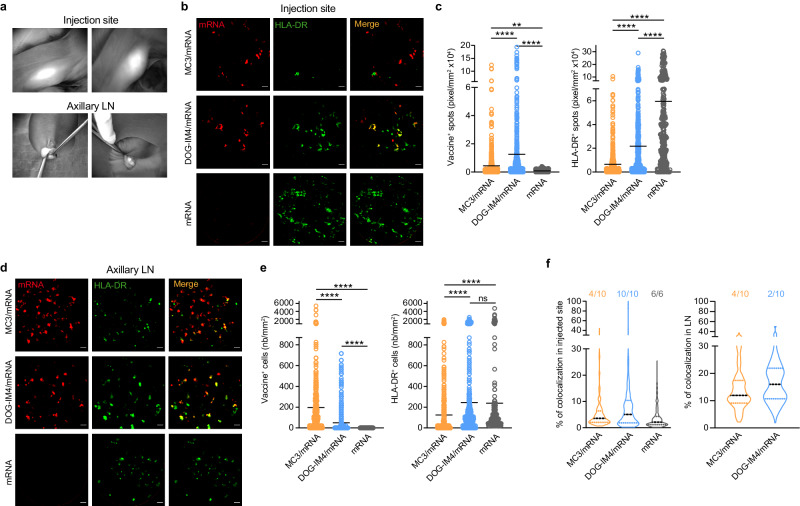
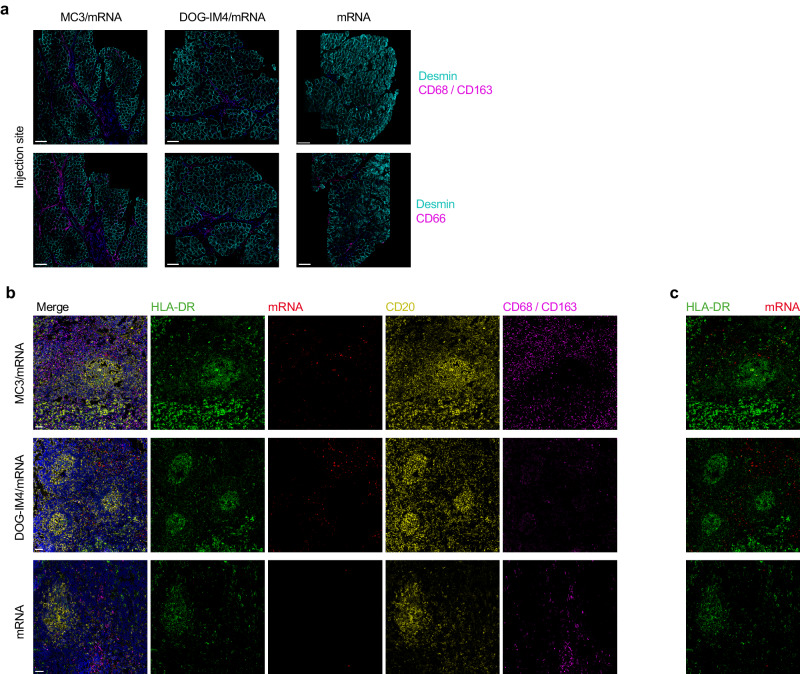
The characterization of vaccine distribution to relevant tissues after in vivo administration is critical to understanding their mechanisms of action. Vaccines based on mRNA lipid nanoparticles (LNPs) are now being widely considered against infectious diseases and cancer. Here, we used in vivo imaging approaches to compare the trafficking of two LNP formulations encapsulating mRNA following intramuscular administration: DLin-MC3-DMA (MC3) and the recently developed DOG-IM4. The mRNA formulated in DOG-IM4 LNPs persisted at the injection site, whereas mRNA formulated in MC3 LNPs rapidly migrated to the draining lymph nodes. Furthermore, MC3 LNPs induced the fastest increase in blood neutrophil counts after injection and greater inflammation, as shown by IL-1RA, IL-15, CCL-1, and IL-6 concentrations in nonhuman primate sera. These observations highlight the influence of the nature of the LNP on mRNA vaccine distribution and early immune responses.


Conflict of interest statement

K.L., V.P., M.R., J.H. and C.P. are Sanofi employees or were under contract with Sanofi at the time of the study and may hold shares and/or stock options in the company. The remaining authors declare no competing interests.

Figures

Fig. 1
Fig. 1. Kinetics of AF647-mRNA-HA within LNPs delivered by the i.m. route in vivo.
a Representative images of the injection site in mice at one (top) and seven (bottom) days post i.m. injection. b Representative IVIS images of the AF647 fluorescent signal in mice and c corresponding quantification of the total radiance efficiency ((ph/s)/(µW/cm²)) in the injected area at various time points following i.m. injection of PBS (black), the AF647 probe (light gray), or 5 µg of naked AF647-mRNA (dark gray) or AF647-mRNA in MC3 (orange) or DOG-IM4 (blue) LNPs (n = 8/group). MC3/mRNA and DOG-IM4/mRNA groups were compared to mRNA group over time using ANOVA multiple comparisons tests (**** two-tailed p < 0.0001). d Representative recordings of 3D transillumination fluorescence tomography acquired at 24 h. e In vivo quantification of the biodistribution of mRNA in MC3 and DOG-IM4 LNPs at the injection site and dLNs (popliteal and iliac) over seven days (n = 8/group). Data are presented as mean values ± SD.
Fig. 2
Fig. 2. Impact of the injection of LNP/mRNA on biological parameters.
Biological parameters were measured at D1, D2, and D7 post-injection (d.p.i.) with MC3/mRNA (orange), DOG-IM4/mRNA (blue), or naked mRNA (dark gray). Rectal temperature (a) was monitored over time after injection in each experimental group, as well as the absolute numbers of blood neutrophils (c) and monocytes (e). The lines show the mean of each experimental group, and the shaded areas represent the range. Comparison between groups of temperature (b), neutrophil (d) and monocytes (f) counts were performed at D1 after each injection. Serum concentrations of IL1-RA (g), IL-15 (h), CCL-2 (i), and IL-6 (j) were determined after the first injection of MC3/mRNA, DOG-IM4/mRNA, or naked mRNA. The temperature (b), neutrophil and monocyte counts (d, f), and serum concentrations (gj) at D1 were compared between the groups using non-parametric Mann-Whitney and Kruskal-Wallis tests (*two-tailed p < 0.05, **two-tailed p < 0.01). Data are presented as individual and mean values ± SD (n = 5 for MC3/mRNA, n = 5 for DOG-IM4/mRNA, n = 3 for naked mRNA).
Fig. 3
Fig. 3. In vivo imaging of mRNA and APCs in macaques.
a Identification of mRNA vaccine at injection sites and in dLNs by in vivo near-infrared fluorescence imaging at D1 post i.m. injection (exposure time: 100 ms). b Representative images captured by in vivo fibered confocal fluorescence microscopy (FCFM) at the injected sites (depth = 60 µm), with the mRNA signal in red, HLA-DR+ signal in green, and co-localized mRNA and HLA-DR signals in yellow. Scale bar = 20 µm. c Quantification of the fluorescent spots of mRNA and HLA-DR from 50 frames per imaging session randomly chosen from movies covering the zone of the injection following i.m. injection of LNP MC3/mRNA (orange), LNP DOG-IM4/mRNA (blue), or naked mRNA (dark gray). d Representative in vivo images obtained by the FCFM system showing mRNA+, HLA-DR+, and co-labeled mRNA+ and HLA-DR+ cells in axillary lymph nodes. e Quantification of the number of cells labeled for the mRNA vaccine and anti-HLA-DR from 50 frames per imaging session randomly chosen from movies covering the axillary dLN. The mean value is indicated by the horizontal bar. Experimental groups were compared using nonparametric Mann-Whitney and Kruskal-Wallis tests (**two-tailed p < 0.01, ****two-tailed p < 0.0001). f The percentage of co-localization was determined in mRNA positive frames and corresponded to the observation of co-labeling with HLA-DR at the injection site and in the dLNs. Images for the injection sites and dLNs were captured at one day post-injection (n = 10 for MC3/mRNA, n = 10 for DOG-IM4/mRNA, n = 6 for naked mRNA). Data are presented as violin plots with the quartile positions. The value shown above the violin plot indicates the number of sessions for which co-localization was observed out of all imaging sessions performed per group.
Fig. 4
Fig. 4. Local impact of LNP/mRNA at the injection site and in dLNs.
a Injection sites (muscle) of NHPs at D1 post-injection with naked mRNA or mRNA in MC3 or DOG-IM4 LNPs. The sections were stained for desmin (cyan), CD68/CD163, and CD66abce (magenta). Scale bar, 200 µm. b mRNA-HA distribution in LNs. Representative images of mRNA localization in LNs stained for HLA-DR (green), CD20 (yellow), and CD68/CD163 (magenta) and counterstained with DAPI (Blue). Scale bar, 50 µm. c Magnification of areas showing co-localization of mRNA (red) and HLA-DR cells (green) in the LNs of NHPs injected with naked mRNA or mRNA in MC3 or DOG-IM4 LNPs. Images were acquired using a Leica SP8 microscope with a 40X objective. Representative images are shown (n = 2).

References

    1. Pardi N, Hogan MJ, Porter FW, Weissman D. mRNA vaccines—a new era in vaccinology. Nat. Rev. Drug Discov. 2018;17:261–279. doi: 10.1038/nrd.2017.243. - DOI - PMC - PubMed
    1. Jackson LA, et al. An mRNA vaccine against SARS-CoV-2—preliminary report. N. Engl. J. Med. 2020;383:1920–1931. doi: 10.1056/NEJMoa2022483. - DOI - PMC - PubMed
    1. Baden LR, et al. Efficacy and Safety of the mRNA-1273 SARS-CoV-2 Vaccine. N. Engl. J. Med. 2021;384:403–416. doi: 10.1056/NEJMoa2035389. - DOI - PMC - PubMed
    1. Verbeke R, Lentacker I, De Smedt SC, Dewitte H. The dawn of mRNA vaccines: the COVID-19 case. J. Control Release. 2021;333:511–520. doi: 10.1016/j.jconrel.2021.03.043. - DOI - PMC - PubMed
    1. Buschmann, M. D. et al. Nanomaterial delivery systems for mRNA Vaccines. Vaccines9 (2021). - PMC - PubMed