. 2024 Jul;6(7):1380-1396.
doi: 10.1038/s42255-024-01063-2. Epub 2024 Jun 20.

Coordinated action of a gut-liver pathway drives alcohol detoxification and consumption

Affiliations

Coordinated action of a gut-liver pathway drives alcohol detoxification and consumption

Yaojie Fu et al. Nat Metab. 2024 Jul.

Abstract

Alcohol use disorder (AUD) affects millions of people worldwide, causing extensive morbidity and mortality with limited pharmacological treatments. The liver is considered as the principal site for the detoxification of ethanol metabolite, acetaldehyde (AcH), by aldehyde dehydrogenase 2 (ALDH2) and as a target for AUD treatment, however, our recent data indicate that the liver only plays a partial role in clearing systemic AcH. Here we show that a liver-gut axis, rather than liver alone, synergistically drives systemic AcH clearance and voluntary alcohol drinking. Mechanistically, we find that after ethanol intake, a substantial proportion of AcH generated in the liver is excreted via the bile into the gastrointestinal tract where AcH is further metabolized by gut ALDH2. Modulating bile flow significantly affects serum AcH level and drinking behaviour. Thus, combined targeting of liver and gut ALDH2, and manipulation of bile flow and secretion are potential therapeutic strategies to treat AUD.


Conflict of interest statement

Competing Interests Statement: All authors declare no competing interests.

Figures

Extended Data Fig. 1|
Extended Data Fig. 1|. Confirmation of ALDH2 deletion in various strains of single organ Aldh2 KO mice.
(a) To identify which organ(s) in addition to the liver controls blood AcH clearance, several lines of tissue-specific KO mice were generated and listed in the table. (b) Measurement of AcH levels in serum from Aldh2 f/f mice (n=6), Aldh2E2a−/− mice (n=5), and global Aldh2 KO mice (n=4) 3h post ethanol oral gavage (5g/Kg). (c) Western blot analysis or immunofluorescent staining was performed to confirm the deletion of ALDH2 in tissues (IF staining: upper left panel: smooth muscle tissue; upper right panel: liver tissue; lower left panel: blood vessels of heart tissue were shown) from various organ-specific Aldh2 KO mice listed in Table (a), representative of two independent experiments. Values represent means±SEM. Two-way ANOVA and two-sided Student’s t-test was performed for the comparison between indicated two groups. ns: No significance.
Extended Data Fig. 2
Extended Data Fig. 2. Drinking behavior in various strains of single organ Aldh2 KO mice.
(a-d). 2-bottle choice (2-BC) experiments were performed in endothelial cell (Male: n=8, n=10; Female: n=8, n=10) in Aldh2Tie2−/, (Male: n=9, n=7; Female: n=6, n=5) in Aldh2Tek2−/−, *P=0.0377, *P=0.0357), smooth muscle (n=8, n=9), and skeletal muscle (n=8, n=10) (*P=0.0321, *P=0.0345) specific Aldh2 KO mice. Sex of mice were indicated, “M” means “male” and “F” means “female”. Values represent means±SEM. *p<0.05. Two-way ANOVA and two-sided Student’s t-test was used for the comparison between indicated two groups.
Extended Data Fig. 3|
Extended Data Fig. 3|. Expression of ALDH2 protein in the gut, and liver injury in gut-specific Aldh2 KO mice post ethanol feeding.
(a) Western blot analysis was performed to determine the ALDH2 protein expression in liver and different segments of intestine tissues, including duodenum, mid small intestine, and terminal ileum (n=4 in each group) (**p=0.0021,**p=0.0078). (b) Representative immunofluorescence images showing expression of ALDH2 in liver and duodenum tissues from WT, Aldh2 Hep−/−, Aldh2 villin−/−, and Aldh2 Hep−/−Villin−/− mice. (c) Schematic of mouse model of chronic ethanol feeding plus acute binge (the NIAAA model) and its pair-fed control model (Created with Biorender.com). (d) Serum ALT (IU/L) (liver injury marker) measurements of chronic-plus-binge ethanol feeding mice (shown as ‘EtOH diet’) and pair-fed control mice (shown as ‘Paired diet’) of WT, Aldh2 Hep−/−, Aldh2 villin−/−, Aldh2 Hep−/−Villin−/− mice (n=4 in each paired fed group; n=13, n=12, n=8, n=7 in each EtOH-fed group), the results were from one experiment. Values represent means±SEM. **p<0.01. Two-sided Student’s t-test and one-way ANOVA were used for the comparison between two groups. ns: No significance.
Extended Data Fig. 4|
Extended Data Fig. 4|. Measurement of liver injury in liver and/or gut Aldh2 KO post chronic-plus-binge ethanol feeding.
(a) Representative images of hematoxylin-eosin (H&E) staining and IHC staining with anti-IBA1 (macrophage marker), anti-myeloperoxidase (MPO; neutrophil marker; positive cells were indicated with black arrows), Sirius red (fibrosis), and anti-OPN (bile duct marker) of liver sections from WT, Aldh2Hep−/−, Aldh2villin−/−, and Aldh2Hep−/−Villin−/− mice of chronic-plus-binge ethanol feeding model (n=5 in each group). (b) Quantification of IHC staining shown in panel (a) (count of positive cell or fold change of positive area/200×field) (n=5 in each group) (**p=0.0082, **p=0.0059, **p=0.0022, **p=0.0016). Values represent means±SEM. *p<0.05; **p<0.01. Two-sided Student’s t-test and one-way ANOVA were used for the comparison between indicated two groups.
Extended Data Fig. 5|
Extended Data Fig. 5|. Bile AcH levels are much higher than serum AcH after ethanol administration and effects of glutathione depletion on acetaldehyde disposition.
(a) Measurement of EtOH and AcH in serum and bile samples from C57BL/6N mice (n=5) by GC-MS 1h and 3h post i.p injection of ethanol (4g/Kg). Box plot with whiskers (min to max), line at median were shown in (a). Two-sided paired Student’s t-test was performed, **p=0.0028, **p=0.0015. (b) Bile volume/body weight ratios (shown as Bile/BW ratio) of C57BL/6N mice received PBS gavage or ethanol (shown as EtOH gavage; 5g/Kg) were determined 3h, 6h, and 9h post oral gavage (n=4 per group at each timepoint). (c) Schematic of potential AcH metabolite downstream of glutathione (GSH) and cysteinylglycine (CysGly). (d) Study timeline–male C57BL/6N mice (n=7/group) were administered buthionine sulfoximine (BSO, 4mmol/kg) or vehicle (control) 2.5h before 5g/kg EtOH gavage and mice were sacrificed 1h later. (e, f) Measurement of EtOH and AcH in serum, liver (n=7, n=7), and bile samples from C57BL/6N mice (n=4) by GC-MS (**p=0.0098). (g-i). Study timeline of male C57BL/6N mice (n=7/group) were administered BSO was shown in (g), and measurement of EtOH and AcH in serum, liver, and bile samples (n=7/group) were shown in (h) and (i). (d) and (g) were created with Biorender.com. Values represent means±SEM. Significance was evaluated via two-sided unpaired Student’s t-test (**p<0.01). ns: No significance.
Extended Data Fig. 6|
Extended Data Fig. 6|. No differences on ALDH2 protein levels between WT and GF mice.
(a) Western blot analysis of ALDH2 protein in liver tissues from WT and GF mice (n=6). (b) Bile volumes (Left panel) and the fold change of bile volume/body weight ratio (shown as Bile/BW ratio) from WT and GF mice post ethanol gavage (5g/Kg) were determined (n=7) (***p<0.0001). Values represent means±SEM. ***p<0.001. Two-sided Student’s t-test was used for the comparison between indicated two groups.
Extended Data Fig. 7|
Extended Data Fig. 7|. Manipulation of intrahepatic bile flow does not affect EtOH transportation.
(A) EtOH levels in liver tissue, serum, bile samples from BDL mice (n=5) and sham mice (n=5) 3h post ethanol (5g/kg) gavage. (b) EtOH levels in liver, serum, bile samples from Mdr2 KO mice (Mdr2−/−) (n=5) and control WT mice (n=5) 3h post ethanol (5g/kg) gavage. (c) EtOH levels in liver, serum, bile samples from Bsep KO mice (Bsep−/−) (n=6) and control WT mice (n=7) 3h post ethanol (5g/kg) gavage. (d) EtOH levels in liver tissue, serum, and bile samples from C57BL/6N mice fed with control diet (n=5) and Ursodeoxycholic acid (UDCA) diet (n=5) 3h post ethanol gavage (5g/Kg). (e-h) EtOH levels in liver, serum, and bile samples from C57BL/6N mice pre-treated with vehicle, or Cyclo-1 (n=3, n=4), Novobiocin (n=7, n=4), Quinidine (n=5, n=5) and Rifampicin (n=5, n=5), respectively, were measured 3h post ethanol gavage (5g/Kg) (n=3–6 each group) (*p=0.0159). Values represent means±SEM. Two-sided Student’s t-test was used for the comparison between indicated two groups. *p<0.05.
Extended Data Fig. 8|
Extended Data Fig. 8|. Expression and enzymatic activity of liver ALDH2 and DID in mice with various treatment or gene deletion.
(a, b) Liver tissues were obtained from bile duct ligated (BDL) (n=6), Mdr2−/− (n=6, **p=0.0082), Bsep−/− (n=5) or UDCA treated mice (n=6), and their corresponding control mice. Western blot analyses were performed to determine ALDH2 expression. (c) Comparison of ALDH2 enzymatic activity in fresh liver homogenates was performed in the mice mentioned above (n=6, n=6, n=5, n=6). (d, e) DID assay in female C57BL/6N mice fed with chow diet (n=10) or UDCA diet (n=9, *p=0.0464, *p=0.0301), in female Mdr2 KO mice (Mdr2−/−) (n=7, *p=0.0256, **p=0.0015) and their littermate control mice (WT) (n=8), and in male Bsep KO mice (Bsep−/−) (n=7, *p=0.0117, *p=0.0111) and their littermate control mice (WT) (n=7). Values represent means±SEM. Two-sided Student’s t-test was used for the comparison between indicated two groups. *p<0.05, **p<0.01
Extended Data Fig. 9|
Extended Data Fig. 9|. ALDH2 of liver-gut loop controls AcH clearance but does not affect EtOH concentration.
(a) AcH levels of cerebellar cortex, portal blood, bile and duodenal luminal content from four groups of mice were determined (female groups: n=8, n=8, n=8, n=7) (*p=0.0228,***p<0.0001,***p<0.0001,**p=0.0023,*p=0.0194,***p=0.0004,*p=0.0207, ***p<0.0001,***p<0.0001,**p=0.0043,***p=0.0009,***p<0.0001). (b) EtOH in cerebellar cortex, portal blood, bile and duodenal luminal content from four groups of mice were determined (male groups: n=9, n=8, n=9, n=11). (c) AcH levels from male WT and double KO mice treated with 2g/kg EtOH gavage (*p=0.0260, **p=0.0087, *p=0.0189, *p=0.0260) (The scheme was created with Biorender.com). (d) The correlation of serum and cerebellar AcH levels 3h post ethanol gavage (5g/Kg) (n=9, n=9, n=7, n=11). (e) Schematic of different brain regions collected for AcH measurement post EtOH gavage (Created with Biorender.com). (f) AcH levels of prefrontal cortex (PFC) (n=7, n=7), hippocampus (n=6, n=7), thalamus (TH) (n=6, n=6), and hypothalamus (HTH) (n=7, n=7) from WT (Aldh2 f/f) and Aldh2 Hep−/−Villin−/− mice in (e) were determined 3h post EtOH gavage (5g/Kg) (**p=0.0053, ***p=0.0004). *p<0.05, **p<0.01, ***p<0.001. Values represent means±SEM. Two-sided student’s t-test and one-way ANOVA were used for the comparison between two groups in panels a and b; Two-sided student’s t-test was used for panels c and f. Two-tailed simple linear regression was used to determine the correlation.
Extended Data Fig. 10|:
Extended Data Fig. 10|:. Liver and gut epithelium Aldh2 double knockout leads to significant inhibition of metabolic phenotypes after alcohol intake.
The following parameters of WT mice (Aldh2f/f), Aldh2Hep−/−, Aldh2Villin−/−, and Aldh2 Hep−/−Villin−/− mice (n=4/each group) were evaluated by using metabolic chambers after ethanol gavage (5g/Kg): (a) Respiratory quotient (**p=0.0077). (b) Carbohydrate oxidation (*p=0.0133). (c) Cumulative food intake. (d) Cumulative water intake. (e) Total energy expenditure. (f) Fat oxidation. (g) Oxygen consumption. (h) Ambulatory movements. Values represent means±SEM. A two-way ANOVA was performed for the comparisons among multiple groups, followed by two-sided Student’s t-test between WT mice and Aldh2 Hep−/−Villin−/− mice in (a) and (b) at the timepoint of 48h. No adjustments were made for multiple comparisons. *p<0.05, **p<0.01.
Fig. 1:
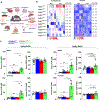
Fig. 1:. Liver and gut synergistically promote circulating acetaldehyde clearance via the ALDH2.
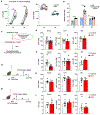
a, Generation of 10 lines of tissue/cell-specific Aldh2 knockout (KO) and E2a-Cre germline Aldh2 KO mice (Created with Biorender.com). b,Comparison of serum acetaldehyde (AcH) and ethanol (EtOH) levels of germline and specific single organ Aldh2 KO mice (Cre+ groups) with their littermate control (Flox groups) mice 3 hours after ethanol (5g/Kg) gavage (n=5 in each group; striped square stands for the missing sample). Fold change and p values were shown on the right. (**p=0.0079, **p=0.0079,*p=0.0317, *p=0.0159) c, Serum EtOH and AcH levels in male and female WT (Aldh2 f/f) mice (male: n=10, n=8; female: n=7, n=9), Aldh2 Hep−/− (male: n=9, n=9; female: n=8, n=8), Aldh2 villin−/− (male: n=9, n=7; female: n=9, n=7), and Aldh2 Hep−/−Villin−/− mice (male: n=7, n=8; female: n=8, n=7) 1 hour (dose: 2g/Kg) and 3 hours (dose: 5g/Kg) post ethanol gavage (upper left *p=0.0172,**p=0.0054,***p=0.0007; upper right *p=0.0477, ***p=0.0009, ***p=0.0002, *p=0.0468; lower left *p=0.0439, *p=0.0117,**p=0.0069; lower right: *p=0.0260, ***p=0.0009, **p=0.0011, *p=0.0117). Values represent means±SEM. *p<0.05, **p<0.01, ***p<0.001. Two-sided Student’s t-test and one-way ANOVA were used for the comparison between two groups. ns: No significance.
Fig. 2:
Fig. 2:. Bile flow is an important pathway for AcH clearance from liver into intestinal lumen.
a,Measurement of EtOH and AcH in serum and bile samples from male C57BL/6N mice (n=7) by GC-MS 1h and 3h post ethanol gavage (5g/Kg). Box plot with whiskers (min to max), line at median were shown in (a). Two-sided paired Student’s t-test was performed, **p=0.0019, **p=0.0011. b, Comparison of gallbladder volume in male C57BL/6N mice (n=6) 3h after PBS or ethanol (5g/Kg) gavage (***P=0.0009). c, Luminal AcH measurement in different segments of intestine from male C57BL/6N mice (n=6) by GC-MS 3h post ethanol gavage (5g/Kg) (***p<0.0001). d, A diagram of bile duct ligation (BDL) surgery (Left panel, Created with Biorender.com), and comparison of duodenal (Duo.) luminal AcH concentration after ethanol gavage (5g/Kg) between sham mice (n=5) and BDL mice (n=6) (Right panel, **P=0.0063). e, AcH levels in liver (n=5, n=6), bile (n=5, n=6) and duodenal luminal content (n=7, n=6), EtOH in bile(n=5, n=6) and duodenal (Duo.) luminal content (n=7, n=5) from male liver specific Aldh2 KO mice (Aldh2 Hep−/−) and male control mice (Aldh2 f/f) 3h post ethanol gavage (5g/Kg) (*P=0.03,*p=0.0124,**p=0.0092,*p=0.0269). Values represent means±SEM. *p<0.05, **p<0.01, ***p<0.001. Two-sided Student’s t-test and one-way ANOVA were used for the comparison between two groups. ns: No significance.
Fig. 3:
Fig. 3:. Gut microbiota play a minor role in gut luminal AcH clearance
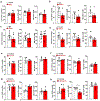
a, AcH and EtOH levels in gastrointestinal (GI) lumen, bile, liver, and serum from male germ-free (GF) (n=7) and specific pathogen free (SPF) (Control) (n=7) mice 3h post ethanol gavage (5g/kg) (*p=0.0306). b, C57BL/6N mice were treated with antibiotics cocktail to thoroughly eradicate the effects of gut microbiota (Diagram created with Biorender.com). EtOH and AcH levels in serum, bile and intestinal luminal content in control (n=6, n=5, n=5) and antibiotics-treated mice (n=5, n=5, n=5) 3h post ethanol gavage (5g/kg). c, A diagram for intra-intestinal AcH injection (20mM) in SPF (Control) and GF mice (Created with Biorender.com), and luminal and portal blood AcH levels were measured by GC-MS (n=6). The luminal content AcH levels presented in this figure represents the diluted concentrations (see details in methods). Values represent means±SEM. *p<0.05, Two-sided Student’s t-test was used for the comparison between indicated two groups.
Fig. 4:
Fig. 4:. Gut AcH is metabolized by gut ALDH2 with a small portion absorbed back and metabolized by the liver ALDH2
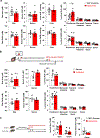
a, EtOH and AcH levels in duodenal luminal content, portal blood, and liver tissue from gut epithelium specific Aldh2 KO mice (Aldh2 Villin−/−) (n=6) and control mice (Aldh2 f/f) (n=4) 3h post ethanol gavage (5g/Kg) (**p=0.0047,***p=0.0009,*p=0.0311). b, A diagram of in vivo intra-intestinal AcH solution (20mM) injection in C57BL/6N mice (Created with Biorender.com). c, Portal blood (n=4, n=5) and duodenal luminal (n=6) AcH levels of Aldh2 Villin−/− and control mice (Aldh2 f/f) mice 5 min and 15 min post intra-intestinal AcH (20mM) injection (*p=0.0132, **p=0.0029, *p=0.0271, **p=0.0018). d, AcH levels in liver tissue (n=6, n=5) and bile (n=4, n=4) from liver specific Aldh2 KO mice (Aldh2 Hep−/−) and control mice (Aldh2 f/f) 15 min post intra-intestinal AcH (20mM) injection (*p=0.0131, *p=0.0361). The luminal content AcH levels presented in this figure represents the diluted concentrations (see details in methods). All male mice were used. Values represent means±SEM. *p<0.05, **p<0.01, ***p<0.001. Two-sided Student’s t-test was used for the comparison between indicated two groups. ns: No significance.
Fig. 5:
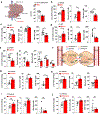
Fig. 5:. Bile flow controls systemic and liver AcH detoxification
a, A diagram of liver perfusion with ethanol (25% vol/vol) in male C57BL/6N mice (left panel), and the total amount of AcH in liver perfusate collected from portal vein and bile collected from common bile duct were determined by GC-MS measurement (right panel) (n=5), and the percentage was calculated and is shown. b, AcH levels in liver tissue, serum, and bile from sham male mice (n=5) and mice received bile duct ligation (BDL) (n=5) were measured 3h post ethanol gavage (5g/Kg) by GC-MS (***p=0.0008, **p=0.0041, **p=0.0020). c,d, AcH levels in liver tissue, serum, bile samples from male Bsep KO mice (Bsep−/−) (n=7, n=6), Mdr2 KO mice (Mdr2−/−) (n=5, n=6), and their littermate control mice (shown as ‘Wild type (WT)’) were measured 3h post ethanol gavage (5g/Kg) (c:*p=0.0168, *p=0.0174; d:*p=0.0303,*p=0.0348,*p=0.0182). e, AcH levels in liver tissue, serum, and bile samples at different time points (1h, 3h, and 6h) from male C57BL/6N mice fed with chow diet (n=5) and ursodeoxycholic acid (UDCA) diet (n=5) were measured 3h post ethanol gavage (5g/Kg) (*p=0.0187, *p=0.0134, *p=0.0129). f, A diagram of bile flow regulation by different inhibitors (Created with Biorender.com). g-j, AcH levels in liver tissue, serum, and bile samples from male C57BL/6N mice pre-treated with vehicle, or Cyclo-1 (n=3, n=4), Novobiocin (n=7, n=4), Quinidine (n=5, n=5) and Rifampicin (n=5, n=5), were measured 3h post ethanol gavage (5g/Kg) (g:*p=0.0411,**p=0.0048; h:*p=0.0377, *p=0.0350, **p=0.0029; i:*p=0.0132; j:**p=0.0020, *p=0.0167). Values represent means±SEM. *p<0.05, **p<0.01. Two-sided Student’s t-test was used for the comparison between indicated two groups. ns: No significance. Abbreviation in panel f: MRP: multidrug resistance-associated protein; ABCG2: adenosine triphosphate (ATP)-binding cassette efflux transporter G2; ABCB11: ATP binding cassette subfamily B member 11; MDR: multidrug resistance protein; BCRP: breast cancer resistance protein; BSEP: bile salt export pump.
Fig. 6:
Fig. 6:. Manipulating intrahepatic bile flow affects drinking behavior.
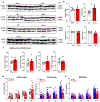
a, A diagram of drinking in the dark (DID) assay and two-bottle choice (2-BC) assay. D1-D4: day 1 to day 4 (Created with Biorender.com). b, DID assay in male C57BL/6N mice fed with chow diet (n=10) and UDCA diet (n=10) (*p=0.0332, *p=0.0190, *p=0.0370). c, 2-BC assay in male C57BL/6N mice fed with chow diet (n=10) and UDCA diet (n=10). Upper panel: alcohol intake curves and statistics for relative area under curve (AUC). Lower panel: alcohol preference (%) curve and statistics for relative AUC (***p<0.0001, ***p=0.0002, **p=0.0021, ***p=0.0002, * p=0.0117, ***p=0.0004, *p=0.0156, *p=0.0443, *p=0.0409). d, DID assay in male Mdr2 KO mice (Mdr2−/−) (n=10), and their littermate control mice (WT) (n=11) (*p=0.0205, **p=0.0036, *p=0.0383). e, 2-BC assay in male Mdr2−/− and WT mice (n=10). Upper panel: alcohol intake curves and its relative AUC. Lower panel: alcohol preference (%) curve and its relative AUC (upper: *p=0.0236, **p=0.0010, **p=0.0004, *p=0.0136, *p=0.0408, *p=0.0230, **p=0.0052, **p=0.0049, *p=0.0126). Values represent means±SEM. *p<0.05, **p<0.01, ***p<0.001. Two-way ANOVA and two-sided Student’s t-test were used for the comparison between indicated two groups. ns: No significance.
Fig. 7:
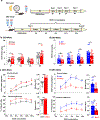
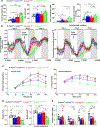
Fig. 7:. Gut and liver ALDH2 synergistically control blood acetaldehyde clearance and drinking behavior.
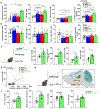
a, Male WT mice (Aldh2 f/f) (n=9), liver Aldh2 KO (Aldh2 Hep−/− ) (n=8), gut Aldh2 KO (Aldh2 Villin−/−) (n=9), and liver-gut Aldh2 dKO mice (Aldh2 Hep−/−Villin−/−) (n=11) received a single dose of ethanol gavage (5g/Kg). AcH levels in portal blood, bile, duodenal lumen, and cerebellar cortex tissues were measured 3h post gavage (Portal blood: **p=0.0044, *p= 0.0310, ***p<0.0001; Bile: *p=0.0347, *p=0.0295, *p=0.0185, ***p=0.0007; Duo. luminal: *p=0.0126, **p=0.0021, *p=0.0268, *p=0.0266; Cerebellar cortex: **p=0.0052, ***p<0.0001, *p=0.0498, **p=0.0020;). b, The above 4 groups of mice were placed in metabolic chambers for monitoring their respiratory quotient and carbohydrate oxidation (The statistical analysis is shown in Extended Data Fig. 10a). c,d, 2-BC assay in Aldh2 f/f (n=8), Aldh2 Hep−/−(n=8), Aldh2 Villin−/−(n=7), and Aldh2 Hep−/−Villin−/− mice (n=10) was performed. Alcohol preference curves are shown in panel c. Statistics of their relative area under curve (AUC) are shown in panel d (*p=0.0459, *p=0.0444, **p=0.0034, ***p=0.0002, **p=0.0050, *p=0.0123, ***p<0.0001, ***p=0.0009). e, DID assay in four groups of mice was performed (n=11, n=10, n=10, n=12) (D1: ***p<0.0001, **p=0.0025, **p=0.0059; D2: *p=0.0475; D3: *p=0.0208, *p=0.0291, ***p<0.0001, **p=0.0021, ***p=0.0002; D4: *p=0.0332, *p=0.0440, ***p=0.0004, **p=0.0059). Values represent means±SEM. *p<0.05, **p<0.01, ***p<0.001. Two-way ANOVA and two-sided Student’s t-test were used for the comparison between indicated two groups. ns: No significance.
Fig. 8:
Fig. 8:. The schematic for a liver-gut loop controlling alcohol detoxification and drinking behavior.
Alcohol is metabolized via ADH into AcH in hepatocytes. Approximately 70% secreted AcH from hepatocytes enters into circulation, while 30% secreted AcH is drained via the bile flow into duodenal lumen, where AcH is detoxified and cleared by gut epithelium ALDH2, while a small portion of AcH is resorbed back to liver for further metabolism by liver ALDH2. This ‘liver-gut ALDH2 loop’ promotes systemic AcH clearance, and more importantly, controls alcohol preference and drinking behavior. Targeting liver-gut ALDH2 loop may represent a novel therapeutic approach for AUD. (Created with Biorender.com).

References

    1. Cederbaum AI Alcohol metabolism. Clin Liver Dis 16, 667–685 (2012). - PMC - PubMed
    1. Goedde HW, et al. Distribution of ADH2 and ALDH2 genotypes in different populations. Human Genetics 88, 344–346 (1992). - PubMed
    1. Yoshida A, Huang IY & Ikawa M Molecular abnormality of an inactive aldehyde dehydrogenase variant commonly found in Orientals. Proceedings of the National Academy of Sciences 81, 258–261 (1984). - PMC - PubMed
    1. Lai C-L, et al. Dominance of the Inactive Asian Variant Over Activity and Protein Contents of Mitochondrial Aldehyde Dehydrogenase 2 in Human Liver. Alcohol: Clinical and Experimental Research 38, 44–50 (2014). - PubMed
    1. Higuchi S, et al. Aldehyde dehydrogenase genotypes In Japanese alcoholics. The Lancet 343, 741–742 (1994). - PubMed

LinkOut - more resources