. 2024 Aug;21(8):873-891.
doi: 10.1038/s41423-024-01187-1. Epub 2024 Jun 20.

Exportin 1 governs the immunosuppressive functions of myeloid-derived suppressor cells in tumors through ERK1/2 nuclear export

Affiliations

Exportin 1 governs the immunosuppressive functions of myeloid-derived suppressor cells in tumors through ERK1/2 nuclear export

Saeed Daneshmandi et al. Cell Mol Immunol. 2024 Aug.

Abstract

Myeloid-derived suppressor cells (MDSCs) are a main driver of immunosuppression in tumors. Understanding the mechanisms that determine the development and immunosuppressive function of these cells could provide new therapeutic targets to improve antitumor immunity. Here, using preclinical murine models, we discovered that exportin 1 (XPO1) expression is upregulated in tumor MDSCs and that this upregulation is induced by IL-6-induced STAT3 activation during MDSC differentiation. XPO1 blockade transforms MDSCs into T-cell-activating neutrophil-like cells, enhancing the antitumor immune response and restraining tumor growth. Mechanistically, XPO1 inhibition leads to the nuclear entrapment of ERK1/2, resulting in the prevention of ERK1/2 phosphorylation following the IL-6-mediated activation of the MAPK signaling pathway. Similarly, XPO1 blockade in human MDSCs induces the formation of neutrophil-like cells with immunostimulatory functions. Therefore, our findings revealed a critical role for XPO1 in MDSC differentiation and suppressive functions; exploiting these new discoveries revealed new targets for reprogramming immunosuppressive MDSCs to improve cancer therapeutic responses.

Keywords: Exportin 1; MAPK pathway; MDSCs; Tumor.


Conflict of interest statement

Advisory Board/Consulting for P.L.M.: BlueBird Biotech, Bristol-Myers Squibb, Celgene, Fate Therapeutics, Janssen, Juno, Karyopharm, Magenta Therapeutics, Sanofi, and Takeda. Honoraria for P.L.M.: BlueBird Biotech, Bristol-Myers Squibb, Celgene, Fate Therapeutics, Janssen, Juno, Karyopharm, Magenta Therapeutics, Sanofi, and Takeda. Employment for Y.L.: Karyopharm.

Figures

Fig. 1
Fig. 1
XPO1 expression increases in tumor MDSCs and is mediated by STAT3 signaling. A, B EL-4 tumor cells (1×10⁶) were intravenously injected into murine recipients. At 14 days after the tumor cell injection, MDSCs (CD11b+Gr1+) were sorted from the bone marrow (BM) of EL-4 tumor-bearing or tumor-free mice using a SONY sorter and cocultured with CFSE-labeled T cells activated with anti-CD3 and anti-CD28 monoclonal antibodies (mAbs) for 72 h. T-cell proliferation was examined using flow cytometry. Nonactivated T cells (negative) and T cells activated with anti-CD3 and anti-CD28 mAbs (positive) served as controls. Histograms (A) and quantitative (B) results are representative of two independent replicates. In each replicate, the BM from 3 to 5 mice was pooled before sorting. One-way ANOVA was used to analyze the statistical significance of differences among groups. C The expression of XPO1 in CD11b+Gr1+ BM-MDSCs isolated from EL-4 tumor-bearing or tumor-free control mice (as explained in A) was assessed via western blotting. Actin served as the control. The results are representative of two independent repeats. D, E The expression of XPO1 in CD11b+Gr1+ BM-MDSCs was confirmed by confocal microscopy. BM-CD11b+Gr1+ cells were isolated from EL-4 tumor-bearing or tumor-free control mice (explained in A). E The average XPO1 fluorescence intensity is summarized in the bar graph. Student’s t test was used to analyze the statistical significance of differences between the 2 groups. F CD11b+Gr1+ MDSCs were generated in vitro using granulocyte-macrophage colony-stimulating factor (GM-CSF) and interleukin-6 (IL-6) (40 ng/mL each) for 4 days, and Xpo1 mRNA expression levels were examined daily using real-time PCR to understand the mechanisms regulating XPO1 expression. The results are representative of three independent repeats. One-way ANOVA was used to analyze the statistical significance of differences among groups. G Fresh BM cells were treated with IL-6 (40 ng/mL), and the levels of STAT3 phosphorylation at pSTAT3-Tyr705 and pSTAT3-Ser727 were examined using western blotting to confirm STAT3 activation by IL-6. The B16F10 cell line was used as a positive western blot control. The results are representative of three independent experiments. H ChIP‒qPCR showed that pSTAT3 binds to the XPO1 promoter at two of the 4 potential binding sites (from a total of 9 sites matching the consensus sequences generated by the UCSC Genome Browser on Mouse (GRCm39/mm39) program) after IL-6 stimulation for 30 min. A mAb against histone H3 (H3) served as a positive control, and the IgG isotype control served as a negative control. The results are representative of three independent experiments. I BM cells were treated with IL-6 (40 ng/mL) for 24 h in the presence of a STAT3 inhibitor (cucurbitacin I (JSI-124); 1 µM in DMSO) or the control DMSO to show that STAT3 activation results in XPO1 expression. Xpo1 expression was evaluated using real-time PCR. The results are representative of three independent repeats. The data are shown as the means ± SEMs. p < 0.05; ∗∗∗p < 0.001, and ∗∗∗∗p < 0.0001
Fig. 2
Fig. 2
Blockade of XPO1 overcomes MDSC-mediated T-cell dysfunction and enhances immunotherapy efficacy. Survival of C57BL/6 mice inoculated with EL-4 lymphoma cells (1 × 106 cells per mouse) (A, B) or C1498 (1 × 106 cells per mouse) acute myeloid leukemia cells (C) followed by three days of treatment with selinexor or vehicle (oral gavage) (selinexor-treated mice (STM): 5 mg/kg, twice weekly or 10 mg/kg, once weekly; vehicle-treated mice (VTM): on a twice weekly schedule). The mice in (B) were treated with 200 μg of anti-Ly6C or isotype control monoclonal antibody (mAb) (i.p.; twice weekly). The results are representative of three experiments; n  =  5 mice per group. For the comparison of survival curves, a log-rank (Mantel‒Cox) test was used. D, E Tumor growth quantified by bioluminescent signals after the inoculation of C1498- luciferase+ cells (1 × 106 cells per mouse) followed three days later by selinexor (oral gavage) (STM; 5 mg/kg; twice weekly or 10 mg/kg; weekly) or vehicle (VTM; twice weekly) treatment. Representative bioluminescent images of C1498-Luc+ cells are shown in (D). The results are representative of two experiments; n  =  5 mice per group (E). Two-way ANOVA was used to analyze the statistical significance of differences in tumor growth among the different groups. F, G The frequency of bone marrow (BM) CD11b+Gr1+ cells was determined using flow cytometry on Day 14 post-EL-4 tumor cell inoculation (i.v.) and 11 days after selinexor (STM; 5 mg/kg; oral gavage; twice weekly) or vehicle (VTM; twice weekly) treatment. The results are shown as a pool of two independent experiments with n = 5 samples per group in each repeat. Student’s t test was used to analyze the statistical significance of differences between 2 groups. CD11b+Gr1+ BM-MDSCs were sorted from EL-4 tumor-bearing mice treated with selinexor (STM; 5 mg/kg; oral gavage; twice weekly) or vehicle (VTM; twice weekly) on Day 14 after tumor inoculation and cocultured with anti-CD3/anti-CD28-activated T cells (CFSE-labeled). The suppressive effects of the isolated CD11b+Gr1+ cells on CD4+ (H) and CD8+ (I) T cells were evaluated at 72 h. Unsimulated T cells served as negative controls, and T cells stimulated with anti-CD3 or anti-CD28 alone served as positive controls (data not shown). The data are representative of three independent experiments with reproducible results. Student’s t test was used to analyze the statistical significance of differences between 2 groups. J C1498-luciferase+ tumor-bearing mice were treated with selinexor (STM; 5 mg/kg; oral gavage; twice weekly) or vehicle (VTM; twice weekly) with or without 200 μg of anti-Ly6C (i.p.; twice weekly) to confirm the role of myeloid cells in tumor growth during XPO1 blockade by selinexor. The tumor burden was measured by quantifying bioluminescent signals. n = 5 mice per group from two independent experiments. Two-way ANOVA was used to analyze the statistical significance of differences in tumor growth among the different groups. Tumor growth in C57BL/6 mice inoculated with C1498-luciferase+ cells and treated as described in (J) with or without 200 μg of anti-CD8 (K) or anti-PD-1 (L) mAbs (both i.p.; twice weekly). The tumor burden was measured by quantifying bioluminescent signals. n = 5 mice per group from two independent experiments. Two-way ANOVA was used to analyze the statistical significance of differences in tumor growth among the different groups. The data are shown as the means ± SEMs. p < 0.05, ∗∗p < 0.01, and ∗∗∗p < 0.001
Fig. 3
Fig. 3
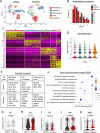
XPO1 blockade during MDSC differentiation induces a unique transcriptomic profile in MDSC subpopulations. MDSCs were generated in vitro using IL-6 (40 ng/ml) and GM-CSF (40 ng/ml) for 4 days in the presence of selinexor (50 nM) or vehicle (DMSO), and their transcriptomic profiles were evaluated by performing single-cell RNA sequencing (scRNA-seq). tSNE plots (A) showing the distribution of MDSC subpopulations in the vehicle- and selinexor-treated groups. The frequencies of different cell subpopulations are shown in (B). The Ly6g and Ly6c1 genes were used to annotate the PMN-MDSC and M-MDSC populations, respectively. C Heatmap summarizing the genes most strongly correlated with each MDSC subpopulation. Gene expression is color coded with a scale based on the z score distribution from −2 (purple) to 2 (yellow). D The distribution of Xpo1 expression in MDSC subpopulations is shown as a violin plot. E The most highly expressed genes encoding signaling/enzyme proteins, cell membrane markers, and transcription factors differed significantly between vehicle- and selinexor-treated MDSCs. Genes are ranked by p value. P < 0.05 was considered to indicate statistical significance. F Selected gene set enrichment analysis (GSEA) results based on the REACTOME (R) and KEGG (K) databases are shown for the ratio of selinexor- to vehicle-treated cells. The percentage of genes showing an increase or decrease in expression is presented as the percentage of leading-edge genes. The circle range represents the significance threshold. Gene expression levels of Sell (G), Lst1 (H), Ccl3 (I), Ngp (J), and Mki67 (K) associated with the MDSC activation status in vehicle- and selinexor-treated MDSCs
Fig. 4
Fig. 4
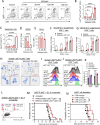
Selinexor treatment induces the generation of neutrophil-like myeloid cells with potent tumor-controlling functions. A, B MDSCs were generated in vitro using IL-6 (40 ng/ml) and GM-CSF (40 ng/ml) for 4 days in the presence of increasing concentrations of selinexor (25-300 nM) or vehicle (DMSO). Differentiation into CD11b+Ly6ChiLy6G- (M-MDSC) or CD11b+Ly6CintLy6G+ (PMN-MDSC) cells was determined using flow cytometry (A). Representative flow cytometry images indicating a shift in differentiation from CD11b+Ly6ChiLy6G- cells toward CD11b+Ly6CintLy6G+ cells with increasing Selinexor concentrations (B). The shift in differentiation from CD11b+Ly6ChiLy6G- cells toward CD11b+Ly6CintLy6G+ cells was calculated as the PMN-MDSC/M-MDSC ratio. The results are representative of 5 independent experiments with three replicates each. One-way ANOVA was used to analyze the statistical significance of differences among groups. C Selinexor induces apoptosis in CD11b+Gr1+ MDSCs at high concentrations. MDSCs were generated as described in A, and the percentage of apoptotic CD11b+Gr1+ MDSCs was measured by performing Annexin V staining (apoptotic cells: Aqua+ Annexin V+). The results are representative of three independent experiments with three replicates each. One-way ANOVA was used to analyze the statistical significance of differences among groups. D, E XPO1 blockade decreases the immunosuppressive function of CD11b+Gr1+ MDSCs. MDSCs were generated as described in (A). The expression levels of iNOS2 (D) and PD-L1 (E) in CD11b+Gr1+ cells were examined using flow cytometry. The results are representative of three independent experiments with three replicates each. One-way ANOVA was used to analyze the statistical significance of differences among groups. MDSCs were generated as described in A and cocultured with anti-CD3/anti-CD28 mAb-stimulated T cells (CFSE-labeled). After 72 h., the proliferation of CD4+ (F) and CD8+ (G) T cells was assessed using flow cytometry. Unsimulated T cells served as a negative control, and T cells stimulated with anti-CD3 and anti-CD28 mAbs alone served as positive controls (data not shown). The results are representative of two independent experiments with three replicates each. Student’s t test was used to analyze the statistical significance of differences between 2 groups at each dilution. H MDSCs were generated as described in A, and Ly6CintLy6G+ cells were sorted with a SONY sorter, followed by a morphological assessment of Ly6CintLy6G+ cells. Cytospins of Ly6CintLy6G+ cells stained with Diff-Quik Staining are shown. The stained cells had blue nuclei and a light blue (or pink) cytoplasm. Original magnification = X20. IK MDSCs were differentiated as described in A, and Ly6CintLy6G+ cells were sorted using flow cytometry. The sorted cells were cocultured with anti-CD3/anti-CD28 mAb-stimulated T cells (CFSE-labeled) at a Ly6CintLy6G+ to T-cell ratio of 1:2. After 72 h., the proliferation of CD4+ (I, K) and CD8+ (J, K) T cells was examined using flow cytometry. Unsimulated T cells (negative) and T cells stimulated with anti-CD3 and anti-CD28 mAbs (positive) alone served as controls. The results are representative of two independent experiments with three replicates each. Student’s t test was used to analyze the statistical significance of differences between 2 groups at each dilution. The antitumor effect of selinexor-treated Ly6CintLy6G+ cells was assessed in vivo. Ly6CintLy6G+ cells were sorted from differentiated cells as described in (A), mixed at a 1:1 ratio with EL-4 tumor cells, intravenously injected into C57BL/6 mice as shown in the schematic diagram (L), and monitored for survival (M). The results are representative of two experiments of n  =  5 mice per group. For the comparison of survival curves, a log-rank (Mantel‒Cox) test was used. N EL-4 tumor-bearing mice were treated with selinexor (selinexor-treated mice (STM): 5 mg/kg, twice weekly) or vehicle (vehicle-treated mice (VTM)) followed by 200 μg of anti-Ly6G depleting mab or isotype control twice weekly (i.p.). The probability of survival was determined with a Kaplan‒Meier survival plot (N). n = 10 mice per group from two independent experiments. Data are shown as the means ± SEMs. p < 0.05, ∗∗p < 0.01, ∗∗∗p < 0.001, and ∗∗∗∗p < 0.0001
Fig. 5
Fig. 5
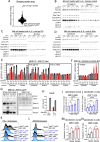
Selinexor suppresses the ERK1/2-mediated MAPK pathway in MDSCs. A MDSCs were generated from bone marrow (BM) cells in vitro using IL-6 (40 ng/ml) and GM-CSF (40 ng/ml) for 4 days in the presence of selinexor (50 nM) or vehicle. Phosphoproteomic analysis of 1318 signaling target proteins was performed with a Phospho Explorer Antibody Array (Full Moon BioSystem), which revealed elevated pRaf1 (Ser296) and decreased pGab1 (Tyr627) and pSHP2 (Tyr542) levels in MDSCs in response to treatment with selinexor/vehicle. BM cells were treated with selinexor (50 nM) or vehicle for 30 min in the presence of the isotype control (B), anti-IL-6Rα (C) or anti-gp130 (D) antibody and then exposed to IL-6 (40 ng/ml) for up to 6 h. Nuclear and cytoplasmic fractions were separated from the treated cells (according to “Methods” section), and key IL-6 signaling pathway molecules were analyzed at 0, 0.5, 2, and 6 h. timepoints (BD). The ERK1/2 phosphorylation level in the cytoplasmic and nuclear fractions was calculated as the pERK1/2:ERK1/2 ratio (E). Note: Cytoplasmic fractions collected at 2–6 h. In (B) and the nuclear fractions collected at 2–6 h. In (C, D) were analyzed separately in parallel blots. The results are representative of 3 independent experiments. F The total ERK1/2:vinculin ratio in the cytoplasmic fraction and the ERK1/2:Lamin A/C ratio in the nuclear fraction (from BD) were calculated, and the results indicated the entrapment of ERK1/2 in the nucleus after selinexor treatment. The results are representative of 3 independent experiments. G, H MDSCs were generated from BM in vitro using IL-6 (40 ng/ml) and GM-CSF (40 ng/ml) for 4 days. Differentiated cells were harvested and exposed to new IL-6 (40 ng/ml) or PBS (control) for 6 h. Then, the binding level of ERK1/2-XPO1 was detected by coimmunoprecipitation (Co-IP) using an anti-ERK1/2 antibody. Co-IP products were examined using western blotting (G), and colocalization was calculated as the XPO1/ERK1/2 ratio (H). The results are representative of 2 independent experiments. I, J MDSCs were generated from BM in vitro using IL-6 (40 ng/ml) and GM-CSF (40 ng/ml) for 4 days in the presence of increasing concentrations (1–500 nM) of the ERK1/2 inhibitor (SCH 772984). Harvested CD11b+Gr1+ cells were cocultured with anti-CD3/anti-CD28-activated T cells at a 1:8 ratio for 72 h. CD4+ (I) and CD8+ (J) T-cell proliferation was measured by CFSE dilution. The results are representative of 3 independent experiments. The expression of PD-L1 (K) and iNOS2 (L) within the Ly6ChiLy6G- and Ly6CintLy6G+ subpopulations. MDSCs were derived from BM as described in (I, J) and treated with 100 nM ERK1/2 inhibitor (SCH 772984). The results are representative of 3 independent experiments. (M-N) MDSCs were generated as described in (I, J) with the addition of 100 nM ERK1/2 inhibitor (SCH772984). On Day 4, the differentiated CD11b+Gr1+ cells were cocultured with anti-CD3/anti-CD28-activated T cells at a 1:8 ratio. CD4+ (M) and CD8+ (N) T-cell proliferation was evaluated after 72 h. The results are representative of 3 independent experiments. Student’s t test was used to analyze the statistical significance between 2 groups for each dilution. The data are shown as the means ± SEMs. p < 0.05, ∗∗p < 0.01, and ∗∗∗∗p < 0.0001
Fig. 6
Fig. 6
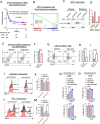
XPO1 expression, neutrophil-related gene expression signature and overall survival of acute myeloid leukemia patients; XPO1 blockade decreases the immunosuppressive function of human myeloid suppressor cells by inducing the generation of neutrophil-like cells. A, B Kaplan‒Meier estimates of overall survival in the AML patient dataset (GEO-GSE37642). The impact of XPO1 expression in AML patient samples. p values were calculated using the log-rank test controlled by cohort. A Patients were divided into low- and high-median XPO1 expression groups. B Gene set enrichment analysis of neutrophil-related gene expression signatures comparing patients with high and low XPO1 expression. FDR ˂ 0.25 was considered significant. C, D Human myeloid suppressor cells were generated from human peripheral blood mononuclear cells (PBMCs) in vitro using IL-6 (40 ng/ml) and GM-CSF (40 ng/ml) in the presence of selinexor (50 nM) or vehicle (DMSO). On Day 6, live CD11b+CD33+CD14-CD15+ (neutrophil-like) cells were sorted using a SONY sorter. XPO1 expression in the nucleus and cytoplasm was examined by performing western blot analysis (C). The average intensity of XPO1 expression in the blots is summarized in (D). Student’s t test was used to analyze the statistical significance of differences between 2 groups. EH Analysis of human myeloid suppressor cells by flow cytometry after culturing PBMCs with IL-6 and GM-CSF in the presence of selinexor (50 nM) or vehicle (DMSO) for 6 days. The cells were examined for CD11b+CD33+ (myeloid cells) E, F CD11b+CD33+CD14+CD15- (monocytic-MDSCs) (G, H), and CD11b+CD33+CD14-CD15+ (neutrophil-like) (G, I) markers. Student’s t test was used to analyze the statistical significance of differences between 2 groups. J, K The expression of arginase-I after culturing PBMCs with IL-6 and GM-CSF in the presence of selinexor (50 nM) or vehicle (DMSO) for 6 days. Arginase I expression was examined in CD11b+CD33+CD14+CD15- (monocytic-MDSCs) and CD11b+CD33+CD14+CD15+ (neutrophil-like myeloid) cells. Student’s t test was used to analyze the statistical significance of differences between 2 groups. L, M The expression of PD-L1 on CD11b+CD33+CD14+CD15- (monocytic-MDSC) and CD11b+CD33+CD14-CD15+ (neutrophil-like) cells after culturing PBMCs with IL-6 and GM-CSF in the presence of selinexor (50 nM) or vehicle (DMSO) for 6 days. Student’s t test was used to analyze the statistical significance of differences between 2 groups. N, O Human PBMCs were cultured with IL-6 and GM-CSF in the presence of selinexor (50 nM) or vehicle (DMSO) for 6 days. CD11b+CD33+CD14+CD15- (monocytic-MDSC) and CD11b+CD33+CD14-CD15+ (neutrophil-like) cells were sorted using a SONY sorter and cocultured with anti-CD3/anti-CD28 mAb-stimulated CSFE-labeled allogenic T cells for 72 h. T-cell proliferation was evaluated using flow cytometry. Student’s t test was used to analyze the statistical significance between 2 groups for each dilution. The data are shown as the means ± SEMs. p < 0.05, ∗∗∗p < 0.001, and ∗∗∗∗p < 0.0001

References

    1. Singhal S, Bhojnagarwala PS, O’Brien S, Moon EK, Garfall AL, Rao AS, et al. Origin and role of a subset of tumor-associated neutrophils with antigen-presenting cell features in early-stage human lung cancer. Cancer Cell. 2016;30:120–35. - PMC - PubMed
    1. Veglia F, Sanseviero E, Gabrilovich DI. Myeloid-derived suppressor cells in the era of increasing myeloid cell diversity. Nat Rev Immunol. 2021;21:485–98. - PMC - PubMed
    1. Ostrand-Rosenberg S, Fenselau C. Myeloid-derived suppressor cells: immune-suppressive cells that impair antitumor immunity and are sculpted by their environment. J Immunol. 2018;200:422–31. - PMC - PubMed
    1. Bronte V, Brandau S, Chen SH, Colombo MP, Frey AB, Greten TF, et al. Recommendations for myeloid-derived suppressor cell nomenclature and characterization standards. Nat Commun. 2016;7:12150. - PMC - PubMed
    1. Rodriguez PC, Ernstoff MS, Hernandez C, Atkins M, Zabaleta J, Sierra R, et al. Arginase I-producing myeloid-derived suppressor cells in renal cell carcinoma are a subpopulation of activated granulocytes. Cancer Res. 2009;69:1553–60. - PMC - PubMed

MeSH terms

LinkOut - more resources