. 2024 Jun 20;7(1):749.
doi: 10.1038/s42003-024-06224-3.

Common dietary emulsifiers promote metabolic disorders and intestinal microbiota dysbiosis in mice

Affiliations

Common dietary emulsifiers promote metabolic disorders and intestinal microbiota dysbiosis in mice

Suraphan Panyod et al. Commun Biol. .

Abstract

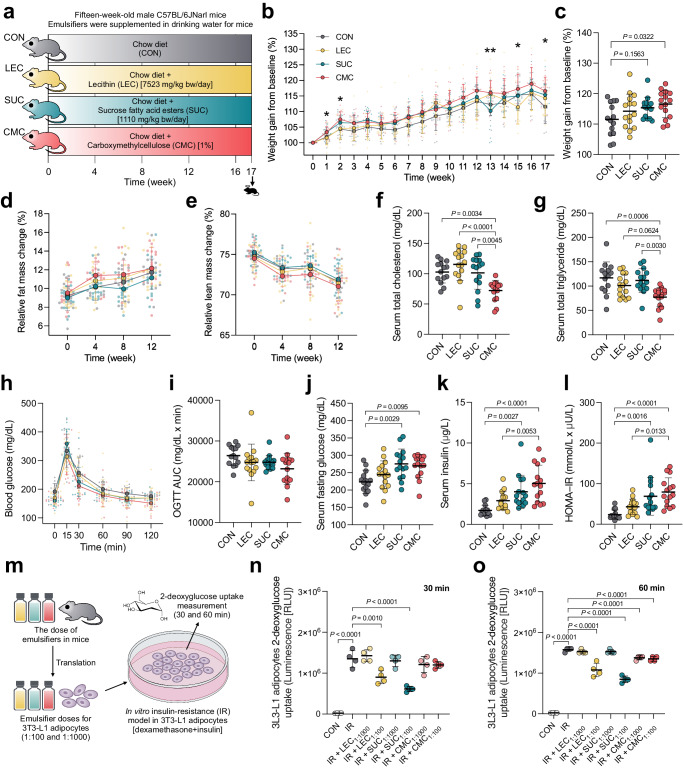
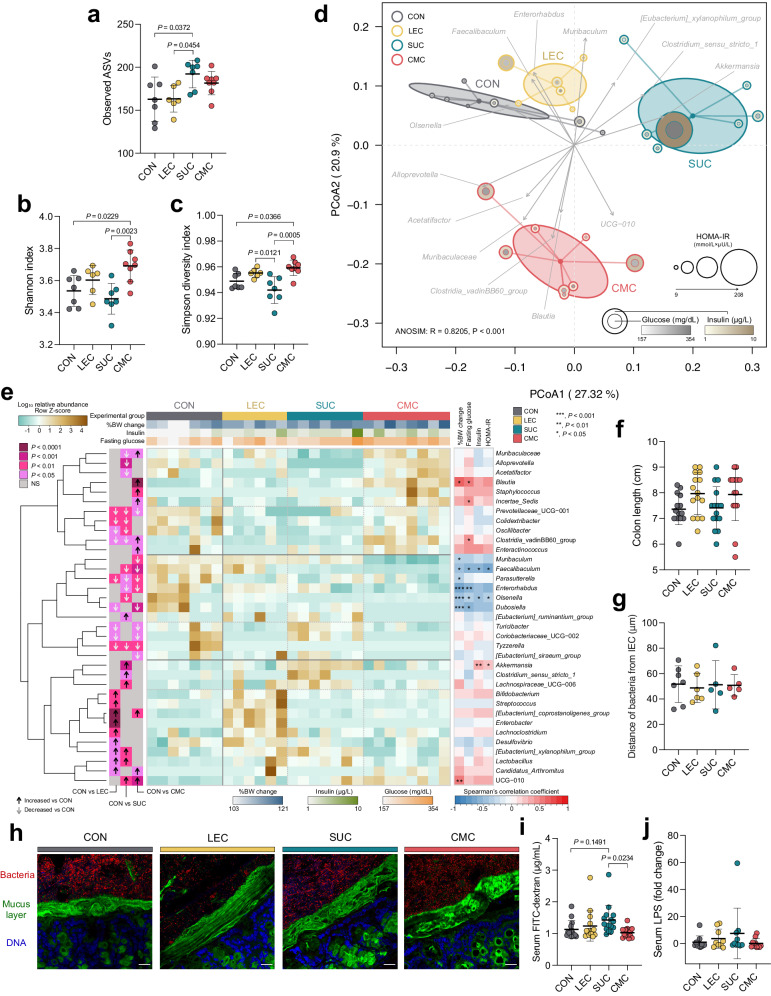
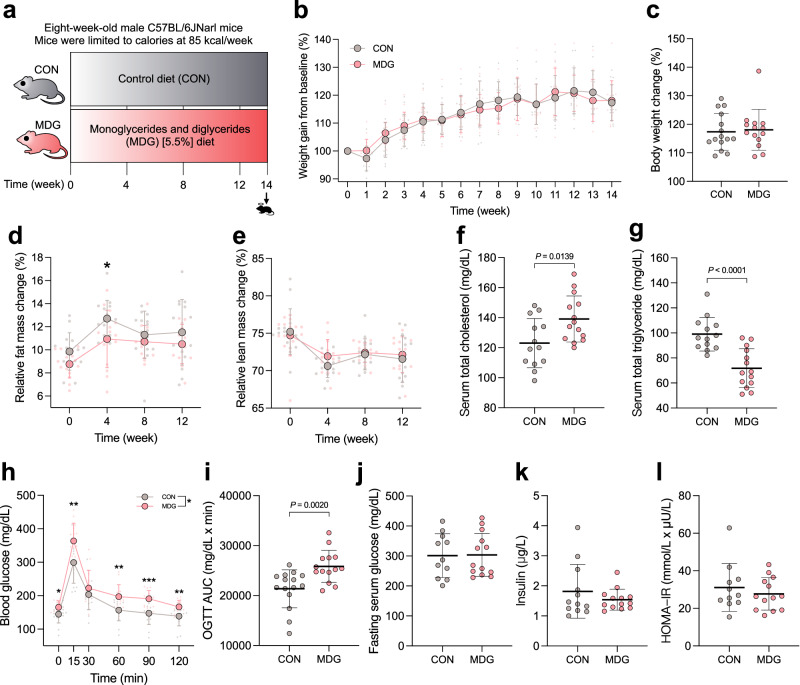
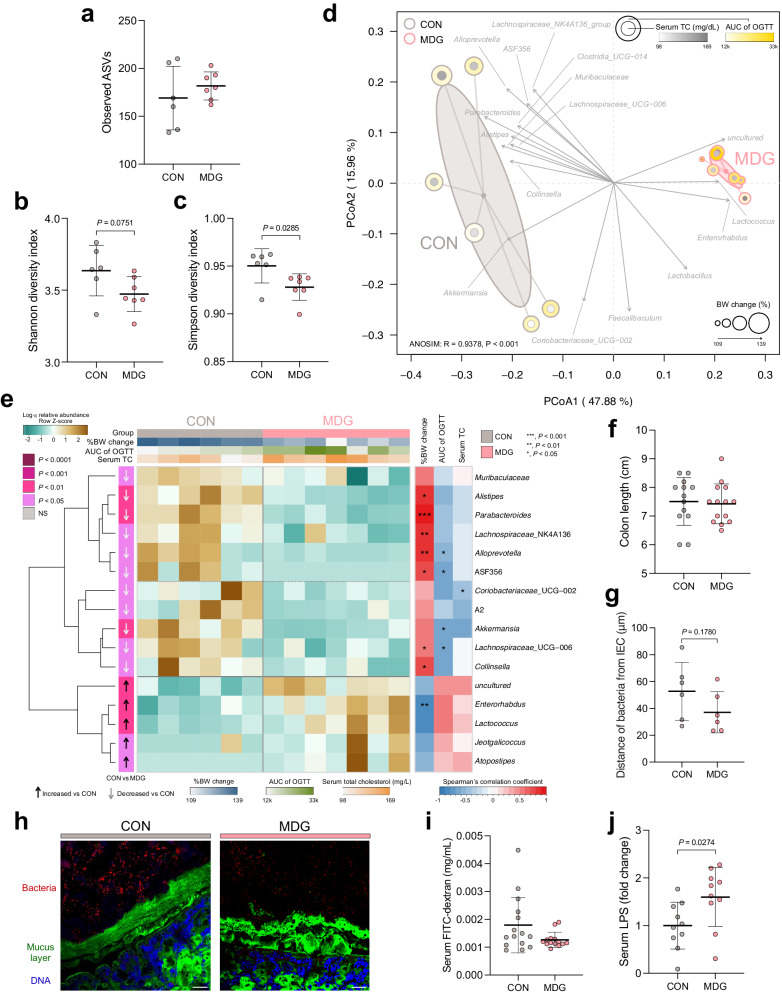
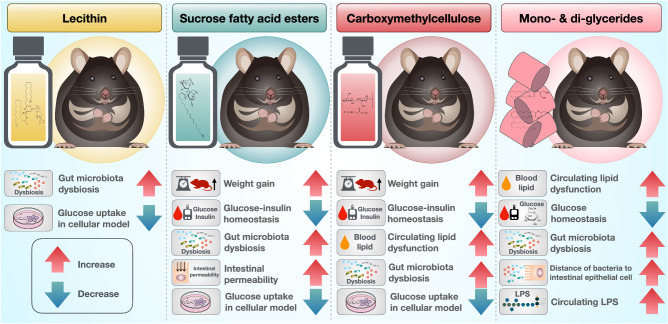
Dietary emulsifiers are linked to various diseases. The recent discovery of the role of gut microbiota-host interactions on health and disease warrants the safety reassessment of dietary emulsifiers through the lens of gut microbiota. Lecithin, sucrose fatty acid esters, carboxymethylcellulose (CMC), and mono- and diglycerides (MDG) emulsifiers are common dietary emulsifiers with high exposure levels in the population. This study demonstrates that sucrose fatty acid esters and carboxymethylcellulose induce hyperglycemia and hyperinsulinemia in a mouse model. Lecithin, sucrose fatty acid esters, and CMC disrupt glucose homeostasis in the in vitro insulin-resistance model. MDG impairs circulating lipid and glucose metabolism. All emulsifiers change the intestinal microbiota diversity and induce gut microbiota dysbiosis. Lecithin, sucrose fatty acid esters, and CMC do not impact mucus-bacterial interactions, whereas MDG tends to cause bacterial encroachment into the inner mucus layer and enhance inflammation potential by raising circulating lipopolysaccharide. Our findings demonstrate the safety concerns associated with using dietary emulsifiers, suggesting that they could lead to metabolic syndromes.


Conflict of interest statement

The authors declare no competing interests.

Figures

Fig. 1
Fig. 1. Dietary emulsifiers, including sucrose fatty acid esters and CMC, had an adverse effect on obesogenic and metabolic biomarkers, inducing insulin resistance in vivo and in vitro.
a Animal experimental design, (b) changes in weight gain, (c) changes in weight gain at 17th week, (d) changes in relative fat mass, (e) changes in relative lean mass, (f) serum total cholesterol levels, (g) total triglyceride levels, (h) oral glucose tolerance test (OGTT) curve, (i) area under the curve (AUC) of OGTT, (j) serum fasting glucose levels, (k) serum insulin levels, and (l) homeostatic model assessment for insulin resistance (HOMA-IR), (m) experimental design of in vitro cellular insulin-resistance (IR) model in 3T3-L1 adipocytes, (n) 3T3-L1 adipocytes 2-deoxyglucose uptake at 30 min, and (o) 60 min. Mice were supplemented with or without different emulsifiers in drinking water for 17 weeks. Dot plots are expressed as the mean ± s.d. (n = 14–15 per group). Insulin resistance (IR) was induced in 3T3-L1 adipocytes using dexamethasone for 72 h. Emulsifiers, including LEC at concentrations of 0.2 mg/mL (1:1000) and 2 mg/mL (1:100), SUC at concentrations of 0.03 mg/mL (1:1000) and 0.3 mg/mL (1:100), and CMC at concentrations of 0.1 mg/mL (1:1000) and 1 mg/mL (1:100), were also introduced into the experimental setup. Statistical analyses were performed using one-way ANOVA with Tukey’s range test for comparisons shown as exact P values. *, P < 0.05 and **, P < 0.01 (CON v.s. CMC group). The 2-deoxyglucose uptake data were analyzed using one-way ANOVA with Dunnett’s multiple comparisons test, comparing against the IR group. CON control group, LEC lecithin group, SUC sucrose fatty acid esters group, CMC carboxymethylcellulose group. Illustrations in (a, m) were created with Keynote.
Fig. 2
Fig. 2. Dietary emulsifiers lecithin, sucrose fatty acid esters, and CMC transformed gut microbiota diversity indices, adversely affecting the gut microbiota, but did not disrupt mucus–bacterial interactions or promote gut inflammation-associated diseases.
a Observed amplicon sequence variances (ASVs), (b) Shannon index, (c) Simpson diversity index, (d) principal coordinate analysis (PCoA) plot based on Bray–Curtis dissimilarity with gut microbiome-associated vector (envfit {vegan}), (e) heatmap of the relative abundances of cecal microbiota with significant differences determined using the Kruskal–Wallis test (P < 0.05) and with Spearman’s correlation coefficient analysis between gut microbiome genera and obesogenic and metabolic biomarkers, (f) colon length, (g) distances of closest bacteria to intestinal epithelial cells (IECs), (h) representative image of localization of bacteria using fluorescent in situ hybridization, (i) serum FITC-dextran concentration, and (j) serum lipopolysaccharide (LPS) levels. Mice were supplemented with or without different emulsifiers in drinking water for 17 weeks. Dot plots represent the mean ± s.d. (n = 5–8/group). Statistical analyses were performed using one-way ANOVA with the Tukey’s range test for comparisons shown as exact P values. Analysis of similarity (ANOSIM) was used to analyze the heterogeneity of the cecal microbiota among the groups in PCoA. Vectors in the PCoA plot show a significant genus (P < 0.01), and its length indicates the strength of the correlation. Pairwise statistical analyses were performed using an unpaired Wilcoxon signed-rank test shown as heatmap (CON vs. LEC; CON vs. SUC; and CON vs. CMC). Confocal microscopy analysis of microbiota localization: mucus layer, green; bacteria, red; and DNA, blue. Scale bar, 25 μm. CON control group, LEC lecithin group, SUC sucrose fatty acid esters group, CMC, carboxymethylcellulose group.
Fig. 3
Fig. 3. Dietary emulsifier mono- and diglycerides impaired circulating lipid and glucose metabolism.
a Animal experimental design, (b) changes in weight gain, (c) changes in weight gain at the 14th week, (d) changes in relative fat mass, (e) changes in relative lean mass, (f) serum total cholesterol levels, (g) total triglyceride levels, (h) oral glucose tolerance test (OGTT) curve, (i) area under the curve (AUC) of OGTT, (j) serum fasting glucose levels, (k) serum insulin levels, and (l) homeostatic model assessment for insulin resistance (HOMA-IR). Mice were fed control or MDG diet for 14 weeks. Dot plots are expressed as the mean ± s.d. (n = 14–15 per group). Statistical analyses were performed using an unpaired two-tailed Student’s t-test for comparisons (CON vs. MDG) and shown as exact P values or symbols (*, P < 0.05). CON control group, MDG monoglycerides and diglycerides group. Illustrations in (a) were created with Keynote.
Fig. 4
Fig. 4. Dietary emulsifier mono- and diglycerides modified the gut microbiome diversity, causing gut microbiota dysbiosis, decreased the distance of bacteria to epithelial cells, and potentially enhanced inflammation by increasing circulating LPS levels.
a Observed amplicon sequence variances (ASVs), (b) Shannon index, (c) Simpson diversity index, (d) principal coordinate analysis (PCoA) plot based on Bray–Curtis dissimilarity with gut microbiome-associated vector (envfit {vegan}), (e) heatmap of the relative abundances of cecal microbiota with significant differences measured using an unpaired Wilcoxon signed-rank test (P < 0.05) and with Spearman’s correlation analysis between gut microbiota genera and obesogenic and metabolic biomarkers, (f) colon length, (g) distances of closest bacteria to intestinal epithelial cells (IECs), (h) representative image of the localization of bacteria using fluorescent in situ hybridization, (i) serum FITC-dextran concentration, and (j) serum lipopolysaccharides (LPS) levels. Mice were fed control or MDG diet for 14 weeks. Dot plots represent the mean ± s.d. (n = 6–7/group). Statistical analyses were performed using an unpaired two-tailed Student’s t-test (CON vs. MDG), and the exact P value is shown. Analysis of similarity (ANOSIM) was used to analyze the heterogeneity of the cecal microbiome among the groups in PCoA. Vectors in the PCoA plot represented a significant genus (P < 0.05), and its length indicated the strength of the correlation. Confocal microscopy analysis of microbiota localization: mucus layer, green; bacteria, red; and DNA, blue. Scale bar, 25 μm. CON control group, MDG monoglycerides and diglycerides group.
Fig. 5
Fig. 5. Dietary emulsifiers promote metabolic disorders and induce intestinal microbiota dysbiosis.
The study revealed that dietary emulsifiers lecithin, sucrose fatty acid esters, and carboxymethylcellulose (CMC) were found to disturb glucose-insulin homeostasis, while mono- and diglycerides (MDG) disrupted blood lipid levels and glucose homeostasis. Additionally, these emulsifiers caused imbalances in the gut microbiota. Notably, MDG further exacerbated the increase in gut-derived LPS levels in the bloodstream. These findings provide insights into the risks linked to the consumption of dietary emulsifiers through the lens of gut microbiota, and may prompt a reevaluation of existing food safety policies and regulations governing food production. Illustrations in this figure were created with Keynote.

References

    1. Hills RD, Jr., et al. Gut microbiome: profound implications for diet and disease. Nutrients. 2019;11:1613. doi: 10.3390/nu11071613. - DOI - PMC - PubMed
    1. Panyod S, et al. Modulation of gut microbiota by foods and herbs to prevent cardiovascular diseases. J. Tradit. Complement. Med. 2023;13:107–118. doi: 10.1016/j.jtcme.2021.09.006. - DOI - PMC - PubMed
    1. Vijay A, Valdes AM. Role of the gut microbiome in chronic diseases: a narrative review. Eur. J. Clin. Nutr. 2022;76:489–501. doi: 10.1038/s41430-021-00991-6. - DOI - PMC - PubMed
    1. Johansson MEV, et al. The inner of the two Muc2 mucin-dependent mucus layers in colon is devoid of bacteria. Proc. Natl Acad. Sci. USA. 2008;105:15064–15069. doi: 10.1073/pnas.0803124105. - DOI - PMC - PubMed
    1. Glover JS, Ticer TD, Engevik MA. Characterizing the mucin-degrading capacity of the human gut microbiota. Sci. Rep. 2022;12:8456. doi: 10.1038/s41598-022-11819-z. - DOI - PMC - PubMed

Publication types