. 2024 Jun 20;14(1):14193.
doi: 10.1038/s41598-024-65076-3.

Abundant extrasynaptic expression of α3β4-containing nicotinic acetylcholine receptors in the medial habenula-interpeduncular nucleus pathway in mice

Affiliations

Abundant extrasynaptic expression of α3β4-containing nicotinic acetylcholine receptors in the medial habenula-interpeduncular nucleus pathway in mice

Asuka Tsuzuki et al. Sci Rep. .

Abstract

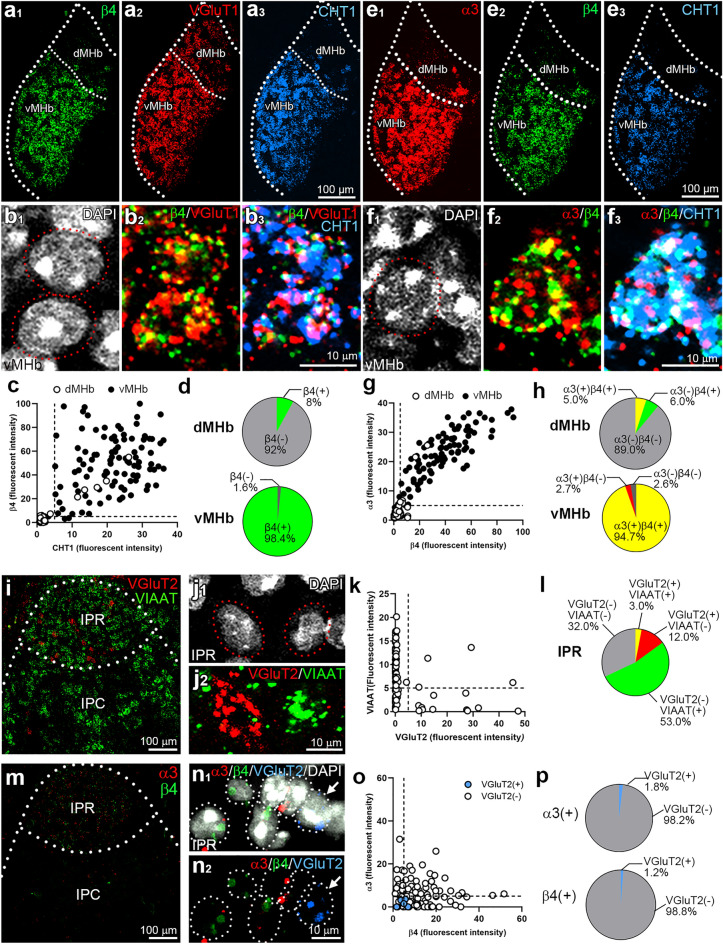
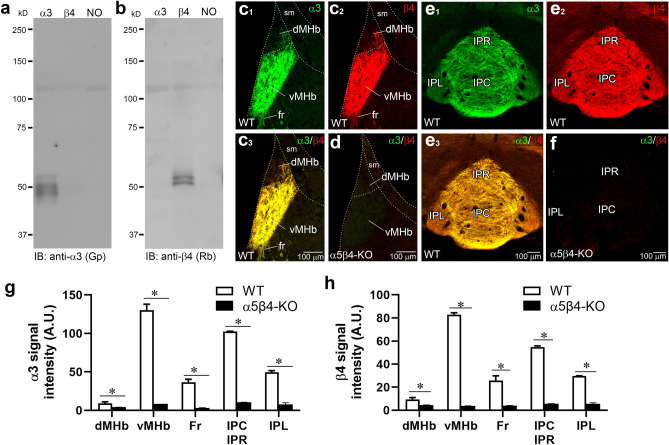
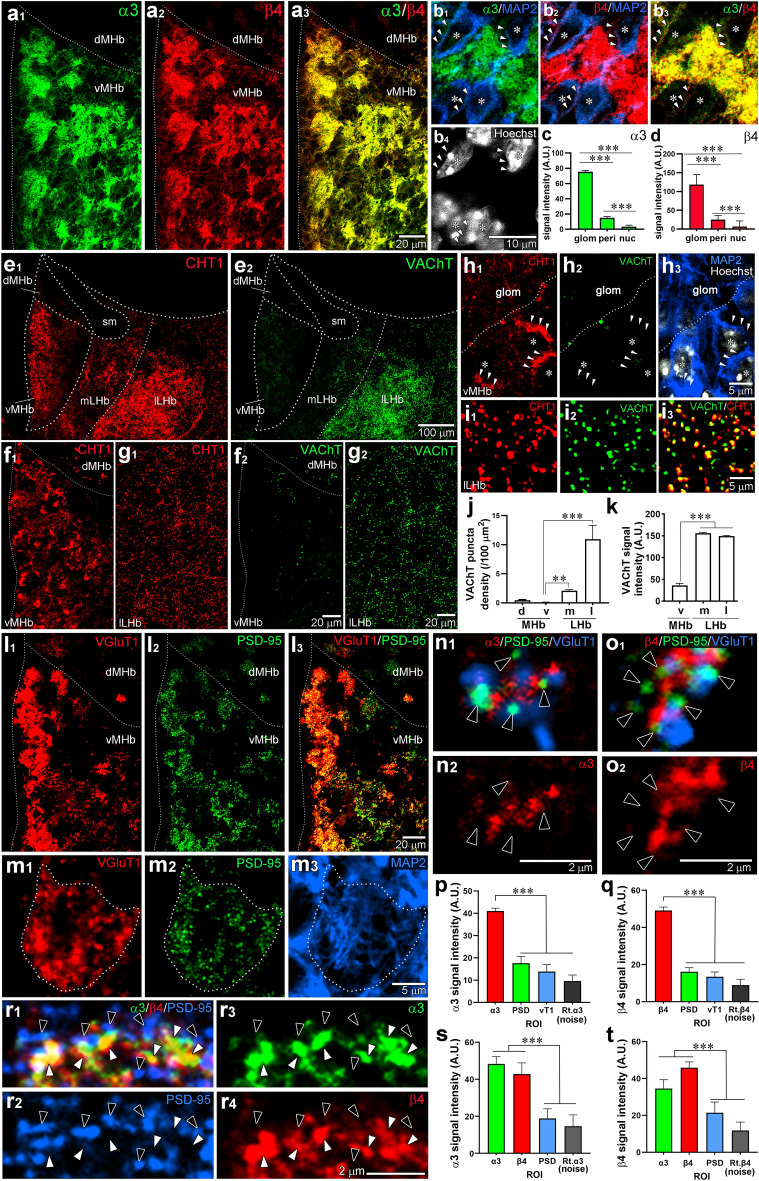
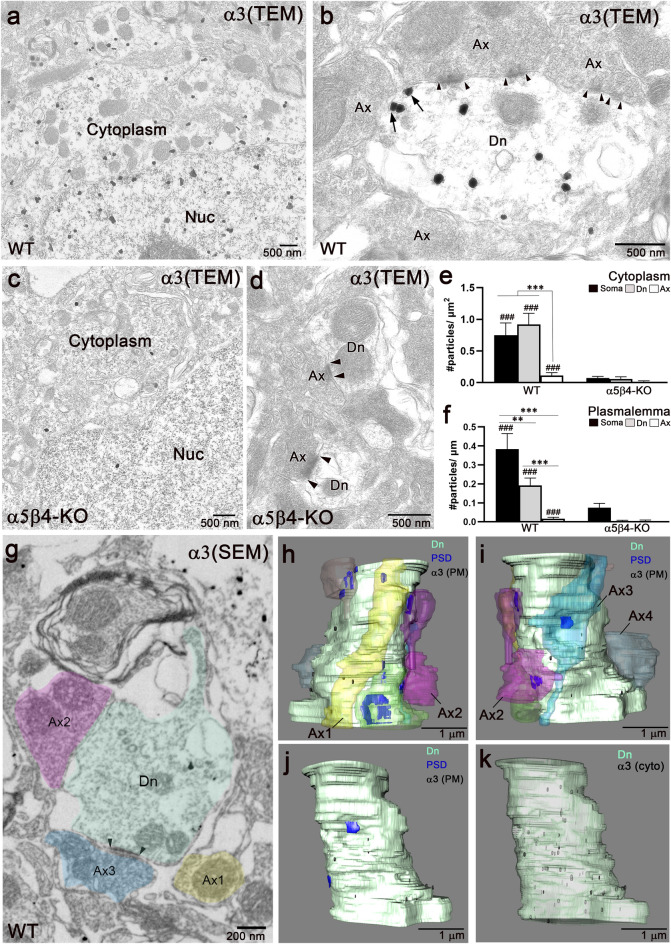
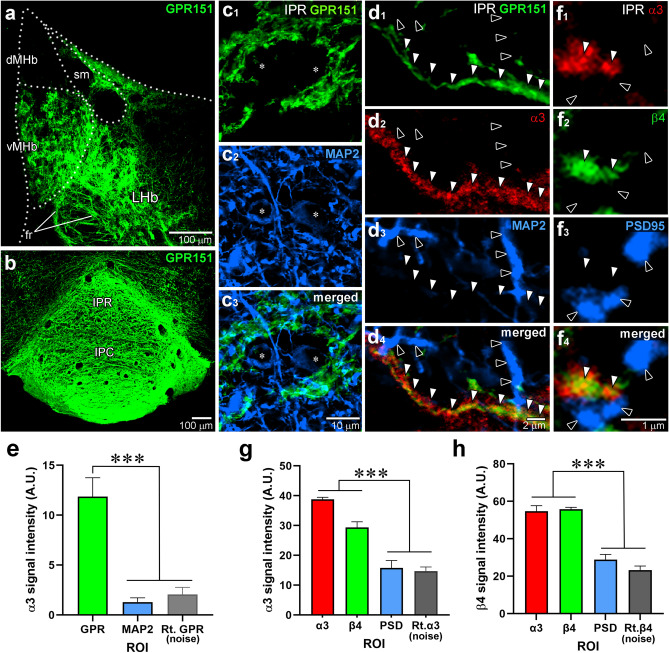
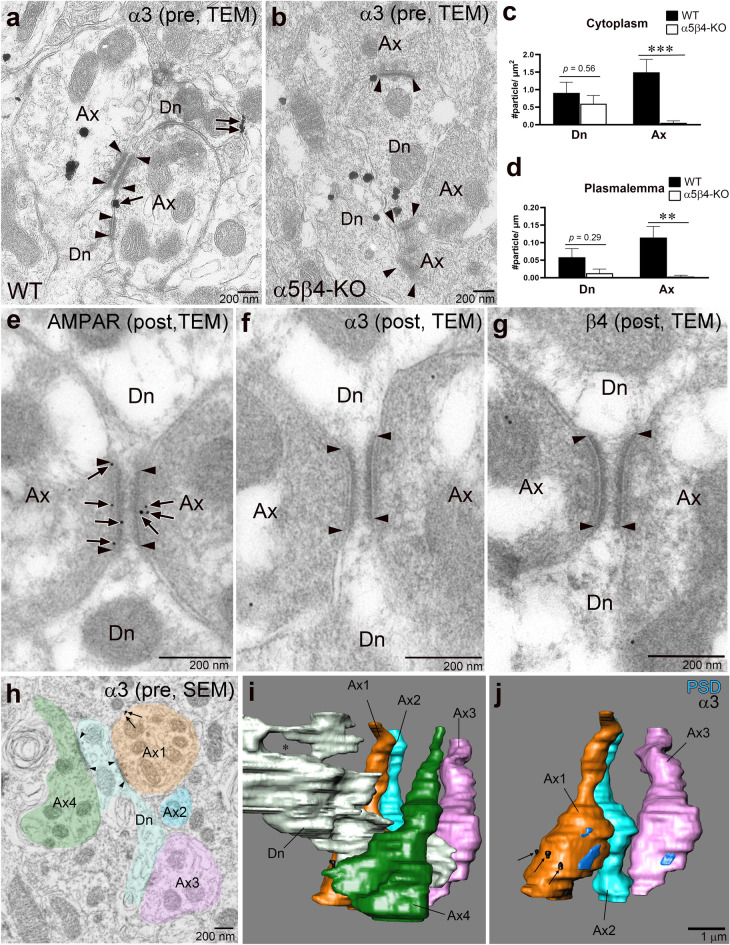
Nicotinic acetylcholine receptors (nAChRs) in the medial habenula (MHb)-interpeduncular nucleus (IPN) pathway play critical roles in nicotine-related behaviors. This pathway is particularly enriched in nAChR α3 and β4 subunits, both of which are genetically linked to nicotine dependence. However, the cellular and subcellular expression of endogenous α3β4-containing nAChRs remains largely unknown because specific antibodies and appropriate detection methods were unavailable. Here, we successfully uncovered the expression of endogenous nAChRs containing α3 and β4 subunits in the MHb-IPN pathway using novel specific antibodies and a fixative glyoxal that enables simultaneous detection of synaptic and extrasynaptic molecules. Immunofluorescence and immunoelectron microscopy revealed that both subunits were predominantly localized to the extrasynaptic cell surface of somatodendritic and axonal compartments of MHb neurons but not at their synaptic junctions. Immunolabeling for α3 and β4 subunits disappeared in α5β4-knockout brains, which we used as negative controls. The enriched and diffuse extrasynaptic expression along the MHb-IPN pathway suggests that α3β4-containing nAChRs may enhance the excitability of MHb neurons and neurotransmitter release from their presynaptic terminals in the IPN. The revealed distribution pattern provides a molecular and anatomical basis for understanding the functional role of α3β4-containing nAChRs in the crucial pathway of nicotine dependence.


Conflict of interest statement

The authors declare no competing interests.

Figures

Figure 1
Figure 1
Chromogenic in situ hybridization for α3 and β4 mRNAs. Coronal brain sections hybridized with antisense riboprobes for α3 (a, b, e, f, i, j) and β4 (c, d, g, h, k, l). An inset in (c) shows a negative control using the β4 sense probe. (a–d) Sections through the medial habenula (MHb). (a) and (c) are enlarged in (b) and (d), respectively. Note that intense signals are mostly confined to the ventral MHb (vMHb), below a red dotted line. (eh) Sections through the interpeduncular nucleus (IPN). (e) and (g) are enlarged in (f) and (h), respectively. Note that weak signals are confined to the IPR (circled with a red dotted line). (i, k) Sections through the triangular septal nucleus (TS). (j, l) Sections through the medial septal nucleus (MS). The approximate distance from the Bregma is indicated at the top. (m) Bar graphs showing the relative intensities of α3 and β4 mRNA signals in respective nuclei and cortical areas. After converting color images to grayscale, the relative intensities of α3 and β4 mRNA were calculated from the measured gray levels (in arbitrary units, A.U.) and the areas in specified nuclei or regions. These values were then normalized to the intensity in layer II/III of the primary somatosensory cortex (S1), indicated by a dashed line. n = 3 sections (from 3 mice). Data are presented as mean ± SEM. Other abbreviations: Cx, cerebral cortex; dMHb, dorsal MHb; Hi, hippocampus; IPC, central subnucleus of the IPN; IPL, lateral subnucleus of the IPN; IPR, rostral subnucleus of the IPN; Pir, piriform cortex; SC, superior colliculus; Str, striatum; Th, thalamus.
Figure 2
Figure 2
Fluorescent in situ hybridization for α3 and β4 subunit mRNAs with neurochemical markers in the MHb and IPN. (a) Triple fluorescent in situ hybridization (FISH) for β4 (green), VGluT1 (red), and CHT1 (blue) in the MHb (Bregma − 1.79 mm). (b) Higher magnification images show DAPI-stained individual cells (b1, circled with a red dotted line) co-express β4, VGluT1, and CHT1 (b2, b3). (c) A scatterplot of average fluorescent intensities for CHT1 (abscissa) vs. β4 (ordinate) in individual VGluT1-positive cells. Cells from the vMHb are represented by filled dots (n = 100 cells/2 sections/2 mice), and those from the dMHb are represented by open dots (n = 100 cells/2 sections/2 mice). (d) The composition of dMHb (top) and vMHb (bottom) cells, calculated from (c). (e) Triple FISH for α3 (red), β4 (green) and CHT1 (blue) in the MHb. (f) A DAPI-stained cell in the vMHb (f1, circled with a red dotted line) co-expresses α3, β4, and CHT1 (f2, f3). (g) A scatterplot of average fluorescent intensities for β4 (abscissa) vs. α3 (ordinate) in the MHb. Cells from the vMHb are represented by black circles (n = 150 cells/2 sections/2mice), and those from the dMHb are represented by open circles (n = 100 cells/2 sections/2 mice). (h) The composition of dMHb (top) and vMHb (bottom) cells, calculated from (g). (i, j2) Double FISH for VGluT2 (red) and VIAAT (green) in the IPN (Bregma -3.5 mm). (j1) DAPI-stained individual IPR cells (circled with red dotted lines). (k) A scatterplot of average fluorescent intensities for VGluT2 (abscissa) vs. VIAAT (ordinate) in the IPR cells (n = 100 cells/2 sections/2 mice). (l) The composition of IPR neurons expressing VGluT2 and/or VIAAT. (m) Double FISH for α3 (red), and β4 (green) in the IPN. (n) Triple FISH for α3 (red), β4 (green), and VGluT2 (blue) and DAPI-staining (white). White dotted lines delineate individual IPR cells. (o) A scatterplot of average fluorescent intensities for β4 (abscissa) vs. α3 (ordinate) in the IPR cells. Individual VGluT2-positive cells are represented by blue circles (n = 7 cells/2 sections/2 mice), and -negative cells (n = 103 cells/2 sections /2 mice) are presented by open circles. (p) The composition of α3 (top) and β4 (bottom) expressing cells calculated from (o).
Figure 3
Figure 3
Specificity of α3 and β4 antibodies. (a, b) Characterization of α3 and β4 antibodies by immunoblot (IB) experiments. Protein samples from Xenopus oocytes injected with corresponding cRNA (1 ng) were separated by 7.5% SDS-PAGE. Original blots are presented in Supplementary Fig. S1. (c, d) Double immunofluorescence for α3 (green) and β4 (red) in coronal sections through the MHb (Bregma -1.43 mm) in WT (c) and α5β4-KO (d). In the WT MHb, note the intense labeling in the vMHb and moderate labeling in the fasciculus retroflexus (fr), which projects to the IPN. (e, f) Double immunofluorescence for α3 (green) and β4 (red) in the WT (e) and α5β4-KO IPN (Bregma -3.5 mm) (f). In the WT IPN, intense labeling is observed in the rostral and central subnuclei (IPR and IPC), with relatively weak labeling in the lateral subnucleus (IPL). (g, h) Bar graphs comparing the signal intensities, measured in arbitrary gray units (A.U.), of α3 (g) and β4 (h) immunofluorescent signals in respective nuclei and cortical areas from WT and α5β4-KO mice. n = 6 sections/3 WT and 3 KO mice. The signal intensities in WT and α5β4-KO mice, obtained under identical image acquisition settings, are presented as mean ± SEM. *p < 0.05, Mann–Whitney U-test. sm, stria medullaris.
Figure 4
Figure 4
Non-synaptic colocalization of α3 and β4 in the MHb glomerulus. (a) Double immunofluorescence for α3 (green) and β4 (red) in the MHb. (b) Triple immunofluorescence for α3 (green), β4 (red), and MAP2 (blue) with Hoechst nuclear staining (b4, white, asterisk). Arrowheads indicate the perikaryon. (c, d) Bar graphs comparing the immunofluorescent signals of α3 (c) and β4 (d) in the glomerulus (glom), perikaryon (peri), and nucleus (nuc). (e, f) Separate channel images of double immunofluorescence for CHT1 (e1, f1, g1, red) and VAChT (e2, f2, g2, green) in the MHb, medial LHb (mLHb) and lateral LHb (lLHb). (h) Separate channel images of triple immunofluorescence for CHT1 (red), VAChT (green), and MAP2 (blue) with Hoechst (white) in the vMHb. The perikaryon and nucleus are indicated by arrowheads and an asterisk, respectively. (i) Double immunofluorescence for CHT1 (red) and VAChT (green) in the lLHb. (j, k) Bar graphs comparing the densities (j) and intensities (k) of VAChT-positive puncta in the MHb and LHb. (l) Double immunofluorescence for VGluT1 (red) and PSD-95 (green). (m) Separate channel images of triple immunofluorescence for VGluT1 (red), PSD-95 (green), and MAP2 (blue) showing the glomerulus (circled with a dotted line) in the vMHb. (n, o) Triple immunofluorescence for α3 (n, red) or β4 (o, red) with PSD-95 (green), and VGluT1 (blue) in the vMHb. Black arrowheads indicate PSD-95 labeling. (p, q) Bar graphs comparing the α3 or β4 signal intensities in the region of interest (ROI), determined by α3 or β4, PSD95, and VGluT1 labeling. (r) Triple immunofluorescence for α3 (green), β4 (red), and PSD-95 (blue) in the vMHb. Black arrowheads indicate PSD-95 labeling, and white arrowheads indicate α3 and β4 co-localization. (s, t) Bar graphs comparing the α3 or β4 signal intensities in the ROI, determined by α3, β4, and PSD-95 labeling. The noise level in (p), (q), (s), and (t) was determined using a designated ROI and images from channels rotated 90° (Rt.). ***p < 0.001, **p < 0.01, Kruskal–Wallis test and Dunn’s multiple comparison test. Additional information on the number of samples analyzed and statistical data is provided in Supplemental Table S1.
Figure 5
Figure 5
Pre-embedding immunoelectron microscopy for α3 in the vMHb. (a–d) Pre-embedding immunoelectron microscopy for the α3 subunit acquired with a transmission electron microscope (TEM) in the vMHb from WT (a, b) and α5β4-KO (c, d) mice. In WT, metal particles for the α3 subunit are observed in the soma (a) and dendrites (Dn, b), but rarely in axons (Ax, b). Note that α3 labeling (arrows) is not associated with the postsynaptic density, which is flanked by arrowheads. Labeling in the cytoplasm and plasmalemma is almost absent in the α5β4-KO mice (c, d). (e) Summary bar graphs showing the cytoplasmic labeling in subcellular compartments in WT and α5β4-KO mice. The number of profiles examined, which were used for statistical testing, are: WT (soma, 9; dendrite, 40; axon, 62; from 2 mice); KO (soma, 9; dendrite, 44; axon, 56; from 2 mice). In WT mice, the labeling densities in all compartments are higher than those in α5β4-KO mice (###p < 0.001, Mann–Whitney U-test). (f) Summary bar graphs comparing the plasmalemma labeling in subcellular compartments in WT and α5β4-KO mice. In WT mice, the labeling densities in all compartments are higher than those in α5β4-KO mice (###p < 0.001, Mann–Whitney U-test). The number of analyzed profiles is the same as in (e). (g) Pre-embedding immunoelectron microscopy for the α3 subunit acquired with a scanning EM (SEM). (hk) Partial reconstruction of a vMHb dendrite using consecutive 40 ultrathin section images, including g. A thin dendrite (Dn, green) is contacted by four axons (Ax1–4). Front view (h) and back view (i–k) of axons facing the postsynaptic density (PSD, blue) show that metal particles representing α3 (black) are sparse on the dendritic plasmalemma (PM) and avoid the PSD (h–j), but are abundant in the cytoplasm (cyto, k). ***p < 0.001, **p < 0.01, Kruskal–Wallis test and Dunn’s multiple comparison test.
Figure 6
Figure 6
Non-synaptic colocalization of α3 and β4 in cholinergic axons in the IPN. (a, b) Immunofluorescence for GPR151 (green) in the MHb (a) and the IPN (b). (c) Double immunofluorescence for GPR151 (green) and MAP2 (blue) distinguishes axons from the MHb and the soma (asterisk) and dendrites of IPR neurons. (d) Triple immunofluorescence for α3 (red), GPR151 (green), and MAP2 (blue) shows that α3 labeling is observed along GPR151-positive MHb axons (white arrowheads), but not in MAP2-positive IPR dendrites (black arrowheads). (e) Bar graphs comparing the α3 signal intensities in the ROI, determined by GPR151 and MAP2 labeling in triple immunofluorescence images. (f) Triple immunofluorescence for β4 (green), α3 (red), and PSD-95 (blue). The α3 and β4 labeling show good overlap (white arrowheads), but neither overlaps with the PSD-95 labeling (black arrowheads). (g, h) Bar graphs comparing the α3 (g) and β4 (h) signal intensities in the ROI, determined by α3, β4, and PSD-95 labeling from triple immunofluorescence images. The noise level was determined by applying the indicated ROI to the 90º rotated (Rt.) α3 (e, g) or β4 (h) channel images. In (e), the α3 signal intensity in the MAP2-defined ROI is comparable to the noise level (p = 0.99). In (g) and (h), the α3 and β4 signal intensity in the PSD-95-defined ROI is comparable to the noise level (p = 0.99 and p = 0.10, respectively). Statistical significance was assessed using Kruskal–Wallis test and Dunn’s multiple comparison test. ***p < 0.001, **p < 0.01. Additional information on the number of samples analyzed and statistical data is provided in Supplemental Table S2.
Figure 7
Figure 7
Pre- and post-embedding immunoelectron microscopy for α3 in the IPN. (a, b) Pre-embedding immunoelectron microscopy for the α3 subunit acquired with TEM. In WT mice, α3 labeling is observed on the plasmalemma (arrows) and in the cytoplasm of axon terminals (Ax, a). Note that plasmalemma α3 labeling (arrows) is not associated with the postsynaptic density (flanked by arrowheads). In α5β4-KO mice, cytoplasmic and plasmalemma labeling in dendrites is almost completely absent, but the labeling in the dendrites (Dn, b) persists. (c, d) Summary bar graphs comparing cytoplasmic labeling (c) and plasmalemma labeling (d) in subcellular compartments in WT and α5β4-KO mice. The cytoplasmic and plasmalemma labeling in dendrites of WT and α5β4-KO mice are comparable (p = 0.56 and p = 0.29, respectively; Mann–Whitney U-test). The cytoplasmic and plasmalemma labeling in axons are significantly decreased in α5β4-KO mice compared to WT mice (***p < 0.001, **p < 0.01; Mann–Whitney U-test). In (c) and (d), the number of profiles examined, which were used for statistical testing, are: WT (dendrite, 27; axon, 32; from 2 mice); KO (dendrite, 18; axon, 29; from 2 mice). (e–g) Post-embedding immunogold EM for AMPAR (e), α3 (f), and β4 (g). Note that while immunogold labeling for AMPARs (e, arrows) is abundant on the PSD (flanked by arrowheads), labeling for α3 and β4 is not detected on the PSD (flanked by arrowheads; f, g). (h–j) Pre-embedding immunoelectron microscopy for α3 acquired with a SEM (h) and partial reconstruction of axons and dendrites in the IPN using consecutive 50 ultrathin section images, including (h). (i) A dendritic protrusion contacted by axons (Ax1–4) forms a characteristic hollow (asterisk). (j) An alternate perspective of the reconstruction, removing Ax4 and a dendritic protrusion from (i), shows that the dendritic protrusion forms multiple synapses (PSD, blue) with axons (Ax1 and Ax3), and α3 labeling (arrows) is sparse on the axonal surface.

Similar articles

Cited by

References

    1. Albuquerque EX, Pereira EF, Alkondon M, Rogers SW. Mammalian nicotinic acetylcholine receptors: From structure to function. Physiol. Rev. 2009;89:73–120. doi: 10.1152/physrev.00015.2008. - DOI - PMC - PubMed
    1. Bouzat C, Sine SM. Nicotinic acetylcholine receptors at the single-channel level. Br. J. Pharmacol. 2018;175:1789–1804. doi: 10.1111/bph.13770. - DOI - PMC - PubMed
    1. Sargent PB. The diversity of neuronal nicotinic acetylcholine receptors. Annu. Rev. Neurosci. 1993;16:403–443. doi: 10.1146/annurev.ne.16.030193.002155. - DOI - PubMed
    1. Zoli M, Pistillo F, Gotti C. Diversity of native nicotinic receptor subtypes in mammalian brain. Neuropharmacology. 2015;96:302–311. doi: 10.1016/j.neuropharm.2014.11.003. - DOI - PubMed
    1. Fenster CP, Rains MF, Noerager B, Quick MW, Lester RA. Influence of subunit composition on desensitization of neuronal acetylcholine receptors at low concentrations of nicotine. J. Neurosci. 1997;17:5747–5759. doi: 10.1523/jneurosci.17-15-05747.1997. - DOI - PMC - PubMed

Substances