. 2024 Aug;38(8):1777-1786.
doi: 10.1038/s41375-024-02303-w. Epub 2024 Jun 20.

CREB1 promotes expression of immune checkpoint HLA-E leading to immune escape in multiple myeloma

Affiliations

CREB1 promotes expression of immune checkpoint HLA-E leading to immune escape in multiple myeloma

Aya Ismael et al. Leukemia. 2024 Aug.

Abstract

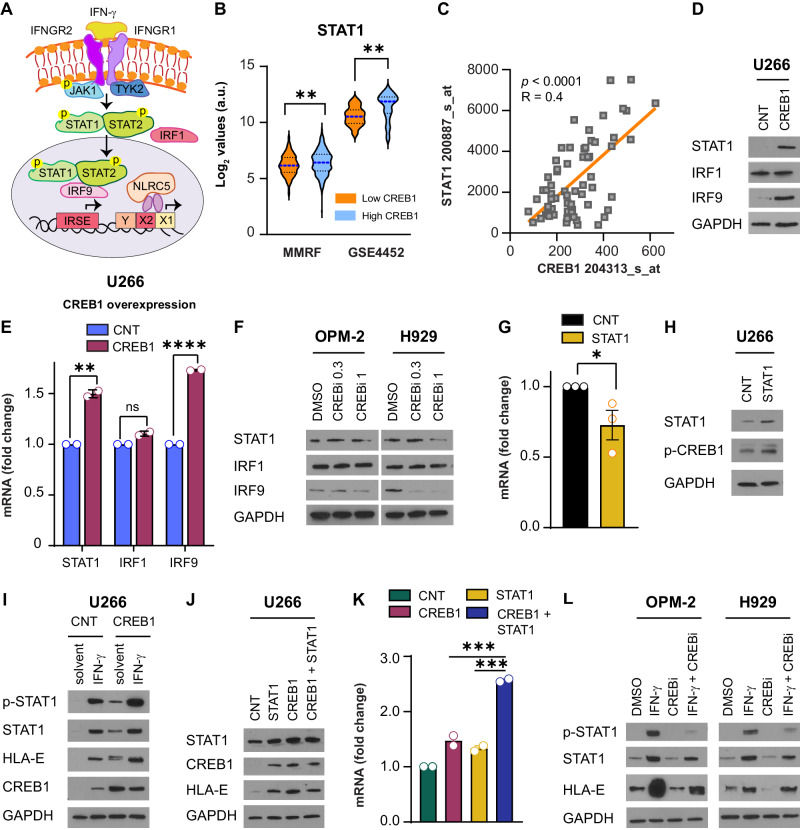
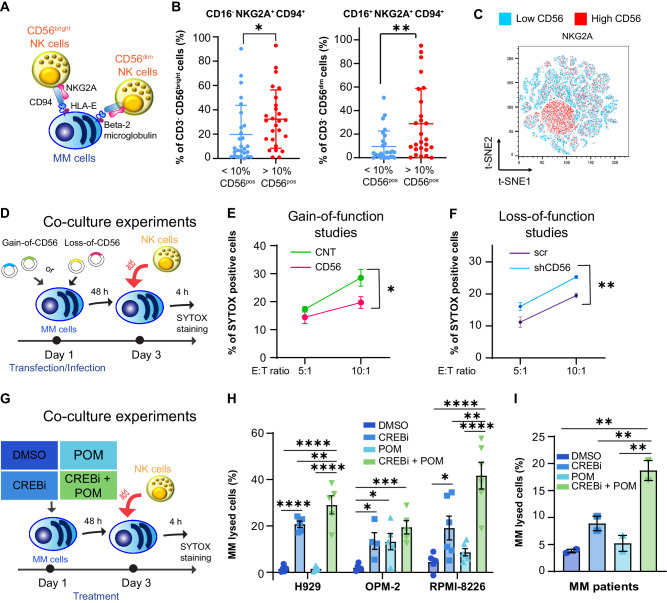
Multiple myeloma (MM) cells effectively escape anti-tumoral immunity to survive in the tumor microenvironment (TME). Herein, we identify non-classical major histocompatibility complex (MHC) class I molecule HLA-E as a major contributing factor in immune escape. Clinically, HLA-E expression correlates with aggressive disease features such as t(4;14) and CD56 expression and is induced by IFN-gamma (IFN-γ) in the TME. We discovered that HLA-E is regulated by cAMP responsive element binding protein 1 (CREB1) transcription factor by direct promoter binding; genomic and pharmacological inhibition of CREB1 reduced HLA-E levels even in the presence of IFN-γ or IFN-γ activating agents, such as immunomodulatory drugs and panobinostat. HLA-E binds to natural killer group 2A (NKG2A), delivering an inhibitor signal to natural killer (NK) cells. Treatment with a CREB1 inhibitor was able to restore NK cell-mediated cytotoxicity against MM cell lines and patient samples. In conclusion, our results strongly demonstrate that CREB1 inhibition promotes anti-tumoral immunity in MM by limiting HLA-E expression and enhancing the activity of NK cells.


Conflict of interest statement

The authors declare no competing interests.

Figures

Fig. 1
Fig. 1. HLA-E is expressed in MM cells and induced by IFN-γ.
A HLA-E log2 mRNA expression values in bone marrow plasma cells from healthy individuals (NPCs, n = 22), individuals with monoclonal gammopathy of undetermined significance (MGUS, n = 44), or individuals with smoldering multiple myeloma (SMM, n= 12). 2000904_at probe: ANOVA p value = 0.0004; NPCs vs MGUS p = 0.0036, **; NPCs vs SMM p = 0.0005, ***. 200905_x_at probe: ANOVA p value = 0.0005; NPCs vs MGUS p = 0.0003, ***; NPCs vs SMM p = 0.0179, *. Solid blue lines indicate the median values; black dotted lines represent the 25th and 75th percentile. Data are derived from GSE5900 dataset. B HLA-E log2 mRNA expression values in bone marrow plasma cells from healthy individuals (NPCs, n = 12) or patients with MM (MM, n = 65); 2000904_a probe: p < 0.0001, ****; 200905_x_at probe: p < 0.0001, ****. Solid blue lines indicate the median values; black dotted lines represent the 25th and 75th percentile. Data are derived from GSE4452 dataset. C Representative immunohistochemistry staining for HLA-E (20×) in one newly diagnosed patient with MM. Red arrows show MM cells positive for HLA-E. D HLA-E mRNA fold change in a panel of MM cell lines (U266, RPMI-8226, OPM-2, and H929) treated with solvent or IFN-γ 1 ng/mL for 24 h. n = 3, t test, two-tailed; U266 p = 0.0096, **; RPMI-8226 p = 0.0016, **; OPM-2 p = 0.0141, *; H929 p = 0.0031, **. Treated cells are normalized to each control. E HLA-E mean fluorescence intensity (MFI) fold change in a panel of MM cell lines (U266, RPMI-8226, OPM-2, and H929) treated with solvent or IFN-γ 1 ng/mL for 24 h. n = 2, t test, two-tailed; U266 p = 0.0014, **; RPMI-8226 p = 0.0455, *; OPM-2 p = 0.0311, *; H929 p < 0.0001, ****. Treated cells are normalized to each control. F Western blot analysis for HLA-E and GAPDH in a panel of MM cell lines (U266, RPMI-8226, OPM-2, and H929) treated with solvent, IFN-γ 1 ng/mL, or IFN-γ 50 ng/mL for 24 h.
Fig. 2
Fig. 2. CD56 and CREB1 modulate HLA-E expression in MM.
A Schema of CD56-CREB1 signaling in MM. CD56 induces phosphorylation of RPS6KA3 (also known as RSK2), which in turn phosphorylates CREB1, leading to gene transcription. B Pathway analysis of the upregulated IFN_driven gene sets in the MMRF CoMMpass and GSE4452 datasets. Patients are divided based on median cutoff of CREB1 expression. NES normalized enrichment score; FDR false discovery rate; gene count includes the number of significant genes in the pathway. C HLA-E log2 expression values in patients with low or high CREB1 expression based on median cutoff of CREB1 expression. CoMMpass MMRF dataset: n = 809, p < 0.0001, **** and GSE4452 dataset: n = 65, p = 0.0061, **. Dashed blue lines indicate the median values; black dotted lines represent the 25th and 75th percentile. D Regression studies to correlate HLA-E (probe 200904_at) as dependent variable to CREB1 (probe 204314_s_at). p = 0.0031; R = 0.13. E ChIP-sequencing tracks showing CREB1 signal on individual locus for HLA-E. The x-axis shows genomic coordinates. F Quantitative PCR of CREB1-ChIP enriched binding site to HLA-E promoter. n = 2, t test, two-tailed; p = 0.0317, *. G HLA-E MFI fold change in U266 cells overexpressing CREB1 compared with U266 control cells (CNT). n = 3, t test, two-tailed; p = 0.0001, ***. H HLA-E MFI fold change in U266 cells overexpressing CD56 compared with U266 control cells (CNT). n = 3, t test, two-tailed; p = 0.0010, **. I HLA-E MFI fold change in OPM-2 cells, H929 cells, and CD56+ CD138+ patient-derived MM cells treated with DMSO (D) or 666-15 (CRi) 0.3 μM for 48 h. n = 3, t test, two-tailed; OPM-2 p = 0.0153, *; H929 p = 0.04, *; MM patient samples (MM pts) p = 0.04, *. J HLA-E mRNA fold change in OPM-2 and H929 cells silenced for CREB1 (shCREB1) or with scrambled vectors, scr (n = 2, t test, two-tailed; p = 0.039, * and 0.0031, **) and in U266 cells overexpressing CREB1 or the control vector- CNT (n = 3, t test, two-tailed; p = 0.05, *). K HLA-E mRNA fold change in OPM-2 and H929 cells silenced for CD56 (shCD56) or with scrambled vectors, scr (n = 2, t test, two-tailed; p = 0.0008, *** and 0.0021, **) and in U266 cells overexpressing CD56 or the control vector-CNT (n = 3, t test, two-tailed; p = 0.04, *).
Fig. 3
Fig. 3. Both STAT1 and CREB1 regulate HLA-E expression.
A Schema of IFN-γ signaling. IFN-γ signals via a receptor composed of two IFNGR chains (IFNGR1 and 2), which activate JAK1 and STAT1/STAT2. Phosphorylated STAT1/STAT2 complexes interact with IRF1 and IRF9, translocate to the nucleus, and bind to DNA on interferon sensitive response elements (ISRE). NLRC5 also binds to DNA to promote IFN-γ-related gene transcription. B STAT1 log2 expression values in patients with low or high CREB1 expression based on median cutoff of CREB1 expression. CoMMpass MMRF database: n = 809, p = 0.0015, ** and GSE4452 database: n = 65, p = 0.0013, **. Dashed blue lines indicate the median values; black dotted lines represent the 25th and 75th percentile. C Regression studies to correlate STAT1 (probe 200887_s_at) as dependent variable to CREB1 (probe 204313_at). p < 0.0001; R = 0.4. D Western blot analysis for STAT1, IRF1, IRF9, and GAPDH in U266 control cells (CNT) or U266 cells overexpressing CREB1. E STAT1, IRF1, and IRF9 mRNA fold change in U266 control cells (CNT) or U266 cells overexpressing CREB1. n = 2, t test, two-tailed; STAT1 p = 0.0031, **; IRF1 p = ns; IRF9 p < 0.0001, ****. F Western blot analysis for STAT1, IRF1, IRF9, and GAPDH in OPM-2 and H929 cells treated with DMSO, 666-15 (CREBi) 0.3 μM, and 666-15 (CREBi) 1 μM for 48 h. G CREB1 mRNA fold change in U266 control cells (CNT) or U266 cells overexpressing STAT1. n = 3, t test, two-tailed; p = 0.05, *. H Western blot analysis for STAT1, phospho-CREB1, and GAPDH in U266 control cells (CNT) or U266 cells overexpressing STAT1. I Western blot analysis for phospho-STAT1, STAT1, HLA-E, CREB1, and GAPDH in U266 control cells (CNT) or U266 cells overexpressing CREB1 treated with solvent or IFN-γ 1 ng/mL for 24 h. J Western blot analysis for STAT1, CREB1, HLA-E, and GAPDH in U266 control cells (CNT), U266 cells overexpressing STAT1, CREB1, or CREB1 + STAT1. K HLA-E mRNA fold change in the same conditions reported in panel J. n = 2, t test, two-tailed; CREB1 versus CREB1 + STAT1 p = 0.0004, ***; STAT1 versus CREB1 + STAT1 p = 0.0003, ***. L Western blot analysis for phospho-STAT1, STAT1, HLA-E, and GAPDH in OPM-2 and H929 cells treated with DMSO, IFN-γ 1 ng/mL, 666-15 (CREBi) 1 μM, and the combination of IFN-γ + CREBi for 24 h.
Fig. 4
Fig. 4. HLA-E expression is modulated by anti-MM drugs.
A HLA-E mRNA fold change in OPM-2 and H929 cells treated with DMSO, lenalidomide (LEN) 1 μM for 72 h, pomalidomide (POM) 1 μM for 72 h, and panobinostat (PANO) 100 nM for 24 h. n = 2, t test, two-tailed. OPM-2: DMSO versus LEN p = 0.0149, *; DMSO versus POM p = 0.0293, *; DMSO versus PANO p = 0.05, *. H929: DMSO versus LEN p = 0.0349, *; DMSO versus POM p = 0.0063, **; DMSO versus PANO p = 0.0002, ***. B HLA-E MFI fold change in OPM-2 cells and H929 cells treated with DMSO, LEN 1 μM for 72 h, POM 1 μM for 72 h, and PANO 100 nM for 24 h. n = 3, t test, two-tailed. OPM-2: DMSO versus LEN p < 0.0001, ****; DMSO versus POM p = 0.0021, **; DMSO versus PANO p = 0.0105, *. H929: DMSO versus LEN p = 0.0004, ***; DMSO versus POM p = 0.0075, **; PANO p = 0.97, ns. C HLA-E MFI fold change in OPM-2 cells treated with DMSO, LEN 0.1 μM, or POM 0.1 μM for 4 and 7 days. n = 2, t test, two-tailed. Day 4: DMSO versus LEN p = 0.05, *; DMSO versus POM p = 0.0115, *; day 7: DMSO versus LEN p = 0.0255, *; DMSO versus POM p = 0.0313, *. D HLA-E MFI fold change in OPM-2 cells and MM patient samples treated with DMSO, POM 1 μM, 666-15 (CREBi) 0.3 μM, or POM + CREBi. OPM-2: OPM-2 cells were treated for 72 h. n = 2, t test, two-tailed; POM versus POM + CREBi p = 0.0018, **. MM patients: patient samples were treated for 48 h. n = 3, t test, two-tailed; POM versus POM + CREBi p = 0.0059, **. E Gene-expression profiling for HLA-E in n = 16 relapsed refractory patients with MM with matched pre- and post-lenalidomide (LEN) data from dataset GSE8546. F Western blot analysis for p-CREB1, STAT1, and GAPDH in OPM-2, H929, and MM.1S cells treated with DMSO and POM 1 μM for 6, 24, and 48 h.
Fig. 5
Fig. 5. NK cell-mediated cytotoxicity is increased by CREB1 inhibition.
A Cellular interactions between HLA-E+ MM cells and CD94+ NKG2A+ NK cells (either CD56bright or CD56dim). B Percentages of CD3 CD56bright CD16 CD94+ NKG2A+ NK cells (t test, two-tailed; p = 0.021, *) or CD3 CD56dim CD16+ CD94+ NKG2A+ NK cells (t test, two-tailed; p = 0.004, **) in patients with <10% of CD56-expressing clonal MM cells (n = 27) or >10% of CD56-expressing clonal MM cells (n = 26). C t-SNE analysis combining CD94+ NKG2A+ cells in the two conditions. D Schema of co-culture experiments using gain-of- or loss-of-function cells. Freshly isolated NK cells were co-cultured with MM cells for 4 h. SYTOX staining was used to distinguish viable from dead MM cells. E U266 control cells (CNT) or U266 cells overexpressing CD56 (CD56) were incubated with NK cells derived from three healthy donors (E:T ratio 5:1 p = 0.11, ns; E:T ratio 1:10 p = 0.014, *). F H929 scrambled cells (scr) or H929 cells silenced for CD56 (shCD56) were incubated with NK cells derived from two healthy donors (E:T ratio 5:1 p = 0.08, ns; E:T ratio 10:1, p = 0.009, **). G Schema of co-culture experiments in cells pretreated for 48 h with DMSO, 666-15 (CREBi) 0.3 μM, pomalidomide (POM) 1 μM, or combination of CREBi with POM (CREBi + POM). Freshly isolated NK cells were co-cultured with MM cells for 4 h. SYTOX staining was used to distinguish viable from dead MM cells. H NK cell-mediated cytotoxicity by SYTOX staining in H929, OPM-2, and RPMI-8226 cells treated with DMSO, CREBi 0.3 μM, POM 1 μM, or combination of CREBi with POM (CREBi + POM) with or without NK cells. NK cells were isolated from n = 6 different healthy donors. E:T ratio was 5:1. % of lysis is calculated as described in the “method” section. H929: ANOVA p < 0.0001; “DMSO + NK cells” versus “CREBi + NK cells” p < 0.0001, ****; “DMSO + NK cells” versus “CREBi + POM + NK cells” p < 0.0001, ****; “CREBi + NK cells” versus “CREBi + POM + NK cells” p = 0.0041, **; “POM + NK cells” versus “CREBi + POM + NK cells” p < 0.0001, ****. OPM-2: ANOVA p = 0.0041; “DMSO + NK cells” versus “CREBi + NK cells” p = 0.0149, *; “DMSO + NK cells” versus “POM + NK cells” p = 0.0124, *; “DMSO + NK cells” versus “CREBi + POM + NK cells” p = 0.0005, ***; RPMI-8226: ANOVA p < 0.0001; “DMSO + NK cells” versus “CREBi + NK cells” p = 0.0261, *; “DMSO + NK cells” versus “CREBi + POM + NK cells” p < 0.0001, ****; “CREBi + NK cells” versus “CREBi + POM + NK cells” p = 0.001, **; “POM + NK cells” CREBi + POM “combo + NK cells” p < 0.0001, ****. I NK cell-mediated cytotoxicity by SYTOX staining in MM patient samples treated with DMSO, CREBi 0.3 μM, POM 1 μM, or combination of CREBi with POM (CREBi + POM) with or without NK cells. NK cells were isolated from n = 2 different healthy donors. ANOVA p = 0.0050; “DMSO + NK cells” versus “CREBi + POM + NK cells” p = 0.0015, **; “CREBi + NK cells” versus “CREBi + POM + NK cells” p = 0.0071, **; “POM + NK cells” versus “CREBi + POM + NK cells” p = 0.0022, **.

References

    1. van de Donk N, Pawlyn C, Yong KL. Multiple myeloma. Lancet. 2021;397:410–27. 10.1016/S0140-6736(21)00135-5 - DOI - PubMed
    1. Freud AG, Mundy-Bosse BL, Yu J, Caligiuri MA. The broad spectrum of human natural killer cell diversity. Immunity. 2017;47:820–33. 10.1016/j.immuni.2017.10.008 - DOI - PMC - PubMed
    1. Blom B, van Hoeven V, Hazenberg MD. ILCs in hematologic malignancies: tumor cell killers and tissue healers. Semin Immunol. 2019;41:101279. 10.1016/j.smim.2019.06.002 - DOI - PubMed
    1. Bao A, Zhao Q, Kudalkar R, Rodriguez J, Sharma N, Bumma N, et al. Impact of interval progression before autologous stem cell transplant in patients with multiple myeloma. Front Oncol. 2023;13:1216461. 10.3389/fonc.2023.1216461 - DOI - PMC - PubMed
    1. Garcia-Sanz R, Gonzalez M, Orfao A, Moro MJ, Hernandez JM, Borrego D, et al. Analysis of natural killer-associated antigens in peripheral blood and bone marrow of multiple myeloma patients and prognostic implications. Br J Haematol. 1996;93:81–8. 10.1046/j.1365-2141.1996.4651006.x - DOI - PubMed

MeSH terms

Substances