. 2024 Jul;56(7):1456-1467.
doi: 10.1038/s41588-024-01801-y. Epub 2024 Jun 20.

Non-stem cell lineages as an alternative origin of intestinal tumorigenesis in the context of inflammation

Affiliations

Non-stem cell lineages as an alternative origin of intestinal tumorigenesis in the context of inflammation

Mathijs P Verhagen et al. Nat Genet. 2024 Jul.

Abstract

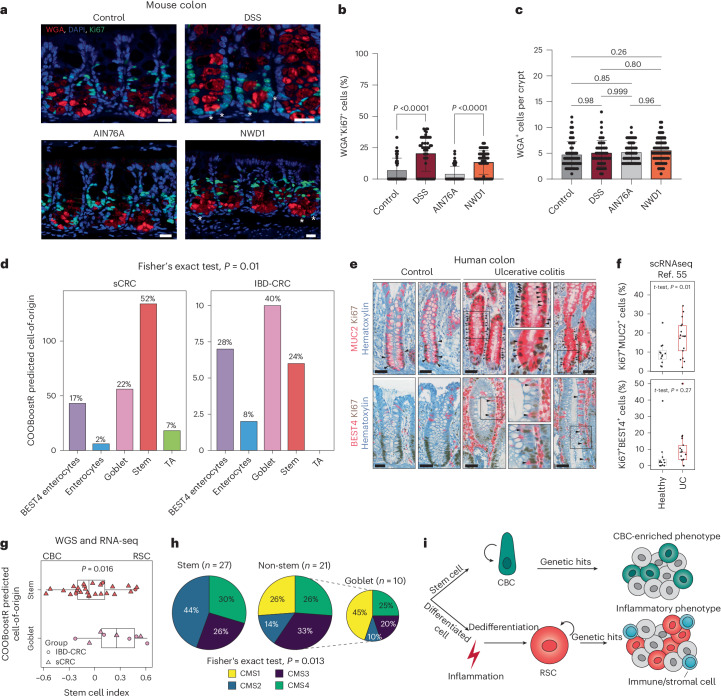
According to conventional views, colon cancer originates from stem cells. However, inflammation, a key risk factor for colon cancer, has been shown to suppress intestinal stemness. Here, we used Paneth cells as a model to assess the capacity of differentiated lineages to trigger tumorigenesis in the context of inflammation in mice. Upon inflammation, Paneth cell-specific Apc mutations led to intestinal tumors reminiscent not only of those arising in patients with inflammatory bowel disease, but also of a larger fraction of human sporadic colon cancers. The latter is possibly because of the inflammatory consequences of western-style dietary habits, a major colon cancer risk factor. Machine learning methods designed to predict the cell-of-origin of cancer from patient-derived tumor samples confirmed that, in a substantial fraction of sporadic cases, the origins of colon cancer reside in secretory lineages and not in stem cells.


Conflict of interest statement

The authors declare no competing interests.

Figures

Fig. 1
Fig. 1. PCs as the cell-of-origin of intestinal tumors in the context of inflammation and loss of Apc.
a, Cre–lox strategy aimed at the targeting of Apc, Kras and Trp53 mutations in ISCs (Lgr5+ ISCs) and PCs (Lyz1+ PCs). w/wo indicates the presence (with) or absence (without) of DSS. b,c, β-Catenin IHC analysis of intestinal tumors initiated from Lgr5+ ISCs (b) and PCs (c). Asterisks indicate Lgr5+ ISCs and PCs with enhanced cytoplasmic and nuclear β-catenin accumulation; tumor foci and adenomas are indicated by dashed lines. d,e, Tumor multiplicity was calculated according to tumor-bearing mice (d) and by tumor number per genotype (e) in the presence/absence of DSS and based on Swiss roll counts. Error bars denote s.d. P values denote one-way ANOVA and Tukey’s post hoc tests for group comparisons. f, Lineage-tracing analysis of PCs, labeled using yellow fluorescent protein (YFP), at different stages of tumor initiation and progression. gj, LYZ1 (g) and DCLK1 (i) IHC analysis of Lgr5+ ISC-derived (left) and PC-derived (right) adenomas, and quantification of number of Lyz1+ (h) and Dclk1+ (j) tumor cells. P values depict one-way ANOVA and Tukey’s post hoc tests for group comparisons. k, Lyz1, Dclk1 and Axin2 quantitative PCR expression analysis across different adenoma genotypes. P values represent one-way ANOVA and Tukey’s post hoc tests for group comparisons. Source data
Fig. 2
Fig. 2. PCs may dedifferentiate into a revival stem cell identity.
a, Schematics of the experimental approach, adapted from ref. , Springer Nature Limited. After genetic targeting of PCs, intestinal crypts were extracted, and the isolated cells were labeled with hashing antibodies and sorted according to three different strategies: epithelium, PC-enriched and PC-traced cells. b, UMAP embedding of the different cell clusters or lineages (left), annotated according to the expression of canonical marker genes (right). EE, enteroendocrine cells; EP, enterocytes progenitors; TA, transit-amplifying cells. c, Bar plot of the distribution of traced cells across the different mouse genotypes and experimental conditions. d, Violin plots representing marker genes of the newly identified Paneth-derived cell clusters (PC cluster 1–4). e, Association analysis of the RSC signature with PC cluster 1–4. The P value denotes the result of one-way ANOVA. f, RNA in situ hybridizations of the Clu gene in small tumors derived from PCs upon compound targeting of Apc and Kras mutations. g, Gene sets variation analysis among refs. , and the current study. EMT, epithelila-to-mesenchymal transition. Source data
Fig. 3
Fig. 3. Paneth-derived adenomas have an inflammatory phenotype mimicking colitis-associated colon cancer.
a, Schematics of the experimental approach to compare PC- and Lgr5-derived adenomas. b, PCA plot showing that the cell-of-origin is the dominant discriminator of variance. Ctrl, control. c, Bar plot summarizing the GSEA between Paneth-derived (Lyz1 Apc DSS) and ISC-derived (Lgr5 Apc DSS) tumors. Pathways were filtered based on P < 0.05 and absolute normalized enrichment score (NES) > 0.5. Pathways that are significant in the IBD-CRC versus sCRC comparison have bold labels. ROS, reactive oxygen species. d, Subset of inflammatory pathways, visualized as a heatmap based on values from the GSVA. e, Box plots showing results of the stem cell index. The P value depicts the result of one-way ANOVA. n = 3 biologically independent samples per group. Box plots display the median, lower and upper hinges corresponding to the first and third quartiles. Whiskers extend from the hinges to maximum or minimum values, no further than 1.5× interquartile range. f, GSEA showing a significant but opposite association between the Lyz1 tumor signature and IBD-CRCs, and between the Lgr5 tumor signature and sCRC. The P value denotes the Benjamini–Hochberg adjusted value of the two-sided enrichment P value from GSEA. g, Heatmap showing GSVA scores, averaged per tumor group, of pathways with similar patterns between the mouse and human tumor groups. h, Heatmap highlighting differentially expressed genes (log2-transformed fold change > 1.5, Padj < 0.01. Two-tailed P values were derived from the Wald test with Benjamini–Hochberg correction for multiple testing shared between the Paneth or IBD tumors and the Lgr5 or sCRC tumors. Values denote z-scores of average expression per cell type. cDC, conventional dendritic cells; EC, endothelial cells; NK, natural killer cells; Ig, immunoglobulin. im, Two distinct sporadic colon cancer identities become apparent upon analysis of a large cohort of CRC tumors (n = 3,232 samples). i, Heatmap showing Pearson correlations of the GSVA scores. jk, Scatter plot showing two distinct clusters, sporadic-like and colitis-like, in all colon cancers (j) and stratified according to their CMS (k). Gray lines indicate contours lines, and dashed lines show thresholds to classify tumors in colitis-like, sporadic-like and intermediate groups. l, Stacked bar plot analysis showing the distribution of CMS1 to CMS4 across colitis-like and sporadic-like colon cancers. m, Kaplan–Meier survival analysis for relapse-free survival. P values denote the result of the log-rank test and Cox regression models for univariate analyses. Hazard ratios (HR) and confidence intervals (CI) are shown for pairwise comparisons. Source data
Fig. 4
Fig. 4. Western-style diet triggers an inflammatory response leading to PC dedifferentiation.
a, Schematics of the experimental approach designed to investigate the consequences of short- and long-term exposure to a western-style diet (NWD1) versus control (AIN-76A) diets. b, Heatmap showing z-scored DSS signature (DSS versus control; Padj < 0.05, log2-transformed fold change > 0.25) in PCs exposed to DSS or NWD1. c, Organoid multiplicities derived either from single ISCs or PCs, and from reconstituted doublets (L, Lgr5+ ISCs; P, PCs). Pooled data from n = 4 independent experiments. P values were calculated using one-way ANOVA and Tukey’s tests for group comparisons. Error bars depict s.d. d, Representative image of lineage tracings from a NWD1-fed Lyz1-YFP mouse. Scale bars, 50 μm. The P value depicts the result of a two-sided Student’s t-test and the error bars represent s.d. Data from n = 3 mice. e, UMAP showing PCs from mice fed AIN-76A (AIN) and NWD1 (n = 3 mice per condition). The DSS signature portrayed on UMAP embedding highlights a subcluster of PCs responsive to the NWD1 diet. f, Violin plots showing different levels of the DSS signature (top) and CytoTRACE score (bottom) between PCs responsive to the NWD1 diet and other PCs. P values show the significance of a two-sided Wilcoxon test. g, Violin plots representing marker genes of PCs responsive to the NWD1 diet, showing coexpression of stem and secretory markers. h, Heatmap visualization of GSVA, indicating pathways that are activated in PCs after exposure to DSS or NWD1. Comparison with data from ref. . i, UMAP plot of PC subset in the scATAC dataset of mice treated with AIN (n = 2) and NWD1 (n = 2). j, Heatmap listing differential peaks between diet response PCs and other PCs. k, Ideogram displaying the distribution along the mouse chromosomes (Chr) of the differential peaks observed upon diet response (red) when compared with those characteristic of PCs (blue). Source data
Fig. 5
Fig. 5. Inflammation activates distinct cells-of-origin in the colon.
a, Colonic tissues from either untreated mice or mice administered 3% DSS for 7 days, as well as from mice fed AIN-76A or NWD1 synthetic diets for 3 months were analyzed for the presence of proliferative DCS cells. WGA was used to stain DCS cells, and Ki67 to mark proliferative cells. Tissues were counterstained by DAPI (nucleus). Asterisks mark WGA/Ki67 double-positive cells. b,c, Quantification of WGA+Ki67+cells (b) and total WGA+ cells (c) in the lower colonic crypt of the mice, as shown in a. Scale bar, 20 μm. A minimum of 50 crypts from three different mice were analyzed. Data are presented as mean and s.d. P values denote two-tailed Tukey’s tests for group comparisons. d, Bar plot showing the predicted cell-of-origin in IBD-CRC (n = 25) and sCRC (n = 257) cohorts based on the COOBoostR computational approach (Methods). The P value is the result of Fisher’s exact test. e, MUC2, BEST4 and Ki67 IHC analysis of colonic tissues obtained from controls and patients with IBD. Asterisks indicate double-positive cells. Scale bars, 50 µm. f, Box plot showing percentage of cycling (Ki67+) MUC2+ and REG4+ cells in patients with ulcerative colitis (UC) and controls. scRNA-seq data are from ref. . Positivity was defined per cell by the presence of at least one read for that particular marker. Subsequently, cells were aggregated per patient to calculate percentages. n = 12 healthy participants and n = 17 patients with ulcerative colitis. Box plots show the median, and lower and upper hinges correspond to the first and third quartiles. Whiskers extend from the hinges to maximum and minimum values, no further than 1.5× interquartile range. The P value shows the result of a two-sided t-test. g, Box plot denoting differences in the stem cell index based on stratification of predicted cell-of-origin in a subset of IBD-CRC and sCRC cases for which RNA-seq data were available (n = 27 stem, n = 10 goblet). The P value shows the result of a two-sided t-test. Box plots display the median, and lower and upper hinges corresponding to the first and third quartiles. Whiskers extend from the hinges to maximum and minimum values, no further than 1.5× interquartile range. h, Mapping of CMS on tumor samples stratified according to their predicted cell-of-origin. The P value shows the result of Fisher’s exact test. i, Graphic abstract of the model arising from this study. Colon cancer can be initiated either from stem (ISC) or differentiated cells, the latter in response to inflammatory cues. RSC reprogramming is activated in support of the regenerative response. During this process, actively dividing RSCs expand the cell targets for tumor initiation and progression, leading to an alternative route to tumorigenesis earmarked by an inflammatory phenotype. Source data
Extended Data Fig. 1
Extended Data Fig. 1. Immuno-histologic analysis of Paneth-derived tumors.
a. Representative IHC images of Paneth-derived tumors from different genetic backgrounds, stained with phospho-histone H2A.X (Ser 139). b. Top three panels: IHC analysis of Paneth-derived intestinal tumors with different genetic backgrounds (as indicated), stained for β-catenin. Bottom: hematoxylin and eosin histological stains of Paneth-derived tumors from Lyz1/Apc/Kras/Tp53 mice.
Extended Data Fig. 2
Extended Data Fig. 2. Characterization of PC-derived small intestinal adenomas.
a. Stacked bar plot displaying the localization and distribution of PC-derived adenomas across the small intestine. b. Immunofluorescence imaging of intestinal crypts from Lyz1/tdTomato and Lyz1-AK/tdTomato mice. c. IHC analysis of the lineage-specific ChgA, Muc2, and Olfm4 markers in PC- and Lgr5-derived adenomas.
Extended Data Fig. 3
Extended Data Fig. 3. FACS gating strategy for Paneth cells enrichment and isolation.
a. FACS gating strategy established for the isolation of live, single, epithelial cells (top). Subsequently, Paneth cells were enriched using the SSChiCD24hi gate and further purified based on high cKit levels (SSChiCD24hicKithi). Alternatively, traced cells were sorted based on positive expression for Yfp or td-Tomato when the appropriate reporter mice were employed. b. Negative control employed to establish reference levels based on unstained samples. c. Bar plot of the percentage of Paneth cells obtained by the distinct gating strategies. N = 3 biologically independent experiments, and N = 5 for the tracing experiments. P values depict results of one-way ANOVA and Tukey tests. Data are presented as mean values +/- SD.
Extended Data Fig. 4
Extended Data Fig. 4. Paneth cells dedifferentiate upon DSS-driven inflammation.
a, b. In situ hybridization (ISH) analysis of Clu mRNA (green) expression at various stages during PC-derived tumorigenesis in Lyz1-Apc/Kras and (b) Lyz1-Apc/Kras/Tp53 mice. c. Bar plot showing filtered pathways (Pval < 0.05, abs NES > 0.5) of the gene set enrichment analysis comparing RSCs with PC Cluster 4. d. FACS analysis of lineage-traced (Yfp + ) cells in wild type (Lyz1-Yfp) and AKP-mutant (Lyz1-Apc/Kras/Tp53) mice. The latter clearly localize outside of the CD24hicKithi gate where wild type PCs reside. e. Bar plot relative to the percentages of lineage-traced cells evaluated by FACS using the CD24hicKithi PC-specific gate (left), or by scRNAseq analysis (% within Paneth cluster; right). P values denote significance of one-way ANOVA. f. Left: Bar plots showing the average percentage of Ascl2+ and Lgr5+ stem cells in control and DSS-treated animals. Right: Violin plots showing a decrease in the crypt base columnar (CBC) signature upon DSS treatment. P values denote significance of one-way ANOVA and Tukey test for group comparisons.
Extended Data Fig. 5
Extended Data Fig. 5. Distinct TME features in CBC- and PC-derived small intestinal adenomas.
IHC analysis of Lgr5+- and Lyz-derived adenomas with the tumor microenvironment markers αSMA (fibroblasts), F4/80 (macrophages), and Cd3 (T cells).
Extended Data Fig. 6
Extended Data Fig. 6. Lgr5+ CBCs ablation triggers dedifferentiation of Paneth and goblet secretory lineages.
a. Differential expression analysis of intestinal stem cells in homeostasis and during regeneration following Lgr5+ CBCs ablation. scRNAseq are from Singh et al.. Several among the top 50 differentially expressed genes in the regenerated ISCs are Paneth-specific markers (red). Pvalues denote the result of the Wilcoxon Rank Sum test. b. Heatmap showing transcriptional activity of the RSC program upon Lgr5+ CBCs ablation. c, d. Lineage tracing of DT-treated Lgr5DTR-EGFP;c-KitCreERT2; RosatdTomato mice across different intestinal sections (c.) and double stained with Lyz1/tdTomato (d.). Scale bar = 50 μM, 2 mice per group were analyzed. e. Stacked bar plot of the cell type fractions in AOM/DSS adenomas as predicted by Cibersort analysis (see Methods). Bulk RNAseq data are from Chen et al.. f. Differential cell type abundance (MiloR63; see Methods) between AOM/DSS and Lrig1-Apc adenomas. scRNAseq data are from Vega et al.. g. Comparison of RSC and PC Cluster 4 module score in tumor cells from AOM/DSS and Lrig1-Apc adenomas. P values depict significance values of two-sided Wilcoxon test. h. Venn diagram indicating the overlap between marker genes from PC Cluster 4 and the AOM/DSS-specific squamous tumor cell subpopulation.
Extended Data Fig. 7
Extended Data Fig. 7. Differential gene expression analysis between IBD colon cancers and murine PC-derived small intestinal adenomas.
a. Volcano plot showing differentially expressed (Pval < 0.01, FC cutoff 1.5) genes between Lgr5- and Paneth-derived intestinal tumors. Two-tailed Pvalue were derived from the Wald test. b. Volcano plot highlighting differentially expressed (Pval < 0.01, FC cutoff 1) genes between sporadic- and IBD-CRCs. c. Box plots relative to differentially expressed CBC (Lgr5-derived) and RSC (PC-derived) marker genes between sporadic- and IBD-CRCs. N = 14 IBD-CRCs and N = 38 sCRCs. Boxplots display the median, lower and upper hinges correspond to the first and third quartiles. Whiskers extend from the hinges to max/min values, no further than 1.5*inter-quartile range. P values denote results of the t test. d. Bar plot relative to the gene set enrichment analysis between sCRC and IBD-CRC (abs NES > 0.5, Pval < 0.05). e. Box plots relative to stem cell index values across the colitis-like (N = 798), sporadic-like (N = 940), and intermediate (N = 1494) group of colon cancers. Boxplots display the median, lower and upper hinges correspond to the first and third quartiles. Whiskers extend from the hinges to max/min values, no further than 1.5*inter-quartile range. P value depicts result of one-way ANOVA.
Extended Data Fig. 8
Extended Data Fig. 8. Immune profiling of CBC- and PC-derived small intestinal adenomas.
a. Boxplot showing gene set variation score of the tumour infiltrating lymphocyte (TIL) signature. N = 6 Lgr5-derived tumours and N = 9 Paneth-derived tumours. Boxplots display the median, lower and upper hinges correspond to the first and third quartiles. Whiskers extend from the hinges to max/min values, no further than 1.5*inter-quartile range. Pvalue denotes the result of two-sided t-test. b. CiberSortx prediction of absolute immune infiltrate based on the ImmuCC signature matrix. N = 6 Lgr5-derived tumours and N = 9 Paneth-derived tumours. Boxplots display the median, lower and upper hinges correspond to the first and third quartiles. Whiskers extend from the hinges to max/min values, no further than 1.5*inter-quartile range. Pvalue denotes the result of two-sided t-test. c. Stacked bar plot denoting the relative contribution of leukocyte subtypes in CBC- and PC-derived intestinal adenomas. N = 3 samples per group. d. Bar plots showing the number of immune receptor clonotypes, separated by chain usage, across CBC- and PC-derived tumours. Bars denote the average of N = 3 samples. e. CiberSortx prediction of absolute immune infiltrate based on the LM22 signature on human CRCs, stratified according to their sporadic-like and colitis-like expression profiles. N = 798 colitis-like CRCs, N = 1494 intermediate and N = 940 sporadic-like CRCs. Boxplots display the median, lower and upper hinges correspond to the first and third quartiles. Whiskers extend from the hinges to max/min values, no further than 1.5*inter-quartile range. Pvalue denotes the result of two-sided t-test. f. Heat map showing relative differences in infiltrating immune cells between sporadic- and colitis-like CRCs. g. UMAP dimension reduction displaying T-cells in murine tumours from Vega et al. subdivided in three distinct sub-clusters. h. Stacked bar plot indicating the distribution of the T-cell sub-clusters among the Lrig1-Apc and AOM/DSS-derived tumours. i. Dot plot showing the expression profile of discriminating markers across the T-cell sub-clusters. P values denote results of t tests. Source data
Extended Data Fig. 9
Extended Data Fig. 9. The NWD1 western-style diet triggers the dedifferentiation of Paneth cells.
a. GSEA plot of Paneth cells from NWD1- vs. AIN76A-fed mice. The DSS signature significantly associates with the NWD1 diet (NES 2.99, Padj 2.5e-56). P value denote Benjamini-Hochberg adjusted value of the two-sided enrichment P-value from GSEA. b. Bar plot showing pathways elevated (P < 0.05, NES > 0.5) in Paneth cells from NWD1- when compared to AIN76A-fed animals. c. Prediction scores for Paneth (left) and goblet (right) cells on UMAP embedding from the scATAC data (Choi et al.). d. Unsupervised clustering reveals two distinct clusters (c5, c20) that include Paneth cells. e. Bar plot listing gene ontology (GO) results based on differential peaks from the diet responsive Paneth cells. Pvalues were obtained from the EnrichR GO analysis and denote the results of Fisher’s exact test f. Immunofluorescence imaging of WGA and Olf4m showing intestinal crypts from mice fed with AIN/NWD1 diets. Asterisks earmark double positive cells. Scale bar indicates 10 µm.
Extended Data Fig. 10
Extended Data Fig. 10. Epigenetic profiles of normal colonic lineages and mutational patterns of IBD-related and sporadic colon cancers.
a. UMAP plot displaying 1 Mb processed scATAC data of the human colon (Becker et al.). b, c. Average number of passenger mutations (b) in IBD-related and sporadic colon cancers N = 257 sCRCs and N = 25 IBD-CRCs. (c). Relative mutation frequency in IBD-enriched (N = 78) and sCRC-enriched (N = 136) bins based on two-sided Wilcox test (P < 0.01). Error bars are displayed from the mean and indicate the standard error from bootstrap with a 95% confidence interval. d. Barplot showing the genomic overview of differential bins across chromosomes. e. Boxplots relative to the gene set variation analysis (GSVA) scores of tumors stratified according to their predicted cell of origin. P values denote results of t tests. N = 27 Stem-predicted and N = 10 Goblet-predicted CRCs. Boxplots display the median, lower and upper hinges correspond to the first and third quartiles. Whiskers extend from the hinges to max/min values, no further than 1.5*inter-quartile range.

Update of

References

    1. Bajaj J, Diaz E, Reya T. Stem cells in cancer initiation and progression. J. Cell Biol. 2020;219:e201911053. - PMC - PubMed
    1. Barker N, et al. Crypt stem cells as the cells-of-origin of intestinal cancer. Nature. 2009;457:608–611. - PubMed
    1. Visvader JE. Cells of origin in cancer. Nature. 2011;469:314–322. - PubMed
    1. Schwitalla S, et al. Intestinal tumorigenesis initiated by dedifferentiation and acquisition of stem-cell-like properties. Cell. 2013;152:25–38. - PubMed
    1. Shih IM, et al. Top-down morphogenesis of colorectal tumors. Proc. Natl Acad. Sci. USA. 2001;98:2640–2645. - PMC - PubMed

Substances