. 2024 Aug;131(3):457-467.
doi: 10.1038/s41416-024-02722-7. Epub 2024 Jun 20.

The in vitro dynamics of pseudo-vascular network formation

Affiliations

The in vitro dynamics of pseudo-vascular network formation

Mariam-Eleni Oraiopoulou et al. Br J Cancer. 2024 Aug.

Abstract

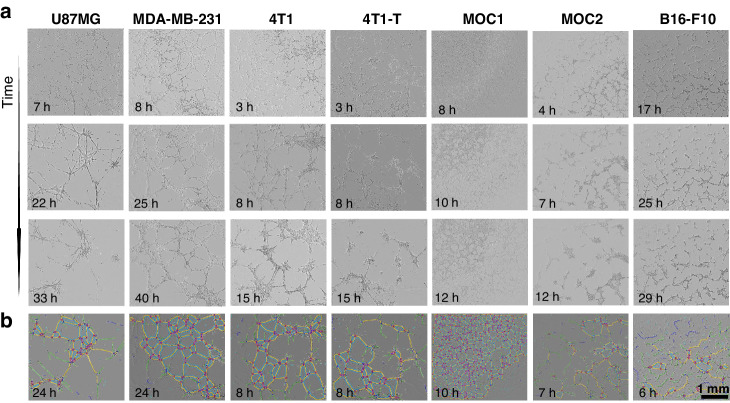
Background/objectives: Pseudo-vascular network formation in vitro is considered a key characteristic of vasculogenic mimicry. While many cancer cell lines form pseudo-vascular networks, little is known about the spatiotemporal dynamics of these formations.

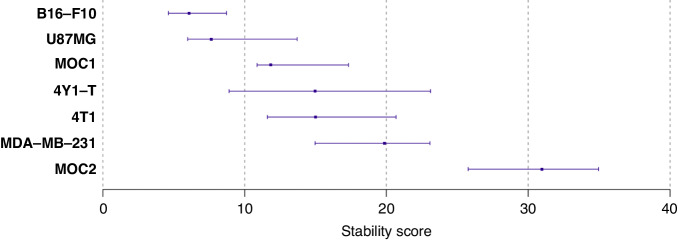
Methods: Here, we present a framework for monitoring and characterising the dynamic formation and dissolution of pseudo-vascular networks in vitro. The framework combines time-resolved optical microscopy with open-source image analysis for network feature extraction and statistical modelling. The framework is demonstrated by comparing diverse cancer cell lines associated with vasculogenic mimicry, then in detecting response to drug compounds proposed to affect formation of vasculogenic mimics. Dynamic datasets collected were analysed morphometrically and a descriptive statistical analysis model was developed in order to measure stability and dissimilarity characteristics of the pseudo-vascular networks formed.

Results: Melanoma cells formed the most stable pseudo-vascular networks and were selected to evaluate the response of their pseudo-vascular networks to treatment with axitinib, brucine and tivantinib. Tivantinib has been found to inhibit the formation of the pseudo-vascular networks more effectively, even in dose an order of magnitude less than the two other agents.

Conclusions: Our framework is shown to enable quantitative analysis of both the capacity for network formation, linked vasculogenic mimicry, as well as dynamic responses to treatment.


Conflict of interest statement

The authors declare no competing interests.

Figures

Fig. 1
Fig. 1. Schematic overview of the framework applied to evaluate pseudo-vascular network dynamics in cancer cell lines.
a Experimental steps (from left to right): cell/ medium component and basement membrane extract scaffold on each well of a 24-well plate, incubation and monitoring by phase contrast microscopy, and subsequent image analysis using Fiji. b Image analysis pipeline (from left to right): the brightfield image is processed into a binary network mask and ‘Angiogenesis Analyzer’ applied to extract a graph segmentation of a representative pseudo-vascular network as shown, along with vectorial object features.
Fig. 2
Fig. 2. Qualitative depiction of pseudo-vascular network dynamics and single time-point graph outputs.
Each column refers to a different cell line. a Optical micrographs for an early, an intermediate and a later timepoint are depicted for each cell line, based on the respective time window over which the networks are formed. b The Fiji graph outputs are shown at the reference timepoint (see also Table 1). Notice that for the B16-F10, a mature pseudo-vascular network has yet to be formed at this point. Scale bar is set to 1 mm.
Fig. 3
Fig. 3. The effect of the meniscus on imaging data.
a Illustration of the meniscus effect within a cell culture well. b Binary masks of whole well with 4T1-T cells forming tubular structures for 3 representative timepoints. Notice that the cellularity of the periphery of the well is low for all timepoints shown. Scale bar is set to 1 mm. c For two morphological objects (number of isolated segments and pieces) for the 4T1-T cell line, average object value (y-axis) versus time (x-axis) is shown for each well (grey dots). Coloured lines correspond to the fit of the third-order polynomial linear model estimated by means of three estimators: the linear regression (dotted lines), the robust regression (dashed lines) and the quantile regression (solid line). Coloured points correspond to wells with outliers.
Fig. 4
Fig. 4. Dissimilarity scores across all cell lines for the vectorial objects extracted.
a Point and interval estimates of dissimilarity scores (x-axis) per object (y-axis) defined based on the object-to-time relationship fitted by means of linear regression. Inference was obtained by means of a hierarchical bootstrap. b Vectorial objects are shown in a graph. c Spearman correlation matrix of the 4000 bootstrap dissimilarity scores aiming to measure the level of association between objects by considering similarities in dissimilarity scores.
Fig. 5
Fig. 5. Quantitative analysis of pseudo-vascular network dynamics comparing all cell lines.
Fit of the relationship between vectorial objects (y-axis) and time (x-axis) according to linear regression estimator per cell line (coloured lines) for 6 morphological objects that can serve as discriminators between the networks formed by the different cell lines. Namely, total network length (a), number of branches (b), number of extremities (c), number of meshes (d), total mesh area (e) and mesh index (f).
Fig. 6
Fig. 6. Cell line stability scores.
Point and interval estimates of stability scores (x-axis) per cell line (y-axis) defined and 95% confidence intervals are shown. Inference was obtained by means of a hierarchical bootstrap. The level of uncertainty in stability scores (95% confidence interval width) is a consequence of the variability of the object values over time (see Supplementary Fig. S3).
Fig. 7
Fig. 7. Drug screening assay demonstrating pseudo-vascular network disruption of different forms by compound.
A Binary masks of the B16-F10 cells forming tubular structures under the absence (control) or presence of 25 μM of axitinib, brucine or tivantinib at the same timepoint (25 h). Scale bar is set to 1 mm. B The effect of each drug on the square root values of the number of the meshes, the mean mesh size and the total mesh area within a range of concentrations. Welch t-tests were used to test the equality of means of each group compared to the control for the different outcomes on the square root scale. Stars are used to show the significance levels of each test.

References

    1. Hu H, Chen Y, Tan S, Wu S, Huang Y, Fu S, et al. The Research Progress of Antiangiogenic Therapy, Immune Therapy and Tumor Microenvironment. Front Immunol. 2022;13:802846. - PMC - PubMed
    1. Maniotis AJ, Folberg R, Hess A, Seftor EA, Gardner LM, Pe’er J, et al. Vascular channel formation by human melanoma cells in vivo and in vitro: vasculogenic mimicry. Am J Pathol. 1999;155:739–52. 10.1016/S0002-9440(10)65173-5 - DOI - PMC - PubMed
    1. Valdivia A, Mingo G, Aldana V, Pinto MP, Ramirez M, Retamal C, et al. Fact or Fiction, It Is Time for a Verdict on Vasculogenic Mimicry? Front Oncol. 2019;9:680. - PMC - PubMed
    1. Muthukrishnan SD, Kawaguchi R, Nair P, Prasad R, Qin Y, Johnson M, et al. P300 promotes tumor recurrence by regulating radiation-induced conversion of glioma stem cells to vascular-like cells. Nat Commun. 2022;13:6202. 10.1038/s41467-022-33943-0 - DOI - PMC - PubMed
    1. Luo Q, Wang J, Zhao W, Peng Z, Liu X, Li B, et al. Vasculogenic mimicry in carcinogenesis and clinical applications. J Hematol Oncol. 2020;13:19. 10.1186/s13045-020-00858-6 - DOI - PMC - PubMed

LinkOut - more resources