. 2024 Jun 20;25(1):622.
doi: 10.1186/s12864-024-10488-8.

Single-nucleus RNA sequencing and lipidomics reveal characteristics of transcriptional and lipid composition in porcine longissimus dorsi muscle

Affiliations

Single-nucleus RNA sequencing and lipidomics reveal characteristics of transcriptional and lipid composition in porcine longissimus dorsi muscle

Lanlan Yi et al. BMC Genomics. .

Abstract

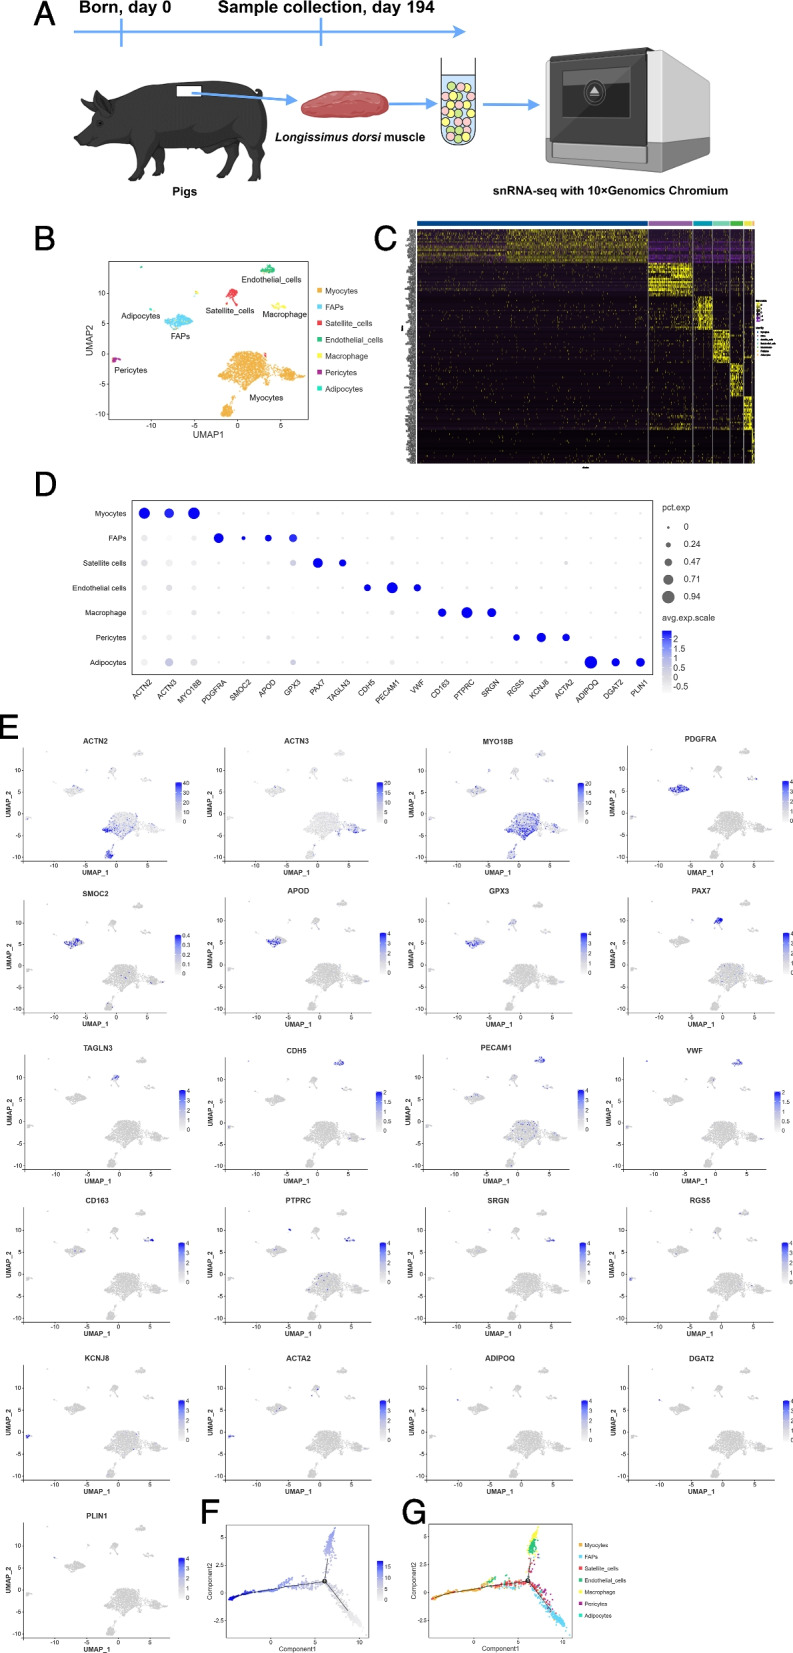
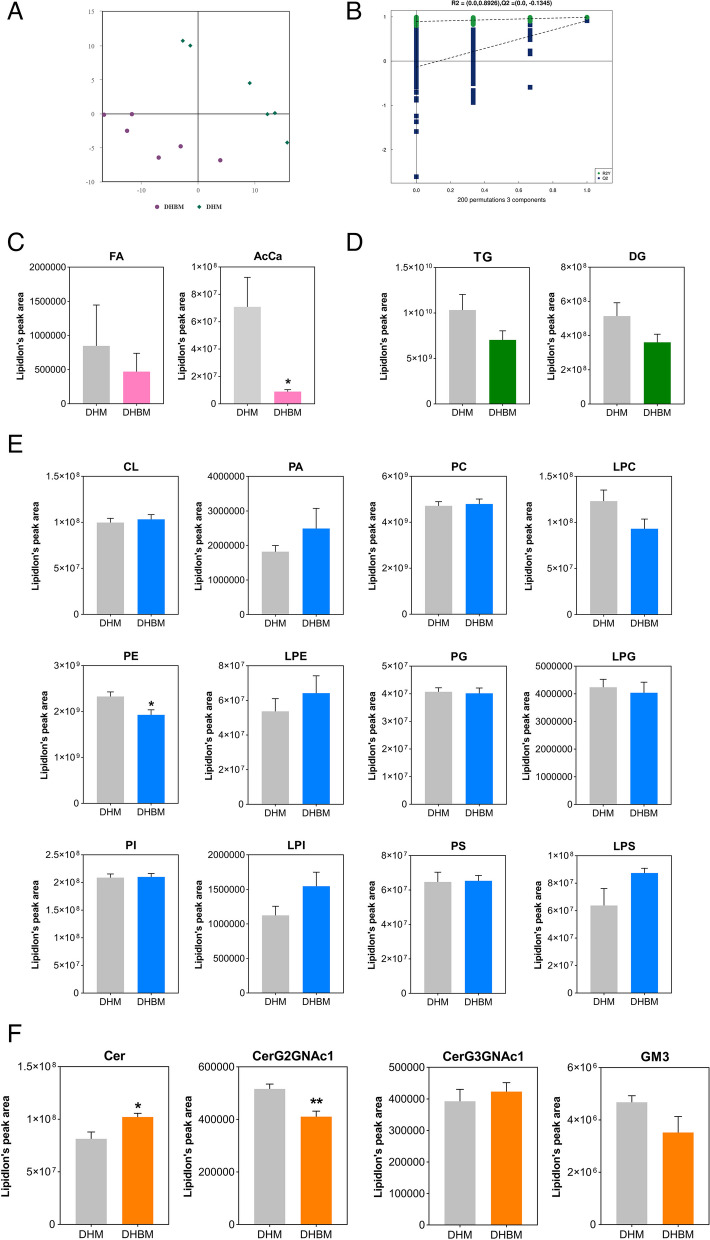
Background: Global per capita meat consumption continues to rise, especially pork. Meat quality is influenced by the content of intramuscular fat (IMF) as a key factor. The longissimus dorsi muscle of Dahe pigs (DHM, IMF: 7.98% ± 1.96%) and Dahe black pigs (DHBM, IMF: 3.30% ± 0.64%) was studied to explore cellular heterogeneity and differentially expressed genes (DEGs) associated with IMF deposition using single-nucleus RNA sequencing (snRNA-seq). The lipid composition was then analyzed using non-targeted lipidomics.

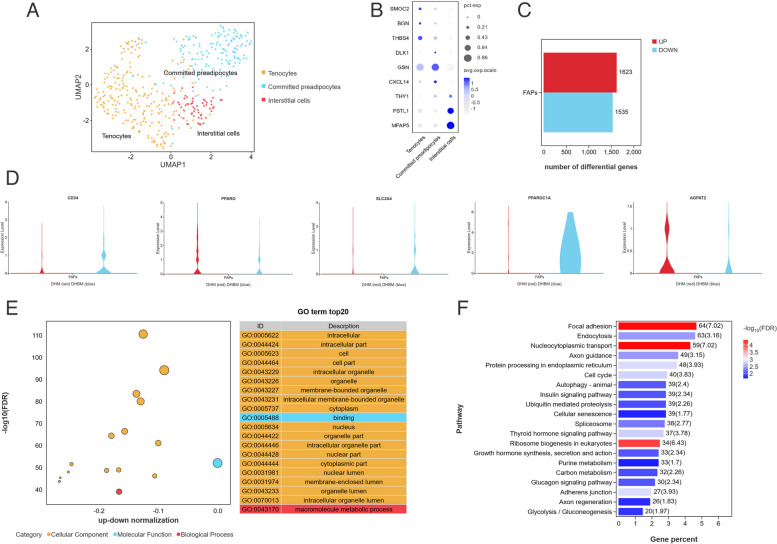
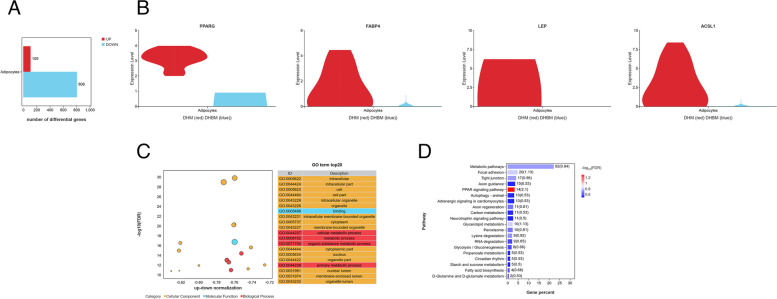
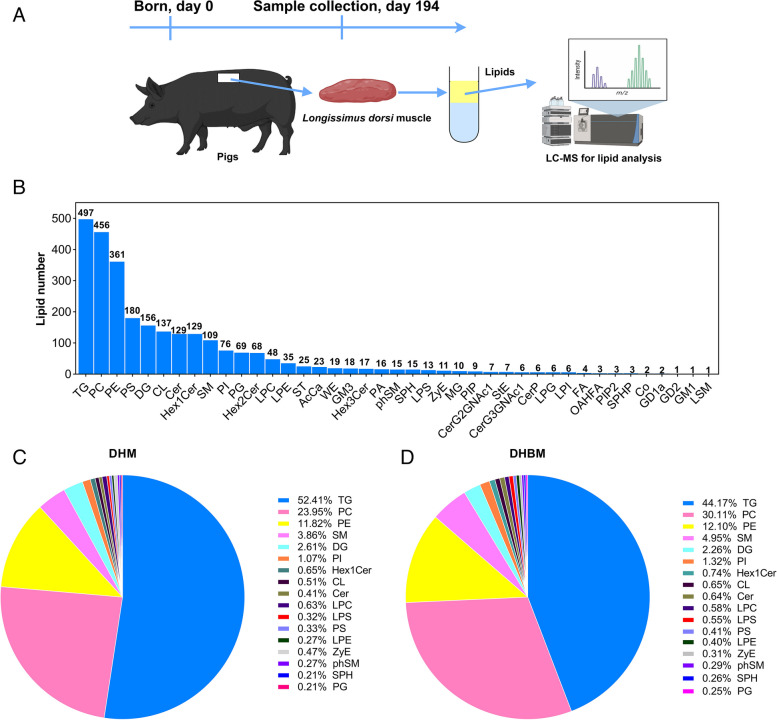
Results: A total of seven cell subpopulations were identified, including myocytes, fibroblast/fibro/adipogenic progenitors (FAPs), satellite cells, endothelial cells, macrophages, pericytes, and adipocytes. Among them, FAPs and adipocytes were more focused because they could be associated with lipid deposition. 1623 DEGs in the FAPs subpopulation of DHBM were up-regulated compared with DHM, while 1535 were down-regulated. These DEGs enriched in the glycolysis/gluconeogenesis pathway. 109 DEGs were up-regulated and 806 were down-regulated in the adipocyte subpopulation of DHBM compared with DHM, which were mainly enriched in the PPAR signaling pathway and fatty acid (FA) biosynthesis. The expression level of PPARG, ABP4, LEP, and ACSL1 genes in DHM was higher than that in DHBM. Lipidomics reveals porcine lipid composition characteristics of muscle tissue. A total of 41 lipid classes and 2699 lipid species were identified in DHM and DHBM groups. The top ten relative peak areas of lipid classes in DHM and DHBM were triglyceride (TG), phosphatidylcholine (PC), phosphatidylethanolamine (PE), phosphatidylserine (PS), diglyceride (DG), cardiolipin (CL), ceramides (Cer), Simple Glc series (Hex1Cer), sphingomyelin (phSM), and phosphatidylinositol (PI). The relative peak areas of 35 lipid species in DHM were lower than DHBM, and 28 lipid species that were higher. There was a significant increase in the TG fatty acyl chains C6:0, C17:0, and C11:4, and a significant decrease in C16:0, C18:1, C18:2, and C22:4 in DHBM (p < 0.05).

Conclusions: C16:0 FA may downregulate the expression level of PPARG gene, which leads to the downregulation of fat metabolism-related genes such as ACSL, PLIN2, and FABP4 in DHBM compared with DHM. This may be the reason that the lipid deposition ability of Dahe pigs is stronger than that of Dahe black pigs, which need further investigation.

Keywords: Longissimus dorsi muscle; Intramuscular fat; Lipidomics; Pigs; snRNA-seq.


Conflict of interest statement

The authors declare no competing interests.

Figures

Fig. 1
Fig. 1
Chemical composition of longissimus dorsi muscle from Dahe pigs and Dahe Black pigs. * means significantly different at p < 0.05
Fig. 2
Fig. 2
snRNA-seq identifies different cell populations in porcine longissimus dorsi muscle. A Protocol for preparing the longissimus dorsi muscle from Dahe pigs and Dahe Black pigs and using it for snRNA-seq. B cell type UMAP plot of longissimus dorsi muscle from two different breeds. The cell color is determined by the cell type, which is associated with different marker genes. C Heatmap of the 20 most DEGs in each of the seven identified cell types. D Dot plot of gene expression of cell-type differentiating markers. The size of the dot represents the expression ratio of the gene in the cell type, and the color represents the normalized value of the average expression level of the cell type. E Marker gene expression used to identify cell type in integrated UMAP. F Pseudotemporal differentiation state of cells. The lighter the color, the earlier the development period. G Pseudotime ordering of all cell types. Dots of the same color represent the same cell type, and each branch represents a cell state
Fig. 3
Fig. 3
Further analysis of FAPs subpopulations and DEGs enrichment analysis. A UMAP diagram of three subclusters of FAPs. B Marker genes are used to distinguish the three subclusters. C The number of DEGs up-regulated/down-regulated by DHBM. D Changes in the expression levels of adipogenesis-related genes (CD34, PPARG, SLC24A, PPARGC1A, and AGPAT2) in FAPs of DHBM. E GO enrichment of DEGs between DHM and DHBM. The larger the bubble, the greater the number of DEGs. Yellow represents cellular components, blue represents molecular functions, and red represents biological processes. The significance of pathways enriched by DEGs is represented by the negative logarithm of the FDR value. F DEGs enrichment of KEGG pathways. The number on each entry represents the number of DEGs
Fig. 4
Fig. 4
Further analysis of DEGs in adipocyte subpopulations. A The number of DEGs up-regulated/down-regulated by DHBM. B Characterization of adipogenesis-related DEGs (PPARG, FABP4, LEP and ACSL1) in DHBM adipocytes. C GO enrichment of DEGs between DHM and DHBM. (D) DEGs enrichment of KEGG pathways
Fig. 5
Fig. 5
Characteristics of the overall lipid composition of the longissimus dorsi muscle of Dahe pigs and Dahe Black pigs. A Porcine longissimus dorsi muscle preparation and protocol for the lipidomic analysis. B Lipid classes were identified in both positive and negative ion modes, along with the number of lipid molecules in each class. CerG3GNAc1: simple Glc series, CerP: ceramides phosphate, CL: cardiolipin, Co: coenzyme, GD1a: gangliosides, GD2: gangliosides, GM1: gangliosides, GM3: gangliosides, Hex1Cer: simple Glc series, Hex2Cer: simple Glc series, Hex3Cer: simple Glc series, LPC: lysophosphatidylcholine, LPE: lysophosphatidylethanolamine, LPG: lysophosphatidylglycerol, LPI: lysophosphatidylinositol, LPS: lysophosphatidylserine, LSM: lysosphingomyelin, MG: monoglyceride, OAHFA: OAcyl-(gamma-hydroxy) FA, PA: phosphatidic acid, PG: phosphatidylglycerol, phSM: sphingomyelin, PIP: phosphatidylinositol, PIP2: phosphatidylinositol, PS: phosphatidylserine, SPH: sphingosine, SPHP: sphingosine phosphate, ST: sulfatide, StE: stigmasterol ester, WE: wax esters, ZyE: zymosterol ester. C In DHM, lipid classes account for more than 1% of all identified lipid classes and were utilized to generate pie charts. D In DHBM, lipid classes account for more than 1% of all identified lipid classes and were utilized to generate pie charts
Fig. 6
Fig. 6
Differences in lipid composition of longissimus dorsi muscle between Dahe pigs and Dahe Black pigs. A A PLS-DA model was constructed using DHM and DHBM samples to show group differences. B Permutation test on PLS-DA model. Lipidlon’s peak area change of (C) fatty acyls (FA and AcCa: acyl carnitine), (D) glycolipids (TG and DG: diglyceride), (E) phospholipids (CL and PA, PC, LPC, PE, LPE, PG, LPG, PI: phosphatidylinositol, LPI, PS, and LPS) and (F) sphingolipids (Cer and CerG2GNAc1: simple Glc series, CerG3GNAc1: simple Glc series, and GM3: gangliosides) in DHM vs DHBM. *p < 0.05, **p < 0.01
Fig. 7
Fig. 7
Differential lipid species of longissimus dorsi muscle between Dahe pigs and Dahe black pigs. A Lipid molecules with significant differences (Variable important in projection, VIP > 1, p < 0.05) are displayed as bubble plots. The ordinate represents each lipid class, distinguished by different colors. Each bubble represents a different lipid species, and the size of the bubble indicates the extent of the difference. B Clustering heatmap of differential lipid species. Each row represents a distinct lipid species, and each column represents a sample. Red represents relatively high expression, while green represents relatively low expression. Named according to the International Lipid Classification and Nomenclature Committee. Lipids are divided into 8 types: Glycerophospholipids, Sphingolipids, Glycerolipids, Sterol lipids, Prenol lipids, Fatty Acyls, Glucosylsphingosine, and Polyketides. Among them, each type is divided into different "classes" based on various polar groups. Each "class" is then divided into different "species" based on the number of carbon atoms in the carbon chain and the number of double bonds. For example, TG (17:0_6:0_11:4) indicates that this triglyceride contains three fatty acyl groups, namely 17:0, 6:0, and 11:4 fatty acids. C All lipid species with significant differences in the PI and TG categories were identified using VIP > 1 and *p < 0.05. D Pearson correlation analysis of differential lipid species. Red indicates a positive correlation, while blue indicates a negative correlation. The color becomes more intense as the correlation coefficient increases. E Spearman correlation between differential lipid species and differential genes related to lipogenesis in adipocytes. Red indicates a positive correlation, while blue indicates a negative correlation. *p < 0.05, **p < 0.01. F Transcriptional patterns of lipid metabolism-related genes in the longissimus dorsi muscle of Dahe Black pigs

References

    1. Singh B, Khan AA, Anamika F, Munjal R, Munjal J, Jain R. Red Meat Consumption and its Relationship With Cardiovascular Health: A Review of Pathophysiology and Literature. Cardiol Rev. 2023. 10.1097/CRD.0000000000000575. - PubMed
    1. Zeng Q, Du ZQ. Advances in the discovery of genetic elements underlying longissimus dorsi muscle growth and development in the pig. Anim Genet. 2023;54(6):709–720. doi: 10.1111/age.13365. - DOI - PubMed
    1. Yi W, Huang Q, Wang Y, Shan T. Lipo-nutritional quality of pork: The lipid composition, regulation, and molecular mechanisms of fatty acid deposition. Anim Nutr. 2023;7(13):373–385. doi: 10.1016/j.aninu.2023.03.001. - DOI - PMC - PubMed
    1. Yan E, Guo J, Yin J. Nutritional regulation of skeletal muscle energy metabolism, lipid accumulation and meat quality in pigs. Anim Nutr. 2023;7(14):185–192. doi: 10.1016/j.aninu.2023.04.009. - DOI - PMC - PubMed
    1. Gao SZ, Zhao SM. Physiology, affecting factors and strategies for control of pig meat intramuscular fat. Recent Pat Food Nutr Agric. 2009;1(1):59–74. doi: 10.2174/2212798410901010059. - DOI - PubMed