. 2024 Jun 20;22(1):254.
doi: 10.1186/s12916-024-03475-z.

Circulating small extracellular vesicles in Alzheimer's disease: a case-control study of neuro-inflammation and synaptic dysfunction

Affiliations

Circulating small extracellular vesicles in Alzheimer's disease: a case-control study of neuro-inflammation and synaptic dysfunction

Rishabh Singh et al. BMC Med. .

Abstract

Background: Alzheimer's disease (AD) is a neurodegenerative disease characterized by Aβ plaques and neurofibrillary tangles. Chronic inflammation and synaptic dysfunction lead to disease progression and cognitive decline. Small extracellular vesicles (sEVs) are implicated in AD progression by facilitating the spread of pathological proteins and inflammatory cytokines. This study investigates synaptic dysfunction and neuroinflammation protein markers in plasma-derived sEVs (PsEVs), their association with Amyloid-β and tau pathologies, and their correlation with AD progression.

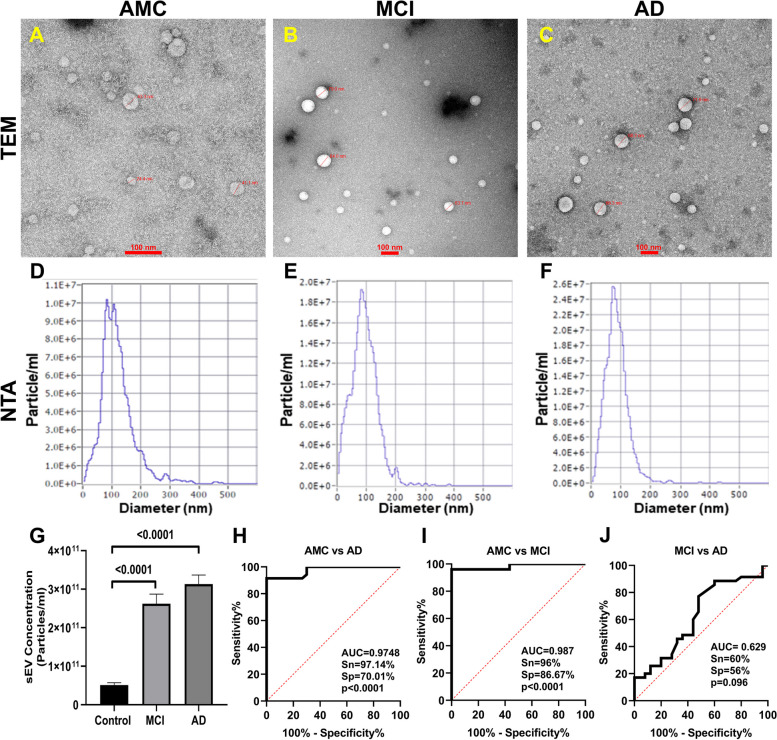
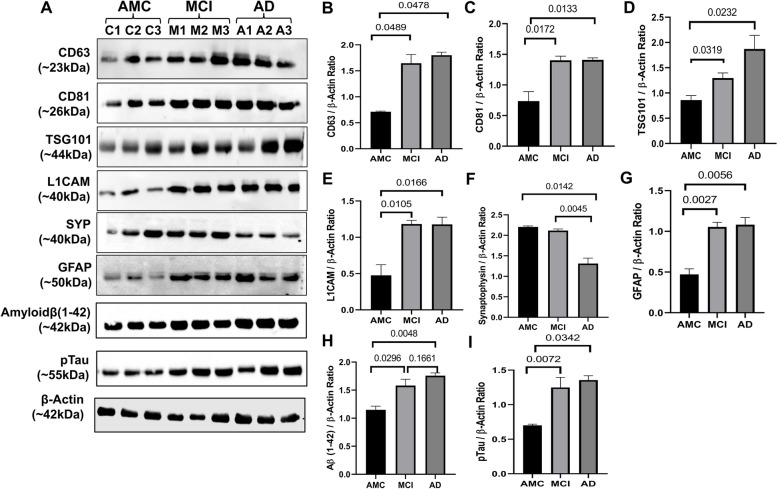
Methods: A total of 90 [AD = 35, mild cognitive impairment (MCI) = 25, and healthy age-matched controls (AMC) = 30] participants were recruited. PsEVs were isolated using a chemical precipitation method, and their morphology was characterized by transmission electron microscopy. Using nanoparticle tracking analysis, the size and concentration of PsEVs were determined. Antibody-based validation of PsEVs was done using CD63, CD81, TSG101, and L1CAM antibodies. Synaptic dysfunction and neuroinflammation were evaluated with synaptophysin, TNF-α, IL-1β, and GFAP antibodies. AD-specific markers, amyloid-β (1-42), and p-Tau were examined within PsEVs using Western blot and ELISA.

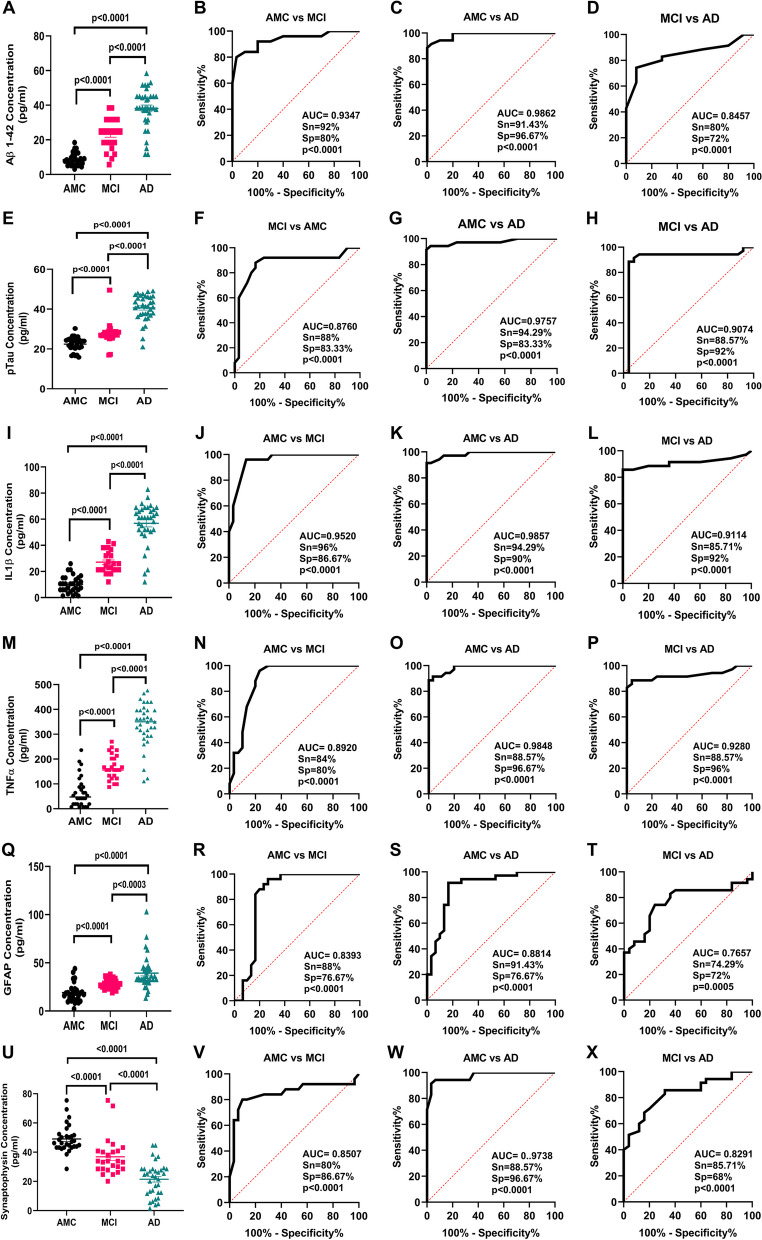
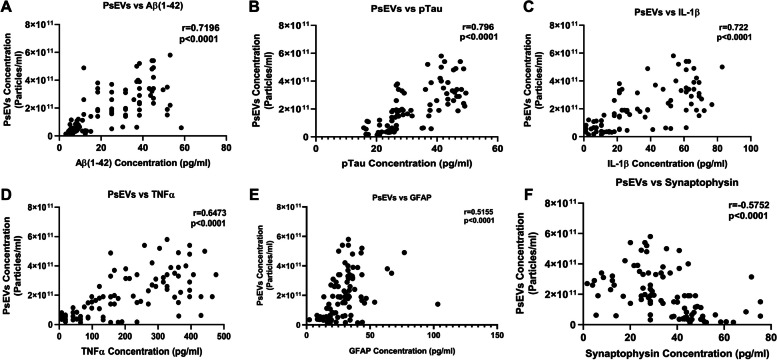
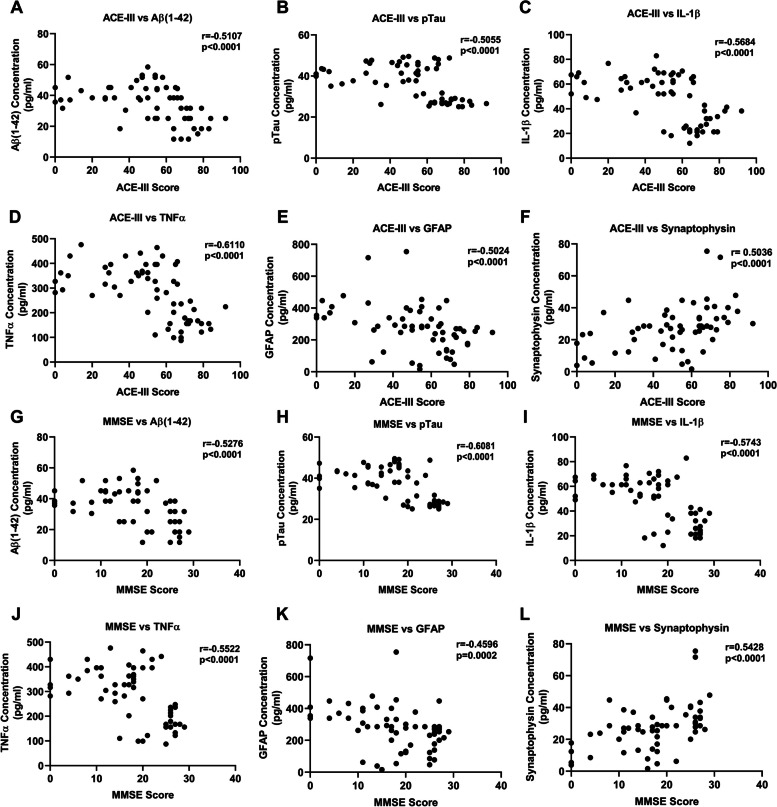
Results: Our findings reveal higher concentrations of PsEVs in AD and MCI compared to AMC (p < 0.0001). Amyloid-β (1-42) expression within PsEVs is significantly elevated in MCI and AD compared to AMC. We could also differentiate between the amyloid-β (1-42) expression in AD and MCI. Similarly, PsEVs-derived p-Tau exhibited elevated expression in MCI compared with AMC, which is further increased in AD. Synaptophysin exhibited downregulated expression in PsEVs from MCI to AD (p = 0.047) compared to AMC, whereas IL-1β, TNF-α, and GFAP showed increased expression in MCI and AD compared to AMC. The correlation between the neuropsychological tests and PsEVs-derived proteins (which included markers for synaptic integrity, neuroinflammation, and disease pathology) was also performed in our study. The increased number of PsEVs correlates with disease pathological markers, synaptic dysfunction, and neuroinflammation.

Conclusions: Elevated PsEVs, upregulated amyloid-β (1-42), and p-Tau expression show high diagnostic accuracy in AD. The downregulated synaptophysin expression and upregulated neuroinflammatory markers in AD and MCI patients suggest potential synaptic degeneration and neuroinflammation. These findings support the potential of PsEV-associated biomarkers for AD diagnosis and highlight synaptic dysfunction and neuroinflammation in disease progression.

Keywords: Alzheimer’s disease; Mild cognitive impairment; Neuroinflammation; Small extracellular vesicles; Synaptic dysfunction.


Conflict of interest statement

The authors declare no competing interests.

Figures

Fig. 1
Fig. 1
Isolation and analysis of PsEVs. The isolated PsEV morphology characterize by transmission electron microscopy from age-matched healthy controls (AMC) (A), mild-cognitive impairment (MCI) patients (B), and Alzheimer’s disease (AD) (C). The size distribution of PsEVs subpopulation (nm) versus the concentration (particle/ml) in AMC (D), individuals with MCI (E), and AD (F). Comparison of the sEVs concentration of AD, MCI, and AMC patients (G). Receiver operating characteristic (ROC) curve of PsEVs concentration in AMC v/s AD (H), AMC v/s MCI (I), and MCI v/s AD (J) (scale bar 100 nm)
Fig. 2
Fig. 2
Validation of PsEVs expression analysis of different markers in PsEVs in age-matched controls (AMC), mild cognitive impairment (MCI), and Alzheimer’s disease patients (AD) (A). Densitometric analysis of CD63 (B), densitometric analysis of CD81 (C), densitometric analysis of TSG101 (D), densitometric analysis of L1CAM (E), densitometric analysis of synaptophysin (F), densitometric analysis of GFAP (G), and densitometric analysis of amyloid-β (1–42) oligomer (H). All densitometric values were normalized against β-actin
Fig. 3
Fig. 3
PsEVs derived amyloid-β (1–42), p-Tau, IL-1β, TNF-α, GFAP, and synaptophysin protein concentration was measured. ELISA results in A shows levels of PsEVs amyloid-β (1–42) in AMC, MCI, and AD and receiver operating characteristic (ROC) curve of PsEVs concentration in AMC v/s MCI (B), AMC v/s AD (C), and MCI v/s AD (D). Similarly, p-Tau concentration in AMC, MCI, and AD (E), ROC curve of PsEVs concentration in AMC v/s MCI (F), AMC v/s AD (G), and MCI v/s AD (H). PsEVs derived IL-1β concentration in AMC, MCI and AD (I), ROC curve of PsEVs concentration in AMC v/s MCI (J), AMC v/s AD (K), and MCI v/s AD (L). PsEVs derived TNF-α concentration in AMC, MCI and AD (M), ROC curve of PsEVs concentration in AMC v/s MCI (N), AMC v/s AD (O), and MCI v/s AD (P). Similarly, GFAP concentration in AMC, MCI, and AD (Q), ROC curve of PsEVs concentration in AMC v/s MCI (R), AMC v/s AD (S), and MCI v/s AD (T). For PsEVs-derived synaptophysin concentration in AMC, MCI, and AD (U), ROC curve of PsEVs concentration in AMC v/s MCI (V), AMC v/s AD (W), and MCI v/s AD (X). Abbreviations: AMC, age-matched control; MCI, mild-cognitive impairment patients; AD, Alzheimer’s disease patients; TNF-α, tumor necrosis factor-alpha; GFAP, glial fibrillary acidic protein
Fig. 4
Fig. 4
Correlation analysis between PsEVs concentration and PsEVs derived AD pathology markers. The correlation between PsEVs concentration with the amyloid-β (1–42) (A), p-Tau (B), IL-1β (C), TNF-α (D), GFAP (E), and synaptophysin (F). Abbreviations: p-Tau, Phospho-Tau, TNF-α, tumor necrosis factor-alpha; GFAP, glial fibrillary acidic protein. Spearman correlation was used for correlation analysis
Fig. 5
Fig. 5
Correlation between neuropsychological test (ACE-III and MMSE) and PsEV-derived AD pathology markers. Amyloid-β (1–42) β, p-Tau, IL-1β, TNF-α, GFAP, and synaptophysin protein concentration. AF Correlation between ACE-III scores and amyloid-β (1–42) (A), pTau (B), IL-1β (C), TNF-α (D), GFAP (E), and synaptophysin (F) protein concentration. GL A correlation between MMSE Score and amyloid-β (1–42) (G), p-Tau (H), IL-1β (I), TNF-α (J), GFAP (K), and synaptophysin (L) protein concentration. Abbreviations: ACE-III, Addenbrooke Cognitive Examination; MMSE, Mini-Mental State Examination; p-Tau, Phospho-Tau; TNF-α, tumor necrosis factor-alpha; GFAP, glial fibrillary acidic protein. Spearman correlation was used for correlation analysis

References

    1. Suescun J, Chandra S, Schiess MC. Chapter 13 - The role of neuroinflammation in neurodegenerative disorders. In: Actor JK, Smith KC, editors. Translational Inflammation. Academic Press; 2019. pp. 241–267.
    1. DiSabato DJ, Quan N, Godbout JP. Neuroinflammation: the devil is in the details. J Neurochem. 2016;139(S2):136–153. doi: 10.1111/jnc.13607. - DOI - PMC - PubMed
    1. Lyman M, Lloyd DG, Ji X, Vizcaychipi MP, Ma D. Neuroinflammation: the role and consequences. Neurosci Res. 2014;79:1–12. doi: 10.1016/j.neures.2013.10.004. - DOI - PubMed
    1. Mishra A, Kim HJ, Shin AH, Thayer SA. Synapse loss induced by interleukin-1β requires pre- and post-synaptic mechanisms. J Neuroimmune Pharmacol. 2012;7(3):571–578. doi: 10.1007/s11481-012-9342-7. - DOI - PMC - PubMed
    1. Subramanian J, Savage JC, Tremblay MÈ. Synaptic loss in Alzheimer’s disease: mechanistic insights provided by two-photon in vivo imaging of transgenic mouse models. Front Cell Neurosci. 2020;14:592607. doi: 10.3389/fncel.2020.592607. - DOI - PMC - PubMed

Publication types