[Preprint]. 2024 Apr 24:2024.04.24.589078.
doi: 10.1101/2024.04.24.589078.

Single-nucleus RNA/ATAC-seq in early-stage HCM models predicts SWI/SNF-activation in mutant-myocytes, and allele-specific differences in fibroblasts

Affiliations

Single-nucleus RNA/ATAC-seq in early-stage HCM models predicts SWI/SNF-activation in mutant-myocytes, and allele-specific differences in fibroblasts

Tilo Thottakara et al. bioRxiv. .

Abstract

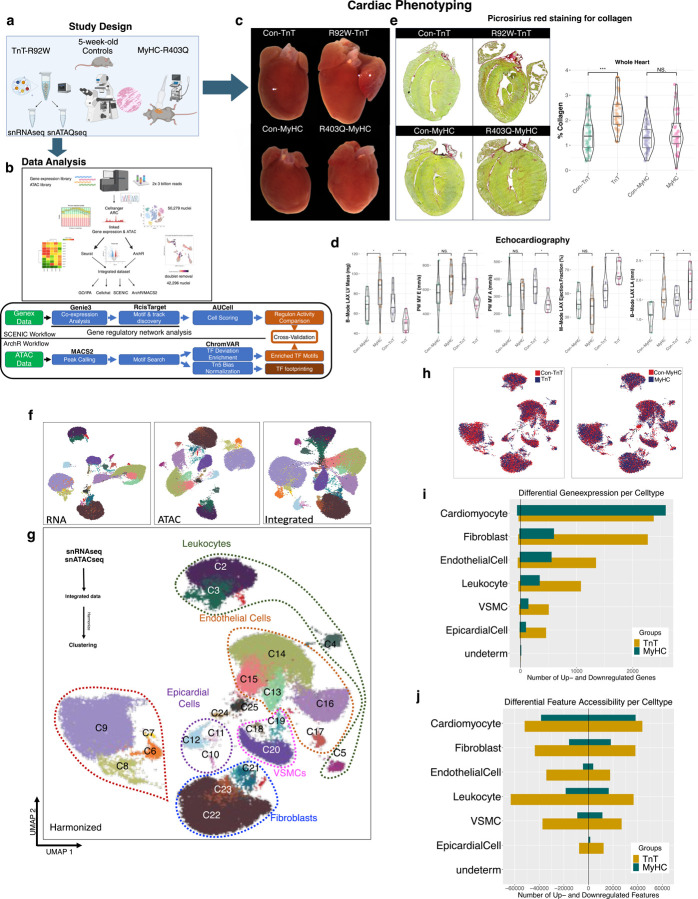
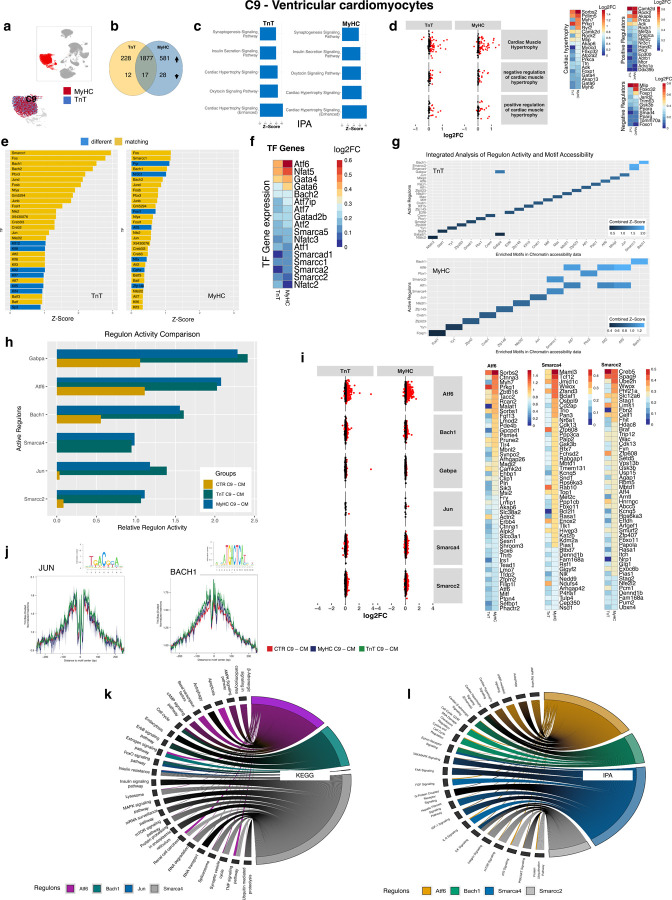
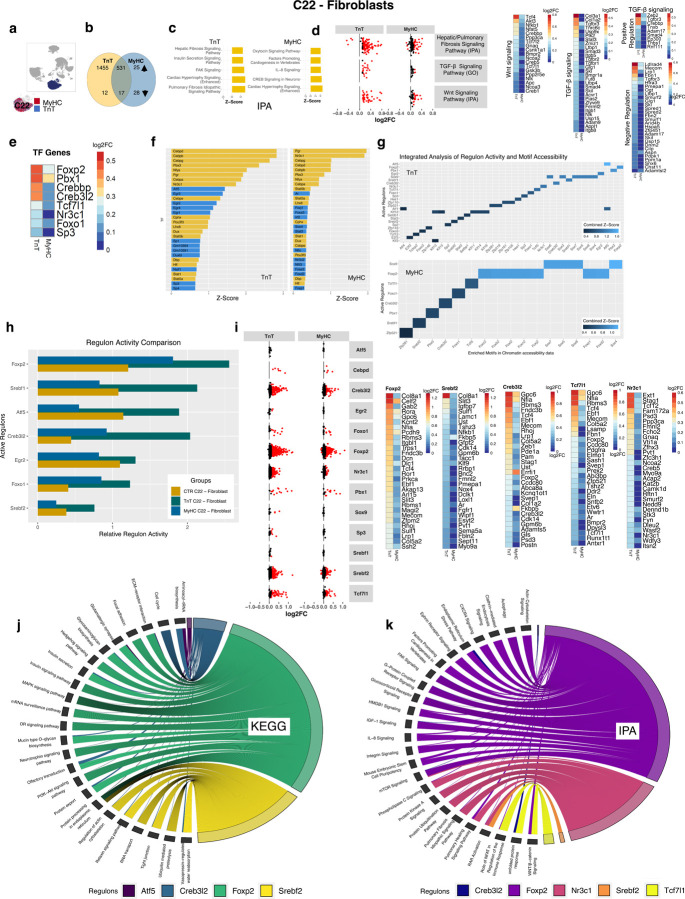
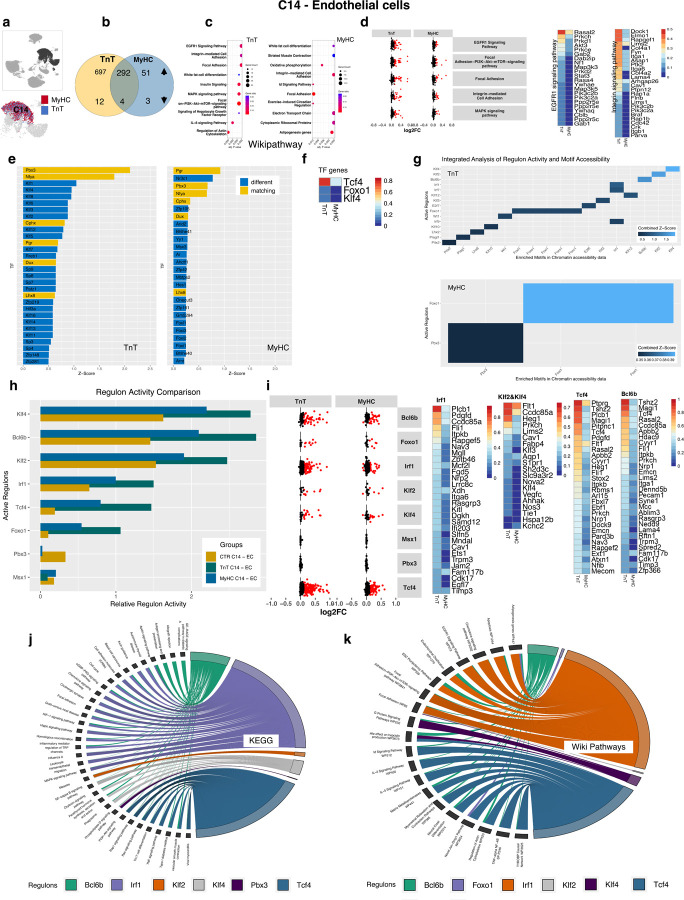
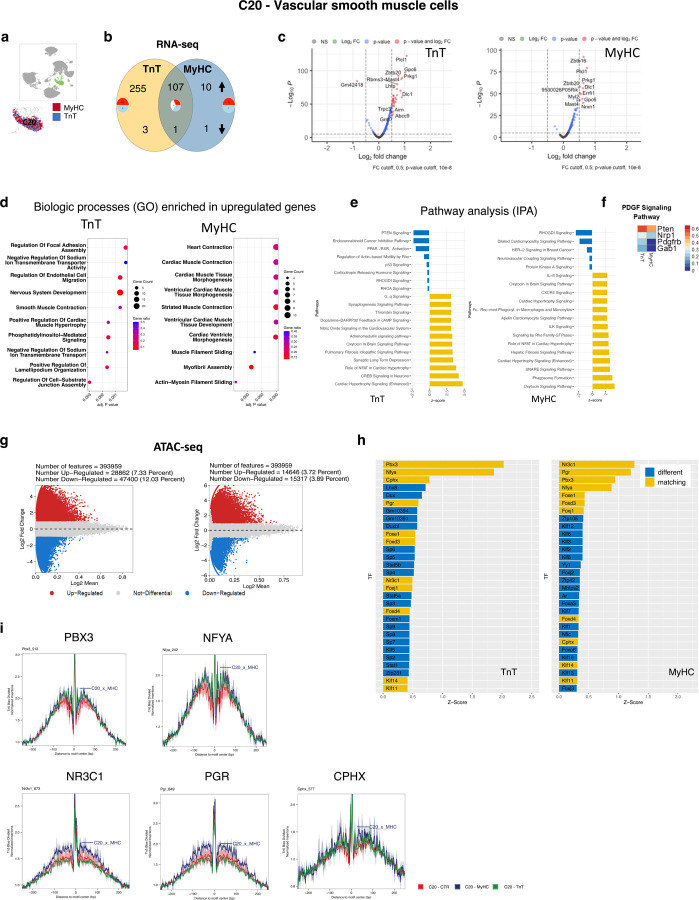
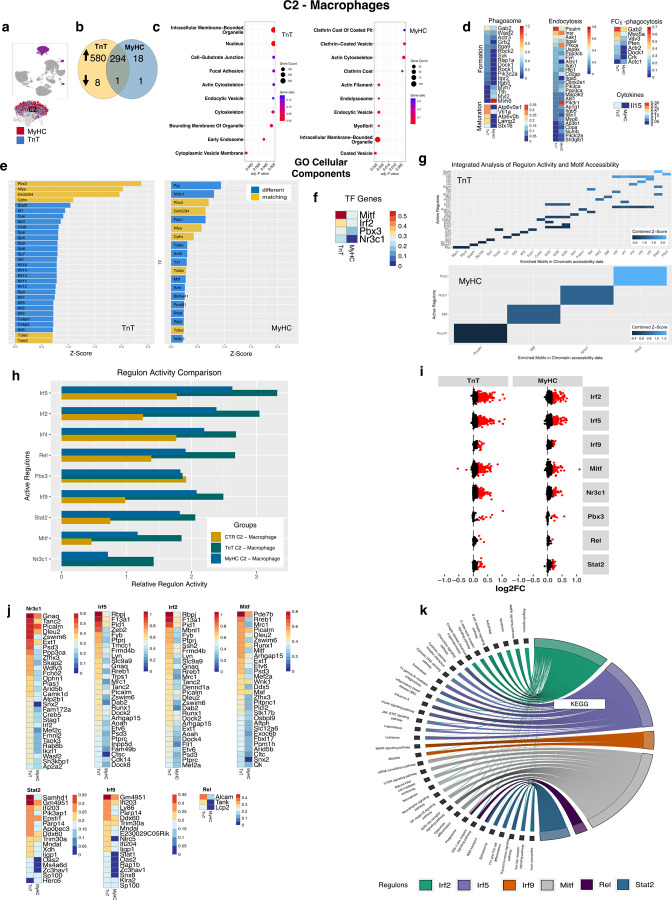
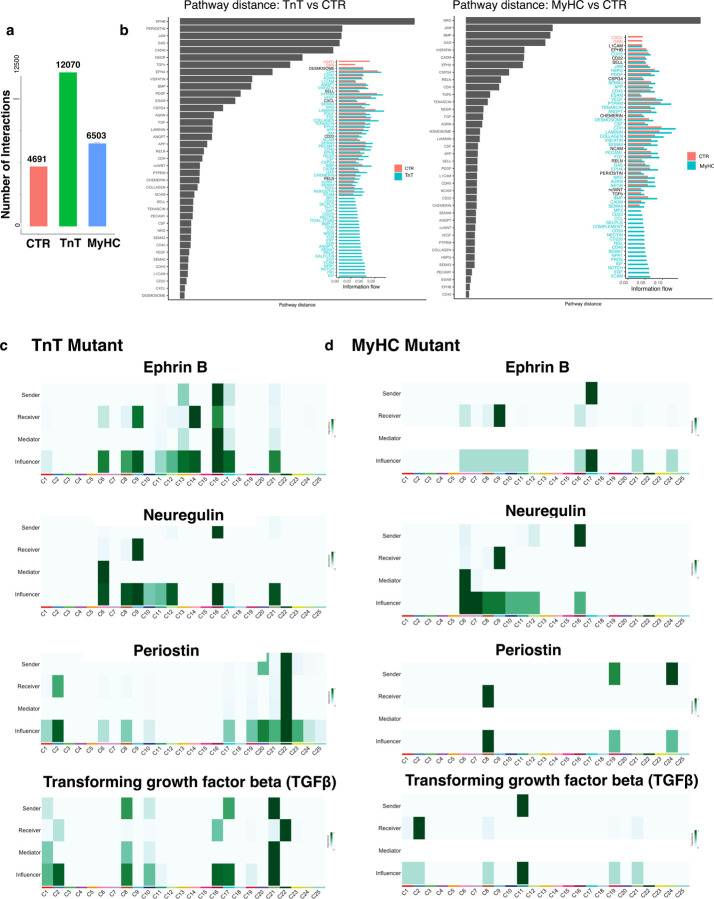
Hypertrophic cardiomyopathy (HCM) is associated with phenotypic variability. To gain insights into transcriptional regulation of cardiac phenotype, single-nucleus linked RNA-/ATAC-seq was performed in 5-week-old control mouse-hearts (WT) and two HCM-models (R92W-TnT, R403Q-MyHC) that exhibit differences in heart size/function and fibrosis; mutant data was compared to WT. Analysis of 23,304 nuclei from mutant hearts, and 17,669 nuclei from WT, revealed similar dysregulation of gene expression, activation of AP-1 TFs (FOS, JUN) and the SWI/SNF complex in both mutant ventricular-myocytes. In contrast, marked differences were observed between mutants, for gene expression/TF enrichment, in fibroblasts, macrophages, endothelial cells. Cellchat predicted activation of pro-hypertrophic IGF-signaling in both mutant ventricular-myocytes, and profibrotic TGFβ-signaling only in mutant-TnT fibroblasts. In summary, our bioinformatics analyses suggest that activation of IGF-signaling, AP-1 TFs and the SWI/SNF chromatin remodeler complex promotes myocyte hypertrophy in early-stage HCM. Selective activation of TGFβ-signaling in mutant-TnT fibroblasts contributes to genotype-specific differences in cardiac fibrosis.


Conflict of interest statement

Competing Interests statement The authors declare no competing interests.

Figures

Figure 1.
Figure 1.. Study design, Cardiac phenotyping, Single nucleus data analysis.
a. R92W-TnT and R403Q-MyHC mutant and littermate control mice were studied by echocardiography, histology, single-nuclei RNA- and ATAC-seq, at 5 weeks of age (early disease stage). Mutants were compared to littermate controls. b. Nuclei were isolated from the right and left ventricles (RV, LV) and atrial appendages (RAA, LAA). Single-nuclei gene-expression and ATAC libraries were obtained from the same nuclei, sequenced, and analyzed using Seurat, ArchR, SCENIC, CellChat. c. Cardiac morphology: Allele-specific cardiac remodeling was evident at early 5 weeks of age. Representative images show bi-atrial enlargement associated with smaller LV in TnT mutants and larger LV in MyHC mutants. d. Echocardiography: LV mass was significantly lower in TnT mutants and higher in MyHC mutants compared to littermate controls. Mitral E and A velocities, LV ejection fraction and LA diameter were significantly higher in TnT mutant. Welch’s t test: * p<05; ** p<0.01; *** p<0.001 e. Histology: Picrosirius red staining for collagen, revealed increased interstitial fibrosis only in TnT mutant hearts. Welch’s t test: * p<05; ** p<0.01; *** p<0.001 f. RNAseq and ATACseq data was integrated after dimensionality reduction, and harmonized. UMAP projection of all clusters based on RNAseq and ATACseq alone, following integration and harmonization, is shown. g. Cell identity of clusters obtained after integration and harmonization is presented. While most clusters could be assigned to a cell type, the identity of two clusters could not be clearly assigned. h. Experimental group identity is projected on the UMAP. All cell types could be identified in all groups. i. RNA-seq: Differential gene expression in TnT and MyHC mutants, compared to littermate controls for each cell type shows significant upregulation (adj. p<0.05) of the majority of differentially expressed genes (DEGs) in both mutants. TnT mutants have greater dysregulation of gene expression than MyHC mutants.j. ATAC-seq: Differences in chromatin accessibility are more pronounced in TnT mutant hearts, when compared to MyHC mutants. Non-myocyte cells show greater changes (FDR < 0.05) in chromatin accessibility than cardiomyocytes.
Figure 2.
Figure 2.. Ventricular cardiomyocytes (C9).
a. ATAC- and RNA-seq: cell identity for each mutant in C9 (ventricular cardiomyocyte cluster) is presented. b. RNA-seq: Differentially-expressed genes (DEGs) in mutant cardiomyocytes were normalized to WT myocytes. Venn diagram shows majority of DEGs are upregulated in both mutant cardiomyocytes (adj. p<0.05). c. RNA-seq: Strong activation of cardiac hypertrophy signaling is predicted in both mutant cardiomyocytes by IPA, using all DEGs (adj. p<0.05); top 5 predicted pathways are presented. d. RNA-seq: Scatter plot and heat map of cardiac hypertrophy gene sets (AmiGO) in mutant MyHC cardiomyocytes compared to mutant TnT. (Red dots represent DEGs with adj. p<0.01, in cardiac hypertrophy gene sets). e. ATAC-seq: Bar graphs show the 30 most enriched TF motifs (FDR ≤ 0.05) in each mutant compared to WT, with yellow bars representing common motifs and blue bars distinct ones. Marked overlap (23/30) in TF motif enrichment in mutant cardiomyocytes, with higher z scores in mutant TnT. f. RNA-seq: Heatmap of differentially-expressed TF genes (adj p<0.05) identified by chromatin accessibility analysis, regulon analysis, GO pathway. g. Activated TF predicted by SCENIC and ArchR analysis: z-score for regulon activity and TF-motif-enrichment were aggregated (mean). TFs with high combined z-scores are presented. Bach1 and Smarcc1 have high combined z-scores (z ≥1.2) in both mutant ventricular cardiomyocytes.h. RNA-seq: Differential regulon activation in cardiomyocytes from mutants and WT. Smarcc and Jun are activated in both mutant cardiomyocytes, with very little activation in WT. i. RNA-seq: Scatter plot and heatmaps of regulon genes in mutant cardiomyocytes compared to WT. (Red dots represent differentially expressed regulon genes with adj p<0.01). Top 30 regulon genes are presented in the heat maps. j. ATAC-seq: Bulk TF footprinting across the mutant and WT genomes showed higher occupancy of Jun and Bach1 motifs in both mutant cardiomyocytes, compared to WT. k. RNA-seq: Top 10 processes enriched in differentially-expressed regulons genes, predicted by KEGG and IPA, by cross-referencing regulon genes with KEGG or IPA gene set lists. Matches with p<0.01 (Fisher exact test) were considered significant.
Figure 3.
Figure 3.. Cardiac fibroblasts (C22).
a. Three clusters were identified as fibroblasts, of which C22 was the largest. b. RNA-seq: Greater dysregulation of gene expression in mutant TnT fibroblasts, when compared to mutant MyHC. Most dysregulated genes are upregulated in fibroblasts from both mutants (adj p< 0.05). c. RNA-seq: Top 5 signaling pathways predicted to be activated by ingenuity pathway analysis (IPA) using all differentially expressed genes (DEGs) with adj. p<0.05. Activation of fibrosis signaling was only predicted in mutant TnT fibroblasts. d. RNA-seq: Analysis of IPA and GO gene lists for profibrotic signaling pathways Wnt and TGF-β, revealed greater dysregulation of gene expression in mutant TnT fibroblasts, when compared to MyHC mutants. (Red dots represent DEGs with adj. p<0.01). All DEGs in Wnt and TGFβ signaling pathways are presented in the heat maps. e. RNA-seq: Heatmap of differentially-expressed TF genes (adj. p<0.05) identified by chromatin accessibility analysis, regulon analysis, and previously described to be involved in fibrosis. Foxp2, Pbx1, Crebbp and Creb3l2 are the top 4 differentially-expressed TF genes in fibroblasts from both mutants. f. ATAC-seq: Bar graphs shows the 30 most enriched TF motifs (FDR ≤ 0.05) in mutant fibroblasts compared to controls. Mutant TnT fibroblasts show greater chromatin remodeling, when compared to mutant MyHC. Agreement (yellow bars) between the 2 mutants was observed for 14/30 motifs. g. RNA-seq and ATAC-seq: Integration of motif accessibility and the regulon activity showing a combined (average) z-score. ATF5 and FOXP2 had the highest z-score (z >1.2) in mutant TnT fibroblasts, and several members of the SOX and FOX family of TFs had the highest z-score (z >1) in mutant MyHC fibroblasts. h. RNA-seq: Relative regulon activity in mutant and littermate control fibroblasts show stronger TF activation in mutant TnT fibroblasts. i. RNA-seq: Scatter plot and heatmaps of regulon genes in mutant fibroblasts compared to controls. (Red dots represent differentially-expressed regulon genes with adj p<0.01). Top 30 regulon genes are presented in the heat maps. j, k. RNA-seq: Biologic processes associated with differentially-expressed regulon genes in fibroblasts from TnT and MyHC mutants, predicted by KEGG and IPA; band thickness reflects number of matching genes.
Figure 4.
Figure 4.. Endothelial cells (ECs, C14).
a. RNA-, ATAC-seq: Five EC clusters with C14 being the largest. b. RNA-seq: Greater dysregulation (adj. p<0.05) of genes in mutant TnT, when compared to mutant MyHC; most dysregulated genes are upregulated. c. RNA-seq: Top 10 activated signaling pathways in ECs, predicted by Wikipathway GSEA, using upregulated genes (adj. p<0.05). EGFR1 and MAPK signaling activation is only predicted in mutant TnT ECs, whereas focal adhesion and integrin-mediated cell adhesion is predicted in both mutants. d. RNA-seq: Scatter-plot and heatmaps for genes in signaling pathways, predicted by Wikipathways. Mutant TnT ECs had greater dysregulation of genes involved in EGFR1, MAPK, focal adhesion and integrin-mediated signaling, when compared to mutant MyHC. (Red dots represent genes with adj. p<0.01) All DEGs in EGFR1 and integrin signaling pathways are presented in the heat maps. e. ATAC-seq: Bar graphs shows the 30 most enriched TF motifs (FDR ≤ 0.05) in mutant ECs compared to WT. Differential TF motif enrichment shows marked differences between mutant ECs, with only 6/30 matches (PBX3, NFYA, PGR, CPHX, DUX, LHX3); several members of the KLF family of TFs were only enriched in mutant TnT ECs. f. RNA-seq: Differential expression (adj. p<0.05) of TF genes identified by motif enrichment analysis shows higher expression of Tcf4 in both mutant ECs; Foxo1, Klf4 expression was only increased in mutant TnT ECs. g. RNA-seq and ATAC-seq: Integration of motif accessibility and regulon activity by combined (average) z-score shows z >1.5 for Klf2, Klf4 in mutant TnT ECs; no regulons with z >1.0 were identified in mutant MyHC. h. RNA-seq: Differential regulon activity analysis shows highest activity for Klf2, Klf4, Bcl6b, Irf1, Tcf4, Foxo1 regulons in mutant TnT ECs. i. RNA-seq: Scatter-plot and heat maps of regulon genes shows greater upregulation of genes for Bcl6b, Irf1, Tcf4 in TnT mutant ECs, when compared to MyHC mutants. (Red dots represent differentially expressed regulon genes with adj p<0.01). Heat maps show top 30 differentially-expressed regulon genes. j,k. RNA-seq: Biologic processes associated with regulon genes were identified by cross-referencing with KEGG and Wikipathways gene set lists. Matches with p<0.01 were considered significant.
Figure 5.
Figure 5.. Vascular smooth muscle cells.
a. Three clusters were identified as VSMCs, with C20 being the largest. b. RNA-seq: Differentially expressed genes (adj p<0.05) in mutants normalized to WT shows greater numbers of upregulated genes in mutant TnT VSMCs when compared to mutant MyHC. c. RNA-seq: Volcano plot of DEGs in both mutants compared to WT. d. RNA-seq: Top 10 GO biologic processes enriched in mutant VSMCs using all DEGs include ‘regulation of focal adhesion’, ‘endothelial cell migration’ and ‘smooth muscle contraction’ only in mutant TnT VSMCs. e. RNA-seq: IPA analysis of all DEGs predicts activation of NO signaling in mutant TnT ECs, and fibrosis signaling in both mutants. f. RNA-seq: Four genes in the PDGF signaling pathway are dysregulated in mutants. g. ATAC-seq: Mutant TnT VSMCs have greater numbers of differentially-accessible features when compared to mutant MyHC. h. ATAC-seq: Bar graph shows the 30 most enriched (FDR ≤ 0.05) TF motifs. Yellow bars represent common motifs and blue bars distinct ones: 11/30 TF motifs (including PBX3, NYFA, NR3C1, PGR) are enriched in both mutant VSMCs. i. ATAC-seq: Bulk TF footprinting across the mutant and control genomes showed increased occupancy of PBX3, NYFA in both mutant VSMCs, and NR3C1, PGR, CPHX motifs only in mutant MyHC.
Figure 6.
Figure 6.. Cardiac macrophages (C2).
a. RNA- and ATAC-seq: C2 (cardiac macrophages) is the largest leukocyte cluster. b. RNA-seq: Mutant TnT macrophages show greater dysregulation (adj p<0.05) of gene expression than mutant MyHC, with most dysregulated genes being upregulated. c. RNA-seq: Top 10 pathways predicted to be enriched by GO Cellular Component pathway analysis using all DEGs. Activation of endocytosis and phagocytosis was predicted in both mutants, with more genes matching in the TnT mutant. d. RNA-seq: Heatmap for DEGs for phagosome formation, maturation, endocytosis, FC receptor-mediated phagocytosis show greater upregulation in mutant TnT. Cytokine gene expression analysis showed a small statistically significant upregulation of IL-15 gene expression in mutant TnT macrophages. (Red dots represent DEGs with adj p<0.01); all DEGs in GO genesets for phagosome formation, maturation, endocytosis, Fc phagocytosis, cytokine genes are presented in the heat maps. e. ATAC-seq: Top 30 differentially-accessible TF motifs (FDR ≤ 0.05) in mutants compared to WT. Marked differences are seen between mutants; 6/30 TF motifs, including PBX3, NFYA, CPHX showed higher accessibility in both mutants, with greater changes in mutant TnT when compared to mutant MyHC. f. RNA-seq: Heatmap of differentially-expressed TF genes (adj p<0.05) identified by chromatin accessibility analysis, regulon analysis shows greater activation in mutant TnT when compared to mutant MyHC. g. RNA-seq and ATAC-seq: Integration of motif accessibility and regulon activity showing the combined (average) z-score shows z >1.2 for Pbx3 in both mutants; Stat2 and several Irf family members were only seen in mutant TnT. h. RNA-seq: Regulon activity analysis shows activation of several Irf family members (Irf2, 4, 5, 9), Stat2, Rel, Nr3c1, Mitf in both mutants with higher z-score in mutant TnT. i, j. RNA-seq: Scatter-plot and heatmaps of regulon genes in both mutants show greater upregulation in mutant TnT. (Red dots represent differentially-expressed regulon genes with adj p<0.01). Top 30 differentially expressed regulon genes are presented in the heat maps. k. RNA-seq: Regulon-Geneset comparison using KEGG with strength of interaction shown by number of matched genes shows that Irf5 is most influential for endocytosis and FC gamma receptor-mediated phagocytosis.
Figure 7.
Figure 7.. Prediction of cellular crosstalk by CellChat.
Cell Chat uses RNA-seq data to infer ligand-receptor-pairings between different clusters which reflects paracrine and autocrine signaling. a. Higher numbers of interactions are predicted in cells from mutant TnT (12070) and mutant MyHC (6503), when compared to controls (4691). b. Pathway distance plot (grey bars) shows the difference in pathway activity between mutants and controls. Bar length reflects the degree of difference in the pathway activity between the two, with longer bars reflecting greater difference in pathway activity. The adjacent plot shows direct comparison of the information flow in each mutant, compared to controls. c. Cell-Cell-Signaling for selected pathways. Darker green indicates greater importance. Sender expresses the ligand and receivers express the receptor. Mediators and receivers influence the signaling but are not directly involved in signaling.

Similar articles

References

    1. Maron BJ. Hypertrophic cardiomyopathy: a systematic review. JAMA. 2002;287:1308–20. - PubMed
    1. Maron BJ, Wolfson JK, Epstein SE and Roberts WC. Intramural ("small vessel") coronary artery disease in hypertrophic cardiomyopathy. J Am Coll Cardiol. 1986;8:545–57. - PubMed
    1. Yalcin H, Valenta I, Yalcin F, Corona-Villalobos C, Vasquez N, Ra J, Kucukler N, Tahari A, Pozios I, Zhou Y, Pomper M, Abraham TP, Schindler TH and Abraham MR. Effect of Diffuse Subendocardial Hypoperfusion on Left Ventricular Cavity Size by (13)N-Ammonia Perfusion PET in Patients With Hypertrophic Cardiomyopathy. Am J Cardiol. 2016;118:1908–1915. - PubMed
    1. Sivalokanathan S, Zghaib T, Greenland GV, Vasquez N, Kudchadkar SM, Kontari E, Lu DY, Dolores-Cerna K, van der Geest RJ, Kamel IR, Olgin JE, Abraham TP, Nazarian S, Zimmerman SL and Abraham MR. Hypertrophic Cardiomyopathy Patients With Paroxysmal Atrial Fibrillation Have a High Burden of Left Atrial Fibrosis by Cardiac Magnetic Resonance Imaging. JACC Clin Electrophysiol. 2019;5:364–375. - PubMed
    1. Lu DY, Ventoulis I, Liu H, Kudchadkar SM, Greenland GV, Yalcin H, Kontari E, Goyal S, Corona-Villalobos CP, Vakrou S, Zimmerman SL, Abraham TP and Abraham MR. Sex-specific cardiac phenotype and clinical outcomes in patients with hypertrophic cardiomyopathy. Am Heart J. 2020;219:58–69. - PubMed

Publication types