[Preprint]. 2024 Apr 1:2024.04.01.587559.
doi: 10.1101/2024.04.01.587559.

Regulation of angiogenesis by endocytic trafficking mediated by cytoplasmic dynein 1 light intermediate chain 1

Affiliations

Regulation of angiogenesis by endocytic trafficking mediated by cytoplasmic dynein 1 light intermediate chain 1

Dymonn Johnson et al. bioRxiv. .

Update in

  • Angiogenesis is limited by LIC1-mediated lysosomal trafficking.
    Johnson D, Colijn S, Richee J, Yano J, Burns M, Davis AE, Pham VN, Saric A, Jain A, Yin Y, Castranova D, Melani M, Fujita M, Grainger S, Bonifacino JS, Weinstein BM, Stratman AN. Johnson D, et al. Angiogenesis. 2024 Nov;27(4):943-962. doi: 10.1007/s10456-024-09951-7. Epub 2024 Oct 2. Angiogenesis. 2024. PMID: 39356418 Free PMC article.

Abstract

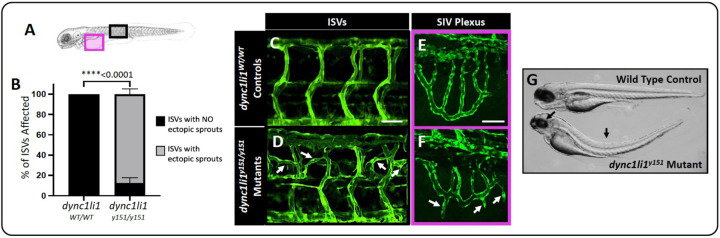
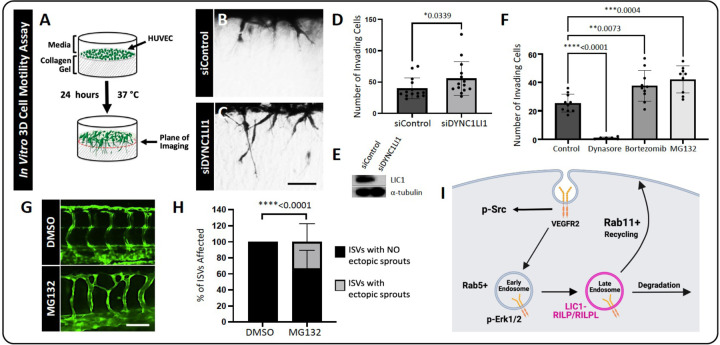
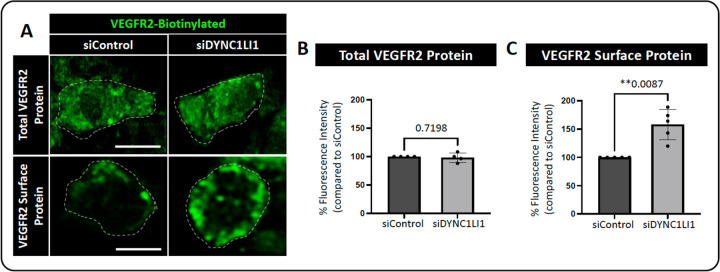
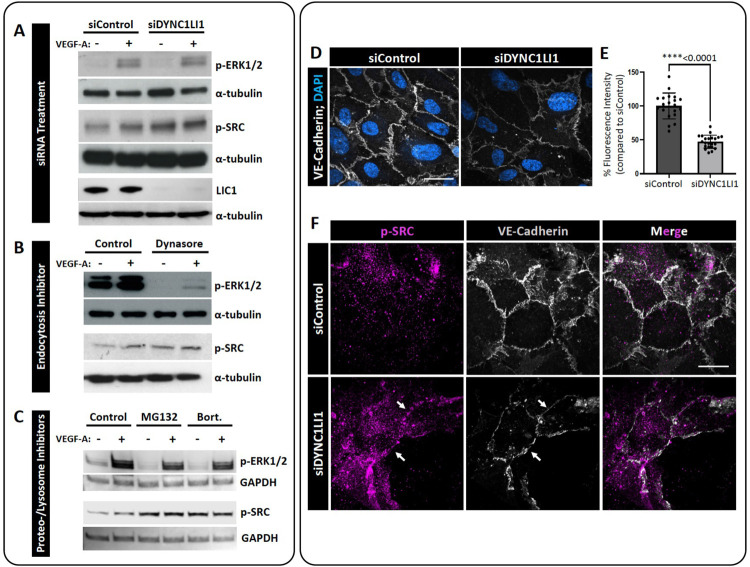
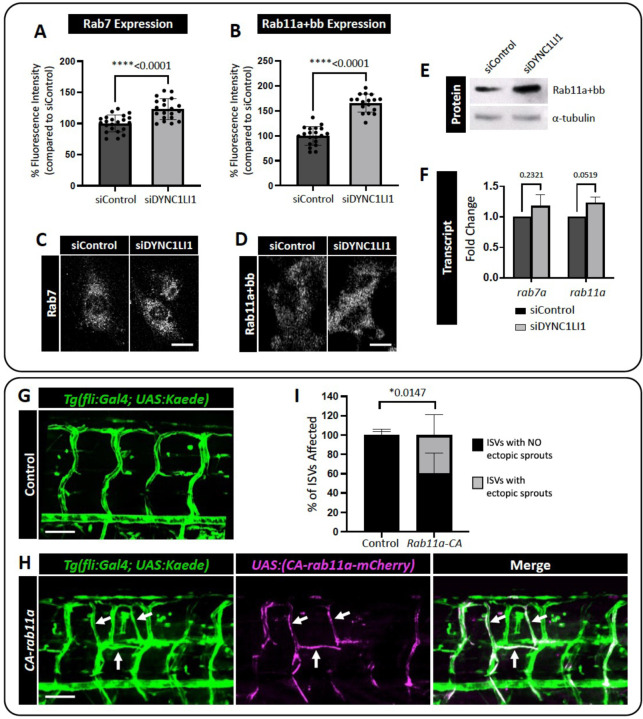
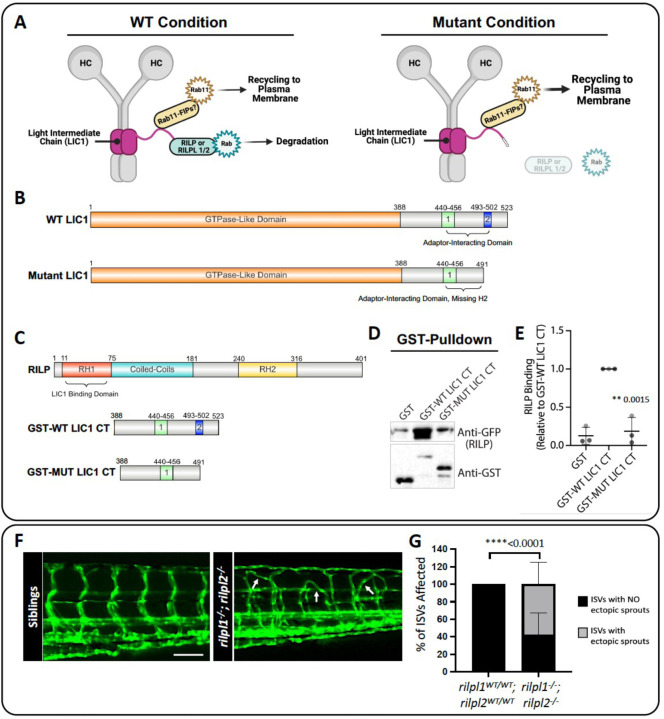
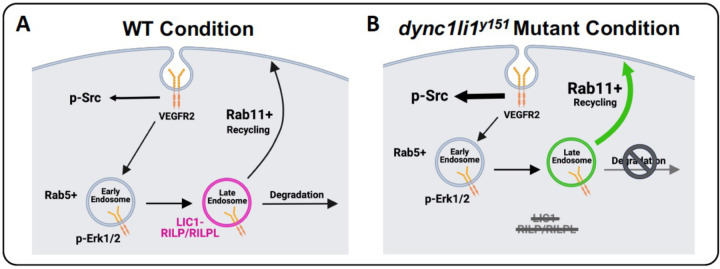
Dynein cytoplasmic 1 light intermediate chain 1 (LIC1, DYNC1LI1) is a core subunit of the dynein motor complex. The LIC1 subunit also interacts with various cargo adaptors to regulate Rab-mediated endosomal recycling and lysosomal degradation. Defects in this gene are predicted to alter dynein motor function, Rab binding capabilities, and cytoplasmic cargo trafficking. Here, we have identified a dync1li1 zebrafish mutant, harboring a premature stop codon at the exon 12/13 splice acceptor site, that displays increased angiogenesis. In vitro, LIC1-deficient human endothelial cells display increases in cell surface levels of the pro-angiogenic receptor VEGFR2, SRC phosphorylation, and Rab11-mediated endosomal recycling. In vivo, endothelial-specific expression of constitutively active Rab11a leads to excessive angiogenesis, similar to the dync1li1 mutants. Increased angiogenesis is also evident in zebrafish harboring mutations in rilpl1/2, the adaptor proteins that promote Rab docking to Lic1 to mediate lysosomal targeting. These findings suggest that LIC1 and the Rab-adaptor proteins RILPL1 and 2 restrict angiogenesis by promoting degradation of VEGFR2-containing recycling endosomes. Disruption of LIC1- and RILPL1/2-mediated lysosomal targeting increases Rab11-mediated recycling endosome activity, promoting excessive SRC signaling and angiogenesis.

Keywords: Lic1; Rilp1/2; angiogenesis; dynein motor; endosomes; lysosomes; zebrafish.


Conflict of interest statement

Competing Interests: The authors declare that they have no conflicts of interest.

Figures

Figure 1:
Figure 1:. dync1li1y151 mutant zebrafish exhibit excessive angiogenesis.
A. Schematic demonstrating imaged areas in panels B-E. These areas include intersegmental vessels (ISVs, black box), and the sub-intestinal vascular plexus (SIVs, magenta box). B. Percentage of ISVs displaying ectopic sprouts in dync1li1WT/WT controls and dync1li1y151/y151 mutants at 96 hpf. n=4 embryos, 10–15 ISVs analyzed per embryo. C-F. Confocal images of ISVs (C,D) or SIVs (E,F) from dync1li1WT/WT control (C,E) and dync1li1y151/y151 mutant siblings (D,F) at 96 hpf. Arrows indicate ectopic vascular sprouts. G. Representative brightfield images of WT control versus dync1li1y151 mutants, demonstrating spinal curvature and small eyes in the mutants (black arrows). Statistics for panel B were calculated using an unpaired t-test with Welch’s correction. Data are presented as the mean ± S.D. Scale bars: 50 um.
Figure 2:
Figure 2:. Impaired proteasomal/lysosomal function leads to increased angiogenesis in vitro and in vivo.
A. Schematic of the in vitro 3D collagen type I invasion/angiogenesis assay. HUVECs are transfected with either DYNC1LI1 or Control siRNA and seeded onto a collagen type 1 gel. After 24 hours, assays are observed for cellular invasion from the monolayer. B, C. Representative cross-sectional images of 3D collagen invasion assays, showing an increase in the number of invading cells in siDYNC1LI1-transfected HUVECs (B) compared to siControl-transfected cells (C). D. Quantification of the average number of invading cells in siControl versus siDYNC1LI1 conditions. E. Western blot analysis shows decreased expression of LIC1 in siDYNC1LI1-treated HUVECs compared to siControl HUVECs. Alpha-Tubulin is shown as a loading control. F. Quantification of the average number of invading HUVECs in 3D collagen gel assays. Assays were treated with inhibitors that block discrete stages of endocytosis. Dynasore (10uM), an early endosomal inhibitor, inhibited HUVEC invasion into the collagen gels. Bortezomib (100nM) and MG132 (10uM), which are late endosome/lysosome inhibitors, increased HUVEC invasion, consistent with siDYNC1LI1 results. G. Confocal images of 96 hpf zebrafish embryos treated with MG132 (10nM) or DMSO vehicle control starting at 4 hpf to investigate the effects of late endosome/lysosome inhibition on angiogenesis in vivo. WT Tg(fli:eGFP) zebrafish were used for these studies. MG132-treated fish phenocopy the dync1li1y151/y151 mutant over-branching phenotype. H. Percentage of ISVs displaying ectopic sprouts in DMSO- or MG132-treated embryos at 96 hpf. n=20–33 embryos. I. Schematic of LIC1’s proposed role in regulation of endocytosis. For panels D and F, each dot represents an individual 3D collagen assay. Statistics for panel D were calculated using a Mann-Whitney test. Statistics for panel F were calculated using one-way ANOVA with Dunnett’s multiple comparisons test; omnibus ANOVA P-value for F (prior to the post hoc tests) is <0.0001. Statistics for panel H were calculated using an unpaired t-test with Welch’s correction. Data are presented as the mean ± S.D. Scale bars: 100um (B) and 50um (G).
Figure 3:
Figure 3:. VEGFR2 protein surface localization is increased in LIC1-deficient HUVECs.
A. Representative single plane images of total VEGFR2 versus surface expression in HUVECs treated with siDYNC1LI1 versus siControl. Cells were simulated with 40 ng/ml VEGF-A for 1 hour then fixed and immunostained. Dashed lines highlight individual cell borders. B. Quantification of total (whole cell, permeabilized) VEGFR2 protein levels. C. Quantification of surface (non-permeabilized) VEGFR2 protein levels. For panels B and C, each dot represents data from an independent experiment. Statistics for panels B and C were calculated using an unpaired t-test with Welch’s correction. Data are presented as the mean ± S.D. Scale bars: 10um.
Figure 4:
Figure 4:. p-SRC activation is increased in LIC1-deficient HUVECs.
A-C. Representative Western blots of p-SRC and p-ERK1/2 activation in response to VEGF-A stimulation in siDYNC1LI1-transfected HUVECs compared to siControl cells (A); Dynasore-treated HUVECs compared to DMSO vehicle control treated cells (control, B); and HUVECs treated with MG132 or Bortezomib compared to DMSO vehicle control treated cells (control, C). GAPDH or a-tubulin are shown as protein loading controls. LIC1 levels following siRNA treatment is shown to confirm protein suppression (A). D. Immunofluorescent labeling of VE-Cadherin (grey) and nuclei (blue) in HUVECs transfected with siDYNC1LI1 or siControl. E. Quantification of VE-Cadherin levels. Statistics for panel E were calculated using an unpaired t-test with Welch’s correction. Data are presented as the mean ± S.D. F. Immunofluorescent labeling of VE-Cadherin (grey) and p-SRC (magenta) in HUVECs transfected with siDYNC1LI1 or siControl. White arrows highlight EC-EC boundaries. Scale bars: 5um.
Figure 5:
Figure 5:. Constitutive Rab11a activation leads to ectopic angiogenic sprouting.
A,B. Quantification of Rab7 (A) and Rab11a+bb (B) positive vesicles in siDYNC1LI1 HUVECs versus siControl-treated cells. C,D. Representative images of HUVECs immunostained for Rab7 (C) and Rab11a+bb (D) following siControl or siDYNC1LI1 transfection and treatment with 40 ng/mL VEGF-A for 10 min. E. Western blot analysis shows increased expression of Rab11 in siDYNC1LI1 HUVECs compared to siControl cells. F. qPCR reveals no change in the transcript levels of either Rab7 or Rab11 in siDYNC1LI1 cells, suggesting that the increased protein levels of Rab11 occur post-transcriptionally. G,H. Confocal images of Tg(fli:Gal4); Tg(UAS:Kaede) zebrafish embryos injected with a Tol2-integratable UAS:CA-rab11a-mCherry DNA plasmid to express constitutively active Rab11a protein in the endothelium in a mosaic fashion (H) versus carrier injected controls (G). Blood vessels are shown in green; mosaic expression of UAS:CA-rab11a-mCherry is shown in magenta. Endothelial cells expressing UAS:CA-rab11a-mCherry and Tg(fli:Gal4); Tg(UAS:Kaede) appear white when the images are merged. Sites of UAS:CA-rab11a-mCherry expression (white arrows) phenocopy the increased angiogenesis noted in dync1li1y151/y151 mutants. I. Percentage of ISVs displaying ectopic sprouts in carrier injected controls versus UAS:CA-rab11a-mCherry-injected embryos at 96 hpf. n=5 embryos. For panels A,B, each dot represents an individual cell. Panels A,B are representative of three independent experiments and statistics were calculated using an unpaired t-tests. For panel F, n=3. Statistics for panel F were calculated using one-sample t-tests to compare siDYNC1LI1 fold change values to hypothetical value 1. Data are presented as the mean ± S.D. Statistics for panel I were calculated using an unpaired t-test with Welch’s correction. Data are presented as the mean ± S.D. Scale bars: 10um (C,D) and 50uM (G,H).
Figure 6:
Figure 6:. rilpl1/2 mutants recapitulate the increased angiogenesis phenotype seen in dync1li1y151/y151 mutants.
A. Schematic representation of the role of RILP or RILPL1/2 in bridging LIC1 and Rab binding. RILP is an adaptor for Rab7, and RILPL1/2 are adaptors for Rabs 8, 10, and 36, all of which regulate lysosomal biogenesis and degradation. Mutations to RILP or RILPL1/2 are predicted to impair Rab binding to endosomes and decreased lysosomal degradation. B. WT LIC1 domains: GTPase Like Domain (1–388) and Adaptor-Interacting Domain (Helix 1 (440–456) and Helix 2 (493–502)). Mutant LIC1 domains: GTPase Like Domain (1–388) and Adaptor-Interacting Domain (Helix 1 (440–456), Helix 2 is deleted in this mutant). The mutant LIC1 introduces a 19 bp insertion at the end of exon 12. This insertion adds 2 amino acids: aspartic acid (Asp), leucine (Leu), and a premature “STOP” codon resulting in the complete loss of exon 13 and the H2 domain. C. Schematics of the proteins used for GST-binding assays. RILP: RILP Homology 1 (RH1) (–75), Coiled-Coils (75–181), and RILP Homology 1 (RH2) (240–316) domains. RILP’s RH1 domain binds to the LIC1 Adaptor-Interacting Domain. GST-WT LIC1 CT (GST-fused wild type human LIC1 c-terminal adaptor-interacting domain, a.a. 388–523). GST-MUT LIC1 CT (GST-fused mutant human LIC1 c-terminal adaptor-interacting domain a.a. 388–491, including the introduced Asp, Leu, STOP found in the zebrafish mutant, which is predicted to change protein conformation). Schematics created with Ibs.renlab.org. D. GST pulldown of WT human LIC1 C-terminus (GST-WT LIC1 CT) or the C-terminus bearing the equivalent mutation found in the dync1li1y151 mutant zebrafish (GST-MUT LIC1 CT). Purified RILP protein displays decreased binding to the mutant LIC1 C-terminus compared to WT LIC1 C-terminus. E. Quantification of the Western blot data assessing RILP binding to GST-WT LIC1 CT versus GST-Mut LIC1 CT. n=3. F. Confocal images of rilpl1/2 double-mutants at 96 hpf. G. Percentage of ISVs displaying ectopic sprouts in rilpl1/2 double-mutants compared to WT control siblings at 96 hpf. n=20 embryos. Statistics were calculated using an unpaired t-test with Welch’s correction. Data are presented as the mean ± S.D. Schematics created with BioRender.com. Scale bars: 50um.
Figure 7:
Figure 7:. A model of the role of LIC1 in angiogenesis.
A. LIC1 regulates binding of Rab adaptor proteins—in particular RILP and RILPL1/2—to augment endosomal recycling versus degradation. B. In the absence of the LIC1 C-terminal domain, RILP and RILPL1/2 are unable to bind LIC1 efficiently, leading to increased Rab11-mediated endosomal recycling and decreased Rab7-mediated endosomal degradation. Increased surface expression of VEGFR2 protein leads to overactivation of p-SRC and increased endothelial cell motility. Schematics created with BioRender.com.

References

    1. Senger DR, Davis GE. Angiogenesis. Cold Spring Harb Perspect Biol. 2011;3(8):a005090. - PMC - PubMed
    1. Lamalice L, Le Boeuf F, Huot J. Endothelial cell migration during angiogenesis. Circ Res. 2007;100(6):782–94. - PubMed
    1. Simons M. An inside view: VEGF receptor trafficking and signaling. Physiology (Bethesda). 2012;27(4):213–22. - PMC - PubMed
    1. Watanabe C, Matsushita J, Azami T, Tsukiyama-Fujii S, Tsukiyama T, Mizuno S, et al. Generating Vegfr3 reporter transgenic mouse expressing membrane-tagged Venus for visualization of VEGFR3 expression in vascular and lymphatic endothelial cells. PLoS One. 2019;14(1):e0210060. - PMC - PubMed
    1. Jouette J, Guichet A, Claret SB. Dynein-mediated transport and membrane trafficking control PAR3 polarised distribution. Elife. 2019;8. - PMC - PubMed

Publication types