[Preprint]. 2025 Jul 14:2024.01.05.574376.
doi: 10.1101/2024.01.05.574376.

CREB drives acinar cells to ductal reprogramming and promotes pancreatic cancer progression in preclinical models of alcoholic pancreatitis

Affiliations

CREB drives acinar cells to ductal reprogramming and promotes pancreatic cancer progression in preclinical models of alcoholic pancreatitis

Supriya Srinivasan et al. bioRxiv. .

Update in

Abstract

Background & aims: Chronic alcoholism often leads to pancreatitis, which exacerbates pancreatic damage through acinar cell injury, fibrotic inflammation and activates AKT/mTOR/cyclic adenosine monophosphate response element binding protein 1 (CREB) signaling axis. However, the molecular interplay between oncogenic Kras G12D/+(Kras*) and CREB in promoting pancreatic cancer progression under chronic inflammation remains poorly understood.

Methods: Experimental alcoholic chronic pancreatitis (ACP) induction was established in multiple mouse models, with euthanasia during the recovery stage to evaluate tumor latency. CREB was selectively deleted (Crebfl/fl ) in Ptf1aCreERTM/+;LSL-KrasG12D/+ (KC) genetic mouse models (KCC-/- ). Pancreata from Ptf1a CreERTM/+, KC, and KCC-/- mice were analyzed using histological profiling, western blotting, phosphokinase array, and quantitative PCR. Single-cell RNA sequencing was performed in ACP-induced KC mice. Lineage tracing analysis in YFP reporter mice and acinar cell explant cultures analysis were also conducted.

Results: ACP induction in KC mice significantly impaired pancreas' repair mechanism. Acinar cell-derived ductal lesions demonstrated sustained CREB hyperactivation in acinar-to-ductal metaplasia (ADM)/pancreatic intraepithelial neoplasia (PanIN) lesions associated with pancreatitis and pancreatic cancer. Persistent CREB activity reprogrammed acinar cells, and increased profibrotic inflammation. Notably, acinar specific Creb deletion in ACP induced models suppressed high grade PanIN development, restrained tumor progression, and improved acinar cell function.

Conclusions: Our findings demonstrate that CREB and Kras* promote irreversible ADM, accelerating pancreatic cancer progression with ACP. Targeting CREB may present a promising strategy to mitigate inflammation-driven pancreatic tumorigenesis.

Keywords: acinar-to-ductal metaplasia; alcoholic chronic pancreatitis; cAMP response element binding protein 1; pancreatic ductal adenocarcinoma; pancreaticcancer; pancreaticintraepithelial neoplasia.


Conflict of interest statement

Disclosures: The authors declare no potential conflicts of interest.

Figures
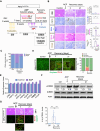
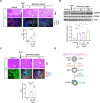
Figure 1.
Figure 1.
CREB activation in alcoholic chronic pancreatitis (ACP) in Ptf1aCreERTM/+ mice. (A) ACP induction in Ptf1aCreERTM/+ mice exposed to ethanol (alcohol)-enriched liquid diet (A) and caerulein administration (CP). Mice were euthanized after 3- and 21-day recovery periods. (B) Mouse pancreas with H&E and quantification depicting ducts (CK19+), PanINs (Alcian Blue), collagen (Sirius red), and immune cells (CD45+) (n=5 mice per group). (C) H&E-based quantification of mice pancreata highlighting acinar and ADM regions (n=3 mice per group). (D) Representative images of pancreas depicting amylase (green)/CK19 (red) co-I.F labeling and CK19+ amylase+ cell corresponding quantification (n=3 mice per group). (E) Mouse kinase array in control (ctrl) and ACP-induced pancreata performed by using pooled tissue lysates from (N=3) biological replicates for each group (Ctrl and ACP), with two membranes used for quantitative estimation of fold change differences. (F) Western blotting showing pCREB expression with relative fold change expression values (normalized to total CREB) in pancreatic tissue lysates in ctrl, 3- and 21-day ACP recovery period (n=2 mice per group) (G) H&E and pCREB (green)/CK19 (red) co-I.F labeling with pCREB+ duct quantification in pancreata harvested from ctrl and ACP with recovery (n=6 mice per group). Scale bar, 50 μm. ns=nonsignificant; **p<0.01; ***, p<0.001; ****p<0.0001 by ANOVA.
Figure 2.
Figure 2.
ACP induction accelerates ADM reprogramming toward PanIN and pancreatic cancer in KrasG12D/+ mutant mice. (A) Relative pancreas weight measurements in respective KC mice cohorts (n=5–8 mice per group). (B) Representative pancreatic images depicting H&E with quantification of CK19+ ducts, PanINs, collagen, and CD45+ in ctrl and ACP-induced KC mice with recovery periods (n=5 mice per group). (C) H&E staining within the pancreas depicting acinar, ADMs, PanINs, and cancer regions (n=3 mice per group). (D) UMAP projection displaying cell clusters and (E) cell count table, (F) volcano plot and (G) bubble plot within the acinar cells in the scRNA sequencing analysis of pancreata from ctrl and ACP-KC mice. (H) Representative pancreas images depicting amylase (green)/CK19 (red) co-I.F (top) CK19+ amylase+ cell (bottom) quantification (within the epithelial cell compartment only) in ctrl and ACP-induced KC mice with 3- and 21-day recovery periods (n=3 mice per group). (I) qPCR analysis in the pancreas of ctrl and ACP-induced KC mice (n=3 mice per group). (J) Measurement of tumor latency period in ctrl, A, CP, and ACP-induced KC mice (n=12–13 mice per group). Scale bar, 50 μm. ns=nonsignificant; *p<0.05; **p<0.01; ****p<0.0001 by ANOVA or unpaired t-test.
Figure 3.
Figure 3.
Sustained hyperactivation of CREB in ACP KrasG12D/+ driven ADM and PanIN progression. (A) H&E and co-I.F labeling of pCREB (green) and CK-19 (red) expression (top) with pCREB+ duct quantification within the ctrl and KC mice pancreata at 3- and 21-day ACP recovery period (bottom) (n=4 mice per group). (B) Western blotting of pCREB in pancreatic tissue lysates of control and KC mice at 3-, 21- and 42-day ACP recovery period (n=3 mice per group). (C) H&E images of the pancreas along with co-I.F labeling of pCREB (red)/CK19 (blue)/YFP (green), and YFP+ pCREB+ duct quantification in ctrl and Ptf1aCreERTM/+; LSL-KrasG12D/+; R26R-EYFP (KCY) mice at 3- and 21-day recovery periods (n=4 mice per group). (D) Schematic depicting sustained hyperactivation of CREB driving acinar cell neoplastic reprogramming in KC mice upon ACP induction. Scale bar, 50 μm. *p<0.05; **p<0.01; ***, p<0.001; ****p<0.0001 by ANOVA for three groups comparison and unpaired T-test for two groups.
Figure 4.
Figure 4.
Acinar-specific ablation of Creb attenuates spontaneous KrasG12D/+ mediated PanIN progression. (A) Breeding strategy for generating acinar-specific Creb deficient Kras* mutant mice (Ptf1aCreERTM/+; LSL-KrasG12D/+; Crebfl/fl or KCC−/−). (B) Comparative measurement of relative pancreas weight in 10-month-old Creb wild type (KC) and KCC−/− mice (n=4–5 mice per group). (C) Representative photomicrographs of whole pancreas depicting significantly less tumor burden in KCC−/− mice than KC mice at 10 months of age. (D) Representative H&E images of the pancreata harvested from 5- and 10-month-old KC and KCC−/− mice. Scale bar, 10 and 50 μm. (E) Comparative assessment using H&E-based histology to examine the entire pancreas, illustrating acinar cells, ADMs, PanINs, and cancerous regions in 5- and 10-month-old KC and KCC−/− mice (n=3 mice per group). (F) Co-IF analysis of pCREB (green), CK-19 (red), and DAPI (blue) with quantification in pancreatic tissue sections harvested from 10-month-old KC and KCC−/− mice (n=4 mice per group). Scale bar, 50 μm. (G) Representative bright-field photomicrographs of primary 3D acinar cell cultures established from 10-month-old KC and KCC−/− mice (scale bar, 20 μm) (n=5 mice per group). (H) qPCR of pancreatic tissue harvested from KC and KCC−/− mice (n=3 mice per group). Scale bar, 10 and 50 μm. ns=nonsignificant; *p<0.05; **p<0.01; ***p<0.001; ****p<0.0001 one way ANOVA or unpaired t-test.
Figure 5.
Figure 5.
Acinar-specific ablation of Creb attenuates Kras* induced progression of ADM/PanINs toward pancreatic cancer with ACP. (A) Comparative histological evaluation of mouse pancreas, accompanied by images showcasing H&E, CK-19, Alcian Blue, Sirius Red, and CD45+ staining within KC and KCC−/− mice pancreata, ctrl and KC mice at 3- and 21-day ACP recovery period (n=5 mice per group). (B) H&E-based histological examination illustrating acinar cells, ADMs, PanINs, and cancerous regions in ctrl or within KC and KCC−/− mice pancreata harvested after 21 days of ACP recovery period (n=3 mice per group). (C) Pancreas images depicting amylase (green)/CK19 (red) and DAPI (blue) immunofluorescent labeling (top) and CK19+ amylase+ cell corresponding quantification (bottom)[within the epithelial cell compartment only] in ctrl (KC and KCC−/−) or with ACP induction (n=3 mice per group). Scale bar, 50 μm. ns=nonsignificant; ****p<0.0001 by ANOVA.
Figure 6.
Figure 6.
Acinar-specific ablation of Creb attenuates ADM reprogramming and increases tumor latency period with ACP induction in KC mice. (A) Representative H&E images of the pancreas along with co-immunofluorescent labeling and YFP quantification (green)/CK19 (blue) in Ptf1a-CreERTM/+;LSL-KrasG12D/+;R26R-EYFP (KCY) and Crebfl/fl (KCYC−/−) in control or with ACP induction (n=4 mice per group). (B) qPCR-based analysis of KC and KCC−/− mice pancreatic tissue with ACP induction (n=3 mice per group). (C) Tumor latency period assessment in ctrl or with ACP induction in KC and KCC−/− mice (n=12 mice per group, ctrl mice cohort represented here is similar to that shown in Figure 2I). (D) Schematic representation illustrating that acinar-specific Creb ablation diminishes pancreatic cancer progression in ACP induction in KC mice. Scale bar, 50 μm. ns=nonsignificant;*p<0.05; ****p<0.0001 by ANOVA or unpaired t-test.
Figure 7.
Figure 7.
(A) Schematic representation of ACP induction with Kras* driving irreversible ADM reprogramming toward accelerated PDAC progression along with sustained CREB activation and increased fibroinflammation. (B) Acinar cell-specific deletion of CREB generates anti-tumor responses and delays pancreatic cancer progression. The schematic was created with BioRender with License agreement numbers OW27SH91EN.

References

    1. Peery AF, Crockett SD, Murphy CC, et al. Burden and Cost of Gastrointestinal, Liver, and Pancreatic Diseases in the United States: Update 2021. Gastroenterology 2022;162:621–644. - PMC - PubMed
    1. Nieto LM, Salazar M, Kinnucan J, et al. Incidence, Burden, and Predictors of Readmission for Acute Alcoholic Pancreatitis: A National Analysis over 11 Months. Dig Dis Sci 2023;68:423–433. - PubMed
    1. Singer MV. Effect of ethanol and alcoholic beverages on the gastrointestinal tract in humans. Rom J Gastroenterol 2002;11:197–204. - PubMed
    1. Dufour MC, Adamson MD. The epidemiology of alcohol-induced pancreatitis. Pancreas 2003;27:286–90. - PubMed
    1. Yadav D, Lowenfels AB. The epidemiology of pancreatitis and pancreatic cancer. Gastroenterology 2013;144:1252–61. - PMC - PubMed

Publication types