

This is a preprint.
Integrating Genetic and Transcriptomic Data to Identify Genes Underlying Obesity Risk Loci
- PMID: 38903089
- PMCID: PMC11188121
- DOI: 10.1101/2024.06.11.24308730
Integrating Genetic and Transcriptomic Data to Identify Genes Underlying Obesity Risk Loci
Update in
-
Integrating genetic and transcriptomic data to identify genes underlying obesity risk loci.Int J Obes (Lond). 2025 Nov;49(11):2346-2357. doi: 10.1038/s41366-025-01898-z. Epub 2025 Sep 26. Int J Obes (Lond). 2025. PMID: 41006818 Free PMC article.
Abstract
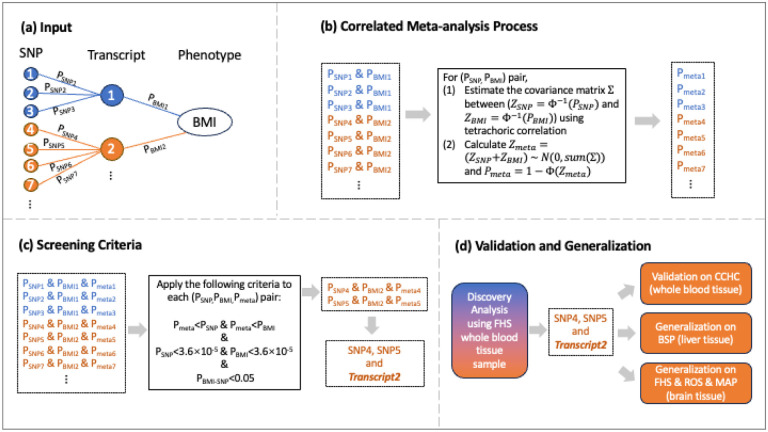
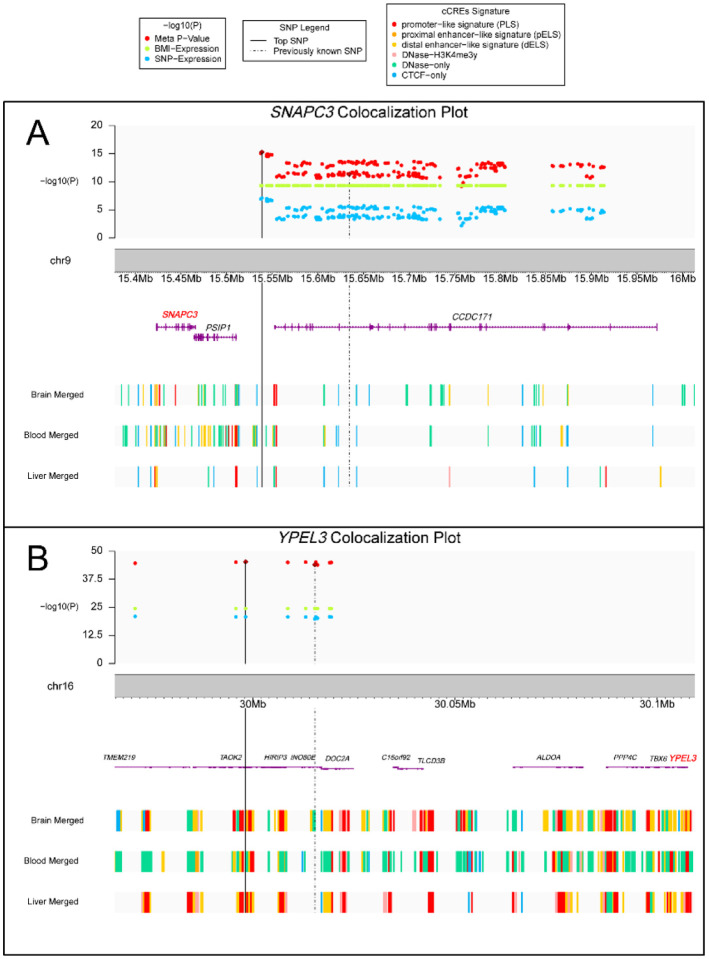
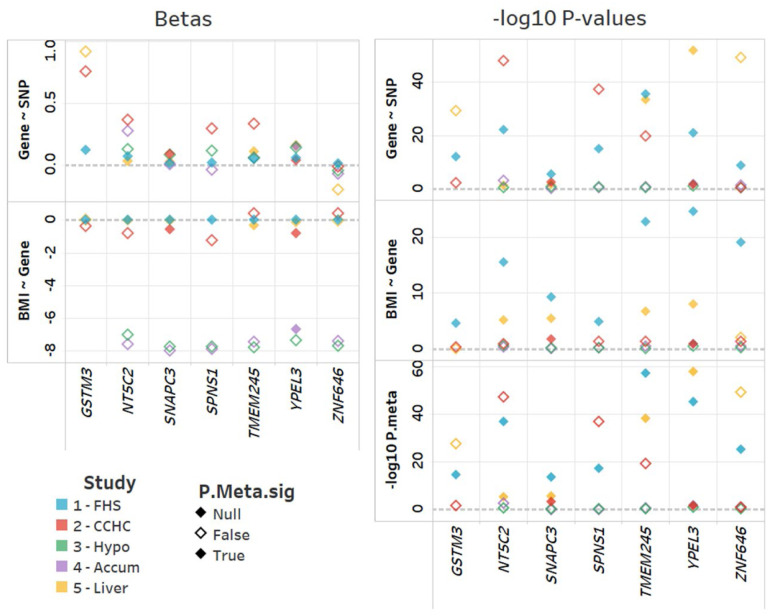
Genome-wide association studies (GWAS) have identified numerous body mass index (BMI) loci. However, most underlying mechanisms from risk locus to BMI remain unknown. Leveraging omics data through integrative analyses could provide more comprehensive views of biological pathways on BMI. We analyzed genotype and blood gene expression data in up to 5,619 samples from the Framingham Heart Study (FHS). Using 3,992 single nucleotide polymorphisms (SNPs) at 97 BMI loci and 20,692 transcripts within 1 Mb, we performed separate association analyses of transcript with BMI and SNP with transcript (PBMI and PSNP, respectively) and then a correlated meta-analysis between the full summary data sets (PMETA). We identified transcripts that met Bonferroni-corrected significance for each omic, were more significant in the correlated meta-analysis than each omic, and were at least nominally associated with BMI in FHS data. Among 308 significant SNP-transcript-BMI associations, we identified seven genes (NT5C2, GSTM3, SNAPC3, SPNS1, TMEM245, YPEL3, and ZNF646) in five association regions. Using an independent sample of blood gene expression data, we validated results for SNAPC3 and YPEL3. We tested for generalization of these associations in hypothalamus, nucleus accumbens, and liver and observed significant (PMETA<0.05 & PMETA<PSNP & PMETA<PBMI) results for YPEL3 in nucleus accumbens and NT5C2, SNAPC3, TMEM245, YPEL3, and ZNF646 in liver. The identified genes help link the genetic variation at obesity risk loci to biological mechanisms and health outcomes, thus translating GWAS findings to function.
Conflict of interest statement
CONFLICTS OF INTEREST None to report.
Figures
References
-
- Collaboration, N.C.D.R.F. (2017). Worldwide trends in body-mass index, underweight, overweight, and obesity from 1975 to 2016: a pooled analysis of 2416 population-based measurement studies in 128.9 million children, adolescents, and adults. Lancet 390, 2627–2642. 10.1016/S0140-6736(17)32129-3. - DOI - PMC - PubMed
-
- Prospective Studies C., Whitlock G., Lewington S., Sherliker P., Clarke R., Emberson J., Halsey J., Qizilbash N., Collins R., and Peto R. (2009). Body-mass index and cause-specific mortality in 900 000 adults: collaborative analyses of 57 prospective studies. Lancet 373, 1083–1096. 10.1016/S0140-6736(09)60318-4. - DOI - PMC - PubMed
-
- Heid I.M., Jackson A.U., Randall J.C., Winkler T.W., Qi L., Steinthorsdottir V., Thorleifsson G., Zillikens M.C., Speliotes E.K., Magi R., et al. (2010). Meta-analysis identifies 13 new loci associated with waist-hip ratio and reveals sexual dimorphism in the genetic basis of fat distribution. Nature genetics 42, 949–960. 10.1038/ng.685. - DOI - PMC - PubMed
-
- Speliotes E.K., Willer C.J., Berndt S.I., Monda K.L., Thorleifsson G., Jackson A.U., Lango Allen H., Lindgren C.M., Luan J., Magi R., et al. (2010). Association analyses of 249,796 individuals reveal 18 new loci associated with body mass index. Nature genetics 42, 937–948. 10.1038/ng.686. - DOI - PMC - PubMed
-
- Willer C.J., Speliotes E.K., Loos R.J., Li S., Lindgren C.M., Heid I.M., Berndt S.I., Elliott A.L., Jackson A.U., Lamina C., et al. (2009). Six new loci associated with body mass index highlight a neuronal influence on body weight regulation. Nature genetics 41, 25–34. 10.1038/ng.287. - DOI - PMC - PubMed
Publication types
Grants and funding
- R01 HL143885/HL/NHLBI NIH HHS/United States
- R01 HL142302/HL/NHLBI NIH HHS/United States
- N01 HC025195/HL/NHLBI NIH HHS/United States
- R01 HL151152/HL/NHLBI NIH HHS/United States
- HHSN268201500001I/HL/NHLBI NIH HHS/United States
- R01 DK139598/DK/NIDDK NIH HHS/United States
- R01 HG010297/HG/NHGRI NIH HHS/United States
- HHSN268201500001C/HL/NHLBI NIH HHS/United States
- R01 HL163262/HL/NHLBI NIH HHS/United States
- R01 HL092577/HL/NHLBI NIH HHS/United States
- P20 MD000170/MD/NIMHD NIH HHS/United States
- 75N92019D00031/HL/NHLBI NIH HHS/United States
- R01 HD057194/HD/NICHD NIH HHS/United States
- UL1 TR000371/TR/NCATS NIH HHS/United States
- R01 DK122503/DK/NIDDK NIH HHS/United States
LinkOut - more resources
Full Text Sources
Research Materials
Miscellaneous