[Preprint]. 2024 Mar 22:2024.03.19.585805.
doi: 10.1101/2024.03.19.585805.

Engineering Tumor Stroma Morphogenesis Using Dynamic Cell-Matrix Spheroid Assembly

Affiliations

Engineering Tumor Stroma Morphogenesis Using Dynamic Cell-Matrix Spheroid Assembly

Michael J Buckenmeyer et al. bioRxiv. .

Update in

Abstract

The tumor microenvironment consists of resident tumor cells organized within a compositionally diverse, three-dimensional (3D) extracellular matrix (ECM) network that cannot be replicated in vitro using bottom-up synthesis. We report a new self-assembly system to engineer ECM-rich 3D MatriSpheres wherein tumor cells actively organize and concentrate microgram quantities of decellularized ECM dispersions which modulate cell phenotype. 3D colorectal cancer (CRC) MatriSpheres were created using decellularized small intestine submucosa (SIS) as an orthotopic ECM source that had greater proteomic homology to CRC tumor ECM than traditional ECM formulations such as Matrigel. SIS ECM was rapidly concentrated from its environment and assembled into ECM-rich 3D stroma-like regions by mouse and human CRC cell lines within 4-5 days via a mechanism that was rheologically distinct from bulk hydrogel formation. Both ECM organization and transcriptional regulation by 3D ECM cues affected programs of malignancy, lipid metabolism, and immunoregulation that corresponded with an in vivo MC38 tumor cell subpopulation identified via single cell RNA sequencing. This 3D modeling approach stimulates tumor specific tissue morphogenesis that incorporates the complexities of both cancer cell and ECM compartments in a scalable, spontaneous assembly process that may further facilitate precision medicine.

Keywords: 3D in vitro modeling; biomaterials; decellularization; extracellular matrix; spheroids; tumor microenvironment.


Conflict of interest statement

Competing interests: None

Figures

Figure 1:
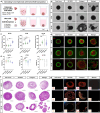
Figure 1:. SIS ECM matrisome composition reflects CRC tumor ECM diversity.
a. SIS ECM processing workflow and characterization. Histological staining with H&E and Trichrome shows the removal of cells and retention of dense collagen. Transmission electron m Figure 1: SIS ECM matrisome composition reflects CRC tumor ECM diversity a. SIS ECM processing workflow and characterization. Histological staining with H&E and Trichrome shows the removal of cells and retention of dense collagen. Transmission electron micrographs (TEM) of digested SIS ECM highlight the presence of intact fibrils and extracellular vesicles. b. PicoGreen assay indicates a significant reduction in dsDNA content and c. DNA gel electrophoresis demonstrates a substantial decrease in DNA fragment size post-decellularization. d. Sircol assay displays variance in soluble collagen content of ECM biomaterials. e. Matrisome category breakdown and f. Core matrisome composition between ECM biomaterials compared with MC38 tumor ECM based upon relative abundance, detected by mass spectrometry (LC-MS). g. Top 10 matrisome proteins by relative abundance. h. Total shared number and i. percentage of matrisome proteins between ECM biomaterials and MC38 tumor. j. tSNE plot of in vivo cell populations within MC38 tumors (Immune, MC38, and Stromal cells) based upon clustering of scRNA Seq expression data. k. Matrisome expression based upon cell type within MC38 tumors. l. Pseudobulk expression data of MC38 tumor matrisome and top 25 matrisome genes expressed. Plotted data are the mean ± SD. Statistics were calculated by a one-way ANOVA followed by a Tukey’s multiple comparisons test. Statistical significance where p < 0.0001 is denoted with ****.
Figure 2:
Figure 2:. CRC cells assemble and organize ECM to form 3D MatriSpheres.
a. Colorectal cancer cells are seeded as cells alone or with low concentration of ECM to generate spheroids in ultra-low attachment round-bottom 96-well plates for seven days of culture. b. Representative brightfield images of spheroids after 7 days of culture. Scale bars: 200 μm. c. Quantification of spheroid diameters after 7 days of culture (n ≥ 37 for groups that were quantified). d. Live-dead images of spheroids after 7 days of culture. e. Quantification of cell viability within the spheroids after 7 days of culture (n ≥ 13 for groups that were quantified) f. Representative H&E images of tumor spheroid sections demonstrates differences in micro-tissue organization. Scale bars: 200 μm. g. Picrosirius red (PSR) stained spheroids imaged with polarized light displays the presence of dense collagen fibers in SIS ECM and Type I Collagen groups. Scale bars: 100 μm. Statistics were calculated by a one-way ANOVA followed by a Tukey’s multiple comparisons test with significance values p < 0.05 is denoted with *, ≤ 0.01 with **, ≤ 0.001 with ***, and ≤ 0.0001 with ****.
Figure 3:
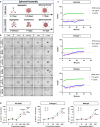
Figure 3:. Cell-mediated ECM assembly delays formation kinetics.
a. Schematic overview of cell assembly and spheroid formation mechanisms for cells alone and SIS-ECM MatriSpheres. b. Representative images of formation over the first 3 days of culture during time-lapse imaging. Scale bar: 500 μm. c. Tan(δ)−1 plotted as an indicator of gelation of ECM biomaterials (without cells) at working concentrations used in MatriSphere formation and traditional hydrogel formation measured by rheology (n ≥ 2 per group) d. Averaged storage (G’) and loss (G’’) moduli of ECM biomaterials at varied concentrations observed at 30 minutes after exposure to 37°C. A 2-way ANOVA with Dunnett’s multiple comparison test was used to assess significant differences (p-value < 0.05) within or between groups.
Figure 4:
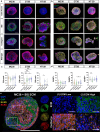
Figure 4:. CRC MatriSpheres display heterogenous phenotypes with enhanced cell-ECM interaction.
a. Multiplex fluorescence staining for CHP (denatured fibrillar collagen, green), N-CAD (red), and DAPI (blue) within MatriSphere histologic sections. Scale bar: 200 μm. b. Multiplex fluorescence staining for CHP (denatured fibrillar collagen, green), Ki67 (proliferation, red), CA IX (hypoxia, yellow), and DAPI (blue) within MatriSphere histologic sections. Scale bar: 200 μm. c. Quantification of N-CAD expression in representative MatriSphere sections. Statistics were calculated by a one-way ANOVA followed by a Tukey’s multiple comparisons test. d. Quantification of Ki67 expression in representative MatriSphere sections. Statistics were calculated by a one-way ANOVA followed by a Tukey’s multiple comparisons test. e. Representative MC38 + SIS ECM MatriSphere section stained for CHP (denatured fibrillar collagen, green), E-CAD (yellow), N-CAD (red), and DAPI (blue). Cadherin expression is higher in ECM low regions than in ECM low regions. Full image scale bar: 250 μm. Inset image scale bar: 50 μm. Statistical significance where p < 0.05 is denoted with *, ≤ 0.01 with **, ≤ 0.001 with ***, and ≤ 0.0001 with ****.
Figure 5:
Figure 5:. MatriSpheres alter CRC transcriptome and secretome capturing in vivo tumor heterogeneity.
a. PCA plots clustering RNA Seq expression data of both mouse and human CRC spheroids cultured with and without SIS ECM at day 7. b. Volcano plots of differentially expressed genes across all three cells line as compared to cells alone spheroid controls. c. Top 10 genes for each CRC cell line by fold change. d. Top 10 gene set enrichment based upon GSEA. Significantly upregulated (orange) and downregulated (blue) gene sets. e. (MC38 and CT26), h. (HT-29) Heatmap displaying top cytokine fold change between cell culture supernatant from MatriSpheres compared to cells alone spheroids at Day 7. f. (MC38 and CT26), i. (HT-29). Modified correlation plot identifying similarities between conserved transcriptome and secretome signatures g. (MC38 and CT26), j. (HT-29) Chemiluminescent intensity values of correlated proteins. k. tSNE plot of cell clusters identified within in vivo MC38 tumors based upon scRNA Seq expression data. l. tSNE plot comparing bulk RNA Seq expression level data from in vitro MC38 MatriSpheres and cell alone spheroids to scRNA Seq expression of in vivo MC38 cancer cells. m. Top 10 upregulated and n. downregulated genes defining the high confidence correlation of in vitro MC38 tumor spheroids with in vivo cancer cells. Significant differences were defined as p-value < 0.01 for RNA Seq data.
Figure 6:
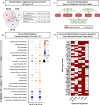
Figure 6:. Conserved ECM effects on CRC pathway activation and potential TME target genes.
a. Venn diagram showing the number of predicted pathways and their activity based upon RNA transcription patterns across CRC MatriSpheres. Filtered by |z-scores| ≥ 2. The table highlights the 3 significantly overlapping pathways and the corresponding z-scores across all CRC cell lines. b. Bubble plot displaying shared significant pathways. Pathways shown contained two or more CRC cell lines with |z-scores| ≥ 3. c. Flow chart of interactions between IPA predicted upstream regulators and target genes conserved between all CRC cell lines. d. Heatmap of target genes within the IPA tumor microenvironment pathway that have interactions with the 5 identified upstream regulators.

References

    1. de Visser K. E. & Joyce J. A. The evolving tumor microenvironment: From cancer initiation to metastatic outgrowth. Cancer Cell 41, 374–403 (2023). 10.1016/j.ccell.2023.02.016 - DOI - PubMed
    1. Brauchle E. et al. Biomechanical and biomolecular characterization of extracellular matrix structures in human colon carcinomas. Matrix Biol 68–69, 180–193 (2018). 10.1016/j.matbio.2018.03.016 - DOI - PubMed
    1. Devarasetty M. et al. Simulating the human colorectal cancer microenvironment in 3D tumor-stroma co-cultures in vitro and in vivo. Sci Rep 10, 9832 (2020). 10.1038/s41598-020-66785-1 - DOI - PMC - PubMed
    1. Lu P., Weaver V. M. & Werb Z. The extracellular matrix: A dynamic niche in cancer progression. Journal of Cell Biology 196, 395–406 (2012). 10.1083/jcb.201102147 - DOI - PMC - PubMed
    1. Cox T. R. The matrix in cancer. Nat Rev Cancer 21, 217–238 (2021). 10.1038/s41568-020-00329-7 - DOI - PubMed

Publication types