[Preprint]. 2024 May 26:2024.05.24.595755.
doi: 10.1101/2024.05.24.595755.

The UFMylation pathway is impaired in Alzheimer's disease

Affiliations

The UFMylation pathway is impaired in Alzheimer's disease

Tingxiang Yan et al. bioRxiv. .

Update in

  • The UFMylation pathway is impaired in Alzheimer's disease.
    Yan T, Heckman MG, Craver EC, Liu CC, Rawlinson BD, Wang X, Murray ME, Dickson DW, Ertekin-Taner N, Lou Z, Bu G, Springer W, Fiesel FC. Yan T, et al. Mol Neurodegener. 2024 Dec 18;19(1):97. doi: 10.1186/s13024-024-00784-y. Mol Neurodegener. 2024. PMID: 39696466 Free PMC article.

Abstract

Background: Alzheimer's disease (AD) is characterized by the presence of neurofibrillary tangles made of hyperphosphorylated tau and senile plaques composed of beta-amyloid. These pathognomonic deposits have been implicated in the pathogenesis, although the molecular mechanisms and consequences remain undetermined. UFM1 is an important, but understudied ubiquitin-like protein that is covalently attached to substrates. This UFMylation has recently been identified as major modifier of tau aggregation upon seeding in experimental models. However, potential alterations of the UFM1 pathway in human AD brain have not been investigated yet.

Methods: Here we used frontal and temporal cortex samples from individuals with or without AD to measure the protein levels of the UFMylation pathway in human brain. We used multivariable regression analyses followed by Bonferroni correction for multiple testing to analyze associations of the UFMylation pathway with neuropathological characteristics, primary biochemical measurements of tau and additional biochemical markers from the same cases. We further studied associations of the UFMylation cascade with cellular stress pathways using Spearman correlations with bulk RNAseq expression data and functionally validated these interactions using gene-edited neurons that were generated by CRISPR-Cas9.

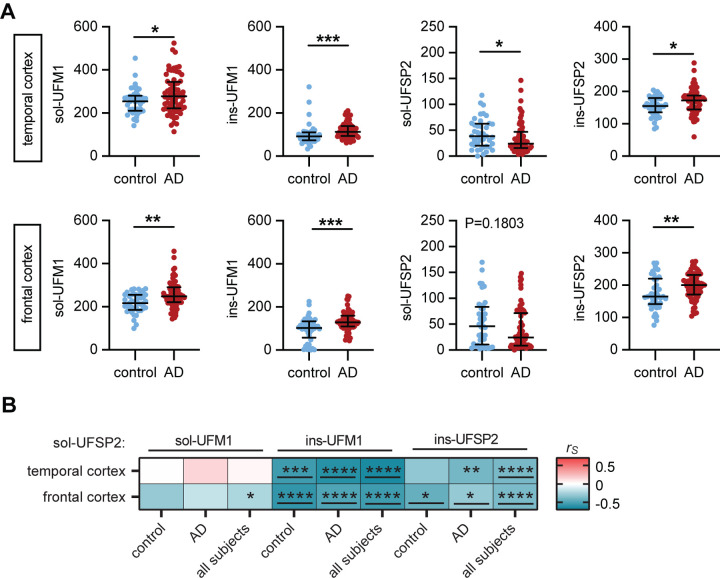
Results: Compared to controls, human AD brain had increased protein levels of UFM1. Our data further indicates that this increase mainly reflects conjugated UFM1 indicating hyperUFMylation in AD. UFMylation was strongly correlated with pathological tau in both AD-affected brain regions. In addition, we found that the levels of conjugated UFM1 were negatively correlated with soluble levels of the deUFMylation enzyme UFSP2. Functional analysis of UFM1 and/or UFSP2 knockout neurons revealed that the DNA damage response as well as the unfolded protein response are perturbed by changes in neuronal UFM1 signaling.

Conclusions: There are marked changes in the UFMylation pathway in human AD brain. These changes are significantly associated with pathological tau, supporting the idea that the UFMylation cascade might indeed act as a modifier of tau pathology in human brain. Our study further nominates UFSP2 as an attractive target to reduce the hyperUFMylation observed in AD brain but also underscores the critical need to identify risks and benefits of manipulating the UFMylation pathway as potential therapeutic avenue for AD.

Keywords: Alzheimer’s disease; UFM1; UFMylation; UFSP2; brain; tau.


Conflict of interest statement

Competing interests The authors declare that they have no competing interests.

Figures

Figure 1:
Figure 1:. Exploratory analysis of the UFM1 pathway in normal and AD frontal cortex.
(A) Schematic of the UFMylation pathway: Pro-UFM1 is cleaved by the protease UFSP1 or UFSP2 into the mature, conjugatable form. UBA5 (E1) activates UFM1 and UFC1 acts as an E2 conjugating enzyme that interacts with the E3 complex consisting of UFL1 and the adaptor proteins DDRGK1 and CDK5RAP3, which mediate the transfer of UFM1 from UFC1 to its target substrate. UFM1 is cleaved from its substrates mainly by UFSP2. (B-D) Representative immunoblot (B) and densitometric quantification of UFM1 pathway proteins in radioimmunoprecipitation assay (RIPA) buffer soluble (C) and insoluble (D) fractions of human normal and AD frontal cortex. UFM1 pathway protein levels were normalized to loading control beta-Actin and normalized to the median of the control cohort. Statistical analysis was performed using a Wilcoxon rank sum test followed by Bonferroni correction for testing two fractions, **P<0.00625, ***P<0.001; n.d. - not detected. (E) Quantification of total UFM1 via Meso Scale Discovery (MSD) enzyme-linked immunosorbent assay (ELISA). Data is shown as median with interquartile range. Statistical analysis was performed with Wilcoxon rank sum test followed by adjustment with Bonferroni correction for analyzing two fractions, *P<0.025, **P<0.01, ***P<0.001. (F) Soluble UFSP2 western blot levels are negatively correlated with soluble and insoluble total UFM1 levels that were determined by MSD ELISA. Shown is a heatmap of Spearman correlation coefficients (rS), **P<0.00625, ***P<0.001. n = 13 per group. See Supplementary Table S5 for rs and p values.
Figure 2:
Figure 2:. UFM1 and UFSP2 levels are altered in human AD brain.
(A) Quantification of RIPA-soluble (sol) and -insoluble (ins) UFM1 and UFSP2 levels, respectively, by MSD ELISA in the frontal and temporal cortex of AD cases (n=72) and controls (n=41). Median and interquartile range is indicated. Statistical analysis was performed with a Wilcoxon rank sum test, *P < 0.05, **P<0.01, ***P<0.001. Linear regression analysis is summarized in Table 1. (B) Heatmap of Spearman correlation coefficients (rs) illustrating strong correlation between soluble UFSP2 with mostly insoluble UFM1 and UFSP2 levels from temporal cortex or frontal cortex of controls, AD and of combined cases (control + AD, n=113). Indicated significance levels are from Spearman’s test after Bonferroni correction: *P<0. 0167, **P<0. 0033, ***P<0. 0003, ****P<0.0001. Significant correlations that were confirmed by multivariable linear regression analysis (Supplementary Table S6) have been underlined.
Figure 3:
Figure 3:. Soluble UFSP2 and insoluble UFM1 correlate with total and pS396/404-tau, respectively.
(A) Heatmap of Spearman correlation coefficients (rs) illustrating significant correlations of UFM1 and UFSP2 protein level with total and pS396/404-tau levels in the temporal and frontal cortex of controls (n=41), AD (n=72) or combined groups (control + AD, n=113). A significance level of P<0.0125 after Bonferroni correction was used for the analysis: *P<0.0125, **P<0.0025, ***P < 0.00025, ****P<0.0001. Significant correlations that were confirmed by multivariable linear regression analysis (Table 2) have been underlined.
Figure 4:
Figure 4:. UFSP2 KO protects against DNA damage.
(A) Heatmap of Spearman correlation coefficients (rs) illustrating correlations of soluble (sol) and insoluble (ins) UFM1 and UFSP2 protein levels, respectively, with the mRNA level of DNA damage related genes in the temporal cortex of AD subjects (n=72). mRNA levels were obtained by bulk RNAseq. A spearman’s test with significance level of P<0.05 was used for the analysis: *P<0.05, **P<0.01, ***P < 0.001, ****P<0.0001. See Supplementary Table S10 for rs and p values. (B, C) Differentiated neurons with WT, UFM1 KO, UFSP KO or UFM1 and UFSP2 double KO (dKO) were treated with 10 μM etoposide for the indicated times and stained for γH2AX (green). (B) Representative microscope images at the indicated time points are shown for each genotype. Scale bars: 20 μm. (C) Images were analyzed by high content imaging for γH2AX intensity. Three independent experiments with multiple wells each were quantified over time. Data is shown as mean ± SEM. Statistical significance was assessed with two-way ANOVA. Shown is the least significant comparison for UFSP2 KO neurons when compared against any of the other three genotypes: **P<0.01, ****P<0.0001. (D) Percentage of live neurons (WT, UFM1 KO, UFSP2 KO, dKO) upon treatment with 100 μM etoposide and 10 μM bleomycin for 72 h. Cells were stained with a viability dyes and imaged. Live cells were identified and quantified by high content imaging. The live cell count of the stressed neurons was normalized to the live cell count of DMSO-treated cells for each genotype. Shown is the mean ± SEM of 7 independent experiments. Statistical significance to WT was assessed by one-way ANOVA followed by Dunnett’s test: *P<0.05, ***P<0.001. Statistical significance between UFSP2 KO and dKO cells was determined by student’s t test: ****P<0.001.
Figure 5:
Figure 5:. UFSP2 KO neurons exhibit a stronger unfolded protein response and higher susceptibility towards ER stress.
(A) Heatmap of Spearman correlation coefficients (rs) illustrating significant correlations of soluble (sol) and insoluble (ins) UFM1 and UFSP2 protein levels, respectively, with the mRNA level of unfolded protein response related genes in the temporal cortex of AD subjects (n=72). mRNA levels were obtained by bulk RNAseq. A significance level of P<0.05 was used for the analysis: *P<0.05, **P<0.01, ***P< 0.001, ****P<0.0001. See Supplementary Table S11 for rs and p values. (B, C) Immunoblot analysis and quantification of expression of seven unfolded protein response related proteins in differentiated neurons with UFM1 KO, UFSP2 KO or a double KO (dKO) compared to isogenic controls (WT). Shown is the normalized mean ± SEM from four independent experiments. (D, E) Neurons (WT, UFM1 KO, UFSP2 KO or UFM1/UFSP2 double KO (dKO)) were treated with tunicamycin or thapsigargin for 16 hours, and then fixed and stained with anti-CHOP (red) and anti-Xbp1s (green) antibodies. Nuclei were labeled with Hoechst 33342 (blue). (D) Representative images are shown for untreated or treated neurons for each genotypes. Scale bars: 20 μm. (E) Images were analyzed by high content imaging for CHOP and Xbp1s intensity, respectively. Data is shown as mean ± SEM from n=5–6 independent experiments. Statistical comparison to WT was assessed with one-way ANOVA followed by Dunnett’s posthoc test: **P<0.01, ***P<0.001, ****P<0.0001. (F) Percentage of live neurons (WT, UFM1 KO, UFSP2 KO or UFM1/UFSP2 double KO (dKO)) upon treatment with tunicamycin of thapsigargin for 72 h. Cells were fixed and stained with viability/cytotoxicity dyes, imaged and analyzed by high content imaging. The number of live cells was normalized to the cell count of DMSO-treated cells for each genotype. Shown is the mean ± SEM of 3 independent experiments. Statistical significance was assessed with one-way ANOVA followed by Dunnett’s post-hoc test: **P<0.01, ***P<0.001.

References

    1. Komatsu M, Chiba T, Tatsumi K, Iemura S, Tanida I, Okazaki N, Ueno T, Kominami E, Natsume T, Tanaka K: A novel protein-conjugating system for Ufm1, a ubiquitin-fold modifier. Embo j 2004, 23:1977–1986. - PMC - PubMed
    1. Sasakawa H, Sakata E, Yamaguchi Y, Komatsu M, Tatsumi K, Kominami E, Tanaka K, Kato K: Solution structure and dynamics of Ufm1, a ubiquitin-fold modifier 1. Biochemical and Biophysical Research Communications 2006, 343:21–26. - PubMed
    1. Kang SH, Kim GR, Seong M, Baek SH, Seol JH, Bang OS, Ovaa H, Tatsumi K, Komatsu M, Tanaka K, Chung CH: Two novel ubiquitin-fold modifier 1 (Ufm1)-specific proteases, UfSP1 and UfSP2. J Biol Chem 2007, 282:5256–5262. - PubMed
    1. Mizushima T, Tatsumi K, Ozaki Y, Kawakami T, Suzuki A, Ogasahara K, Komatsu M, Kominami E, Tanaka K, Yamane T: Crystal structure of Ufc1, the Ufm1-conjugating enzyme. Biochemical and Biophysical Research Communications 2007, 362:1079–1084. - PubMed
    1. Bacik J-P, Walker JR, Ali M, Schimmer AD, Dhe-Paganon S: Crystal structure of the human ubiquitin-activating Enzyme 5 (UBA5) bound to ATP: MECHANISTIC INSIGHTS INTO A MINIMALISTIC E1 ENZYME. J Biol Chem 2010, 285:20273–20280. - PMC - PubMed

Publication types