. 2024 Jun 5:15:1412076.
doi: 10.3389/fimmu.2024.1412076. eCollection 2024.

Proliferating macrophages in human tumours show characteristics of monocytes responding to myelopoietic growth factors

Affiliations

Proliferating macrophages in human tumours show characteristics of monocytes responding to myelopoietic growth factors

Saem Mul Park et al. Front Immunol. .

Abstract

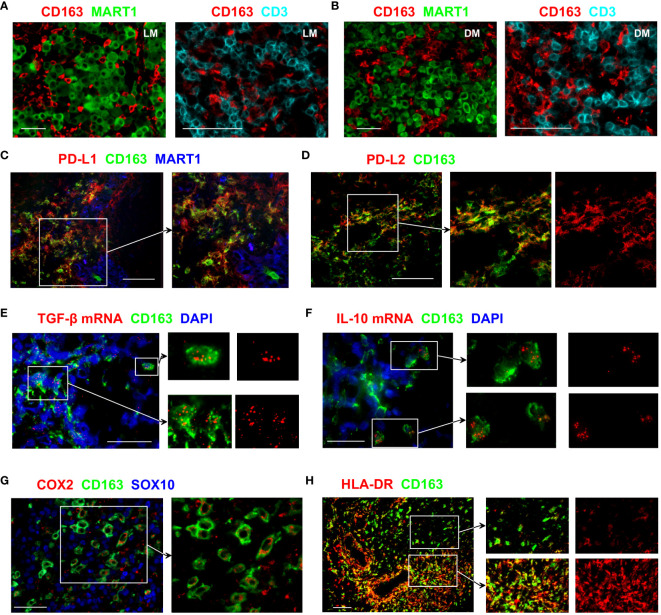
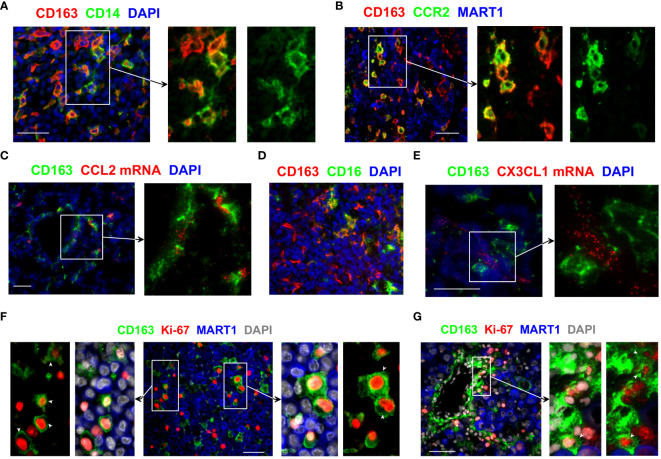
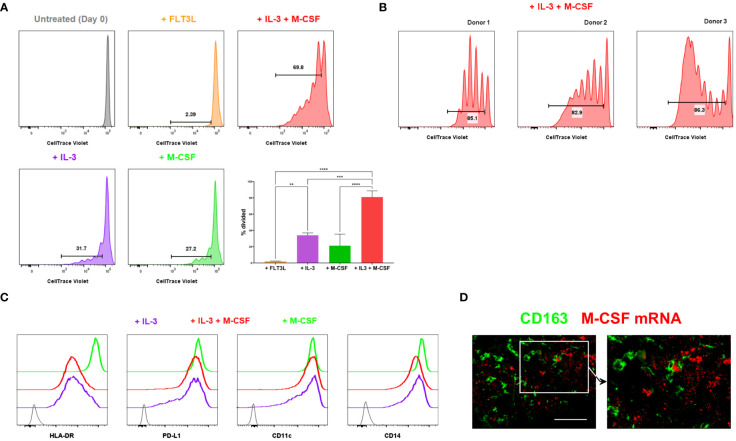
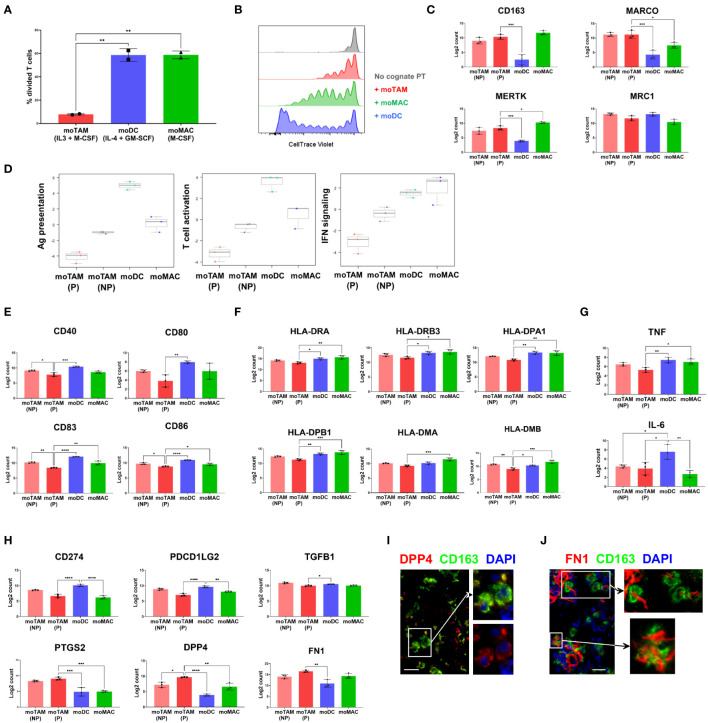
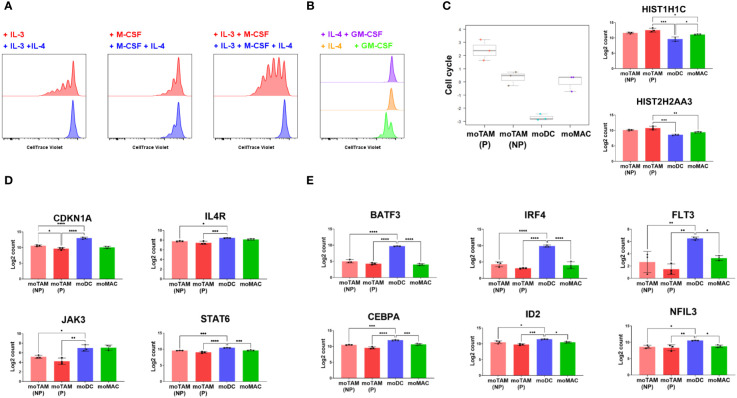
Macrophages play essential roles in maintaining tissue homeostasis and immune defence. However, their extensive infiltration into tumours has been linked to adverse outcomes in multiple human cancers. Within the tumour microenvironment (TME), tumour-associated macrophages (TAMs) promote tumour growth and metastasis, making them prime targets for cancer immunotherapy. Recent single-cell analysis suggest that proliferating TAMs accumulate in human cancers, yet their origins and differentiation pathways remain uncertain. Here, we show that a subpopulation of CD163+ TAMs proliferates in situ within the TME of melanoma, lung cancer, and breast cancer. Consistent with their potential role in suppressing anti-tumour activities of T cells, CD163+ TAMs express a range of potent immunosuppressive molecules, including PD-L1, PD-L2, IL-10, and TGF-β. Other phenotypic markers strongly suggested that these cells originate from CD14+ CCR2+ monocytes, a cell population believed to have minimal capacity for proliferation. However, we demonstrate in vitro that certain myelopoietic cytokines commonly available within the TME induce robust proliferation of human monocytes, especially the combination of interleukin 3 (IL-3) and Macrophage Colony-Stimulating Factor 1 (M-CSF). Monocytic cells cultured with these cytokines efficiently modulate T cell proliferation, and their molecular phenotype recapitulates that of CD163+ TAMs. IL-3-driven proliferation of monocytic cells can be completely blocked by IL-4, associated with the induction of CDKN1A, alongside the upregulation of transcription factors linked to dendritic cell function, such as BATF3 and IRF4. Taken together, our work suggests several novel therapeutic routes to reducing immunosuppressive TAMs in human tumours, from blocking chemokine-mediated recruitment of monocytes to blocking their proliferation.

Keywords: immunosuppression; macrophage proliferation; melanoma; tumour microenvironment; tumour-associated macrophages.


Conflict of interest statement

The authors declare that the research was conducted in the absence of any commercial or financial relationships that could be construed as a potential conflict of interest.

Figures

Figure 1
Figure 1
Immunosuppressive features of CD163+ TAMs. (A, B) Tissue sections from LN (A) or dermal (B) melanoma metastasis were probed with antibodies against CD163, MART1/Melan A and CD3 to assess the distribution of CD163+ TAMs, T cells and melanoma tumour cells. (C–H) Tissue sections from metastatic melanoma were stained with antibodies against the indicated markers to examine the functional phenotype of CD163+ TAMs. Images show that subsets of CD163+ TAMs express PD-L1, PD-L2, TGF-β, IL-10, COX2 and HLA-DR. Expression of MART1/Melan A and SOX10 shows the location of melanoma cells. In (E, F), transcripts of TGF-β and IL-10 were detected using fluorescent in situ hybridisation. DAPI was used as a nuclear stain. Data shown are representative of at least 3 to 10 different metastatic melanoma cases. Scale bars represent 50 µm (A, B, E, F, H) or 100 µm (C, D, G). Magnification: x10 (A, B left, H), x20 (A, B right, C–E, G) and x40 (F). LN metastasis. DM, dermal metastasis.
Figure 2
Figure 2
Monocytic origin of CD163+ TAMs and their proliferation within the melanoma TME. (A, B, D) The phenotype of CD163+ TAMs was assessed by co-staining with antibodies against CD14, CCR2 and CD16. (C, E) Tissue sections were examined for CCL2 and CX3CL1 mRNA using fluorescent in situ hybridisation and subsequently stained anti-CD163 to locate CD163+ TAMs. (F, G) Tissue sections from metastatic melanoma were probed with antibodies against CD163 and Ki-67 to assess the proliferation of CD163+ TAMs. MART1/Melan A expression was used to locate melanoma cells. DAPI was used as a nuclear stain. Results shown are representative of at least 3 to 15 different metastatic melanoma cases. Scale bars represent 50 µm. Magnification: x20 (A–D) and x40 (E–G).
Figure 3
Figure 3
Proliferation of monocytic cells induced by myelopoietic growth factors. (A, B) Monocytes isolated from human blood were CTV-labelled and cultured with the indicated cytokines. In vitro proliferation of monocytic cells was assessed by flow cytometry. The depicted cells were gated on live, CD14+ HLA-DR+ monocytic cells. The percentages of divided cells are shown. Bar graphs shown in (A) are from the combined data from 3 independent experiments. Plots in (B) show the donor-to-donor variability in the proliferation of monocytic cells induced by IL-3 and M-CSF. (C) Monocytic cells cultured in varying cytokine conditions were examined for their cell surface expression of HLA-DR, PD-L1, CD11c and CD14 using flow cytometry. Grey indicates unstained negative control. Data shown in (A–C) are representative of at least 3 independent experiments using different biological replicates. (D) M-CSF mRNA was detected using fluorescent in situ hybridisation. Tissue sections were co-stained with anti-CD163 to locate CD163+ TAMs. Data represent 4 different metastatic melanoma cases. Scale bars represent 100 µm. Magnification: x20 (D). ****P <0.0001, *** P < 0.001, ** P < 0.01.
Figure 4
Figure 4
Functional and molecular characteristics of different monocytic populations. (A) CTV-labelled allogenic T cells were co-cultured with in-vitro generated moTAMs (IL-3 + M-CSF), moDCs (IL-4 + GM-CSF), or moMAC (M-CSF). The percentages of divided T cells, assessed by CTV dilution assay using flow cytometry, are shown. From live, single cells, co-cultured CD14+ monocytic cells were excluded, and T cells were identified as CD3+ cells. Data are representative of 4 independent experiments and shown as the mean with the error bars indicating the range of responses for duplicate samples. (B) Antigen-specific CD8+ T cell clones were labelled with CTV and added to PBMCs pulsed with ELA peptides. The cells were then co-cultured with moTAMs, moDCs or moMACs, and the division of T cell clones was measured. Grey indicates a negative control with the T cell clones cultured without the peptide-pulsed PBMCs. The results shown are from a replicate using untouched CD14+ monocytic cells cultured with different cytokines and representative of 4 different experiments. (C) Expression of the TAM-signature genes in monocytic cell subsets generated in vitro. (D) Pathway scores for Ag presentation, T cell activation, and IFN signalling were generated based on the gene expression profiles of different monocytic types. (E–H) Expressions of the genes encoding the activation markers (E), MHC II molecules (F), pro-inflammatory cytokines (G), and immunosuppressive (H) molecules are shown. Bar graphs are from the experiment using 3 different monocyte donors and are shown as the mean with standard deviation. Statistically significant differences between different cell subsets are indicated (ANOVA): ****P <0.0001, *** P < 0.001, ** P < 0.01, *P < 0.05. (I, J) Protein expression of DPP4 and FN1 by CD163+ TAMs was examined by fluorescence microscopy. Data are representative of 3 different metastatic melanoma cases. Scale bars represent 25 µm. Magnification: x20 (I, J).
Figure 5
Figure 5
Antiproliferative effects of IL-4 on the proliferation of monocytic cells. (A, B) CTV-labelled monocytic cells were cultured in the indicated cytokine conditions, and their proliferation was tracked by flow cytometry. Data represent three independent experiments. (C) Bar graphs show cell cycle scores from in vitro generated monocytic cells and their expression of the genes involved in the cell cycle progression. (D) Bar graphs show the expression of CDKN1A, IL4R, JAK3 and STAT6 in different monocytic subsets. (E) Results show the relative expression of the genes involved in DC differentiation. Gene expression profiles shown in (C–E) were assessed by analysing RNA extracted from each cell type using the Human Myeloid Panel gene expression assay. Bar graphs above are from the experiment using 3 different monocyte donors and are shown as the mean with standard deviation. Statistically significant differences between different monocytic subsets are indicated (ANOVA): ****P <0.0001, *** P < 0.001, ** P < 0.01, *P < 0.05.

Similar articles

Cited by

References

    1. Cassetta L, Pollard JW. Targeting macrophages: therapeutic approaches in cancer. Nat Rev Drug discovery. (2018) 17:887–904. doi: 10.1038/nrd.2018.169 - DOI - PubMed
    1. Mulder K, Patel AA, Kong WT, Piot C, Halitzki E, Dunsmore G, et al. . Cross-tissue single-cell landscape of human monocytes and macrophages in health and disease. Immunity. (2021) 54:1883–900 e5. doi: 10.1016/j.immuni.2021.07.007 - DOI - PubMed
    1. Komohara Y, Jinushi M, Takeya M. Clinical significance of macrophage heterogeneity in human Malignant tumors. Cancer science. (2014) 105:1–8. doi: 10.1111/cas.12314 - DOI - PMC - PubMed
    1. Lee WJ, Lee MH, Kim HT, Won CH, Lee MW, Choi JH, et al. . Prognostic significance of CD163 expression and its correlation with cyclooxygenase-2 and vascular endothelial growth factor expression in cutaneous melanoma. Melanoma Res. (2019) 29:501–9. doi: 10.1097/CMR.0000000000000549 - DOI - PubMed
    1. Etzerodt A, Tsalkitzi K, Maniecki M, Damsky W, Delfini M, Baudoin E, et al. . Specific targeting of CD163(+) TAMs mobilizes inflammatory monocytes and promotes T cell-mediated tumor regression. J Exp Med. (2019) 216:2394–411. doi: 10.1084/jem.20182124 - DOI - PMC - PubMed

MeSH terms