Investigating cellular similarities and differences between upper tract urothelial carcinoma and bladder urothelial carcinoma using single-cell sequencing
- PMID: 38903524
- PMCID: PMC11187293
- DOI: 10.3389/fimmu.2024.1298087
Investigating cellular similarities and differences between upper tract urothelial carcinoma and bladder urothelial carcinoma using single-cell sequencing
Abstract
Background: Upper tract urothelial carcinoma (UTUC) and bladder urothelial carcinoma (BLCA) both originate from uroepithelial tissue, sharing remarkably similar clinical manifestations and therapeutic modalities. However, emerging evidence suggests that identical treatment regimens may lead to less favorable outcomes in UTUC compared to BLCA. Therefore, it is imperative to explore molecular processes of UTUC and identify biological differences between UTUC and BLCA.
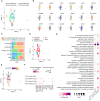
Methods: In this study, we performed a comprehensive analysis using single-cell RNA sequencing (scRNA-seq) on three UTUC cases and four normal ureteral tissues. These data were combined with publicly available datasets from previous BLCA studies and RNA sequencing (RNA-seq) data for both cancer types. This pooled analysis allowed us to delineate the transcriptional differences among distinct cell subsets within the microenvironment, thus identifying critical factors contributing to UTUC progression and phenotypic differences between UTUC and BLCA.
Results: scRNA-seq analysis revealed seemingly similar but transcriptionally distinct cellular identities within the UTUC and BLCA ecosystems. Notably, we observed striking differences in acquired immunological landscapes and varied cellular functional phenotypes between these two cancers. In addition, we uncovered the immunomodulatory functions of vein endothelial cells (ECs) in UTUC, and intercellular network analysis demonstrated that fibroblasts play important roles in the microenvironment. Further intersection analysis showed that MARCKS promote UTUC progression, and immunohistochemistry (IHC) staining revealed that the diverse expression patterns of MARCKS in UTUC, BLCA and normal ureter tissues.
Conclusion: This study expands our multidimensional understanding of the similarities and distinctions between UTUC and BLCA. Our findings lay the foundation for further investigations to develop diagnostic and therapeutic targets for UTUC.
Keywords: cellular heterogeneity; interaction network; single-cell RNA sequencing; tumor microenvironment; upper tract urothelial carcinoma.
Copyright © 2024 Zhang, Wang, Qin, Ye, Mo, Meng, Yang, Feng, Lin, Xian, Wei, Chen, Wang and Mo.
Conflict of interest statement
The authors declare that the research was conducted in the absence of any commercial or financial relationships that could be construed as a potential conflict of interest.
Figures


Similar articles
-
Expression Analysis of Same-Patient Metachronous and Synchronous Upper Tract and Bladder Urothelial Carcinoma.J Urol. 2021 Sep;206(3):548-557. doi: 10.1097/JU.0000000000001788. Epub 2021 Apr 21. J Urol. 2021. PMID: 33881933
-
Single-Cell RNA Sequencing Reveals the Tumor Heterogeneity and Immunosuppressive Microenvironment in Urothelial Carcinoma.Cancer Sci. 2025 Mar;116(3):710-723. doi: 10.1111/cas.16436. Epub 2024 Dec 26. Cancer Sci. 2025. PMID: 39726326 Free PMC article.
-
Upper tract urothelial carcinoma has a luminal-papillary T-cell depleted contexture and activated FGFR3 signaling.Nat Commun. 2019 Jul 5;10(1):2977. doi: 10.1038/s41467-019-10873-y. Nat Commun. 2019. PMID: 31278255 Free PMC article.
-
Distinct patterns and behaviour of urothelial carcinoma with respect to anatomical location: how molecular biomarkers can augment clinico-pathological predictors in upper urinary tract tumours.World J Urol. 2013 Feb;31(1):21-9. doi: 10.1007/s00345-012-0946-6. Epub 2012 Sep 18. World J Urol. 2013. PMID: 22986906 Review.
-
Synchronous and metachronous urothelial carcinoma of the upper urinary tract and the bladder: Are they clonally related? A systematic review.Urol Oncol. 2020 Jun;38(6):590-598. doi: 10.1016/j.urolonc.2020.01.008. Epub 2020 Feb 11. Urol Oncol. 2020. PMID: 32057596
Cited by
-
Machine Learning-Based Gene Expression Analysis to Identify Prognostic Biomarkers in Upper Tract Urothelial Carcinoma.Cancers (Basel). 2025 Aug 11;17(16):2619. doi: 10.3390/cancers17162619. Cancers (Basel). 2025. PMID: 40867248 Free PMC article.
-
Nectin-4 expression in upper and lower tract urothelial carcinoma: correlation with early-stage disease and prognostic relevance.Virchows Arch. 2025 Jun 27. doi: 10.1007/s00428-025-04164-9. Online ahead of print. Virchows Arch. 2025. PMID: 40571752
References
-
- Fukushima H, Yoshida S, Kijima T, Nakamura Y, Fukuda S, Uehara S, et al. . Combination of cisplatin and irradiation induces immunogenic cell death and potentiates postirradiation anti-PD-1 treatment efficacy in urothelial carcinoma. Int J Mol Sci. (2021) 22:535. doi: 10.3390/ijms22020535 - DOI - PMC - PubMed
-
- Tang Q, Zuo W, Wan C, Xiong S, Xu C, Yuan C, et al. . Comprehensive genomic profiling of upper tract urothelial carcinoma and urothelial carcinoma of the bladder identifies distinct molecular characterizations with potential implications for targeted therapy & immunotherapy. Front Immunol. (2022) 13:1097730. doi: 10.3389/fimmu.2022.1097730 - DOI - PMC - PubMed
MeSH terms
LinkOut - more resources
Full Text Sources
Medical
Miscellaneous

