. 2024 Jun 19;8(6):e90.
doi: 10.1002/hem3.90. eCollection 2024 Jun.

The ETO2 transcriptional cofactor maintains acute leukemia by driving a MYB/EP300-dependent stemness program

Affiliations

The ETO2 transcriptional cofactor maintains acute leukemia by driving a MYB/EP300-dependent stemness program

Alexandre Fagnan et al. Hemasphere. .

Abstract

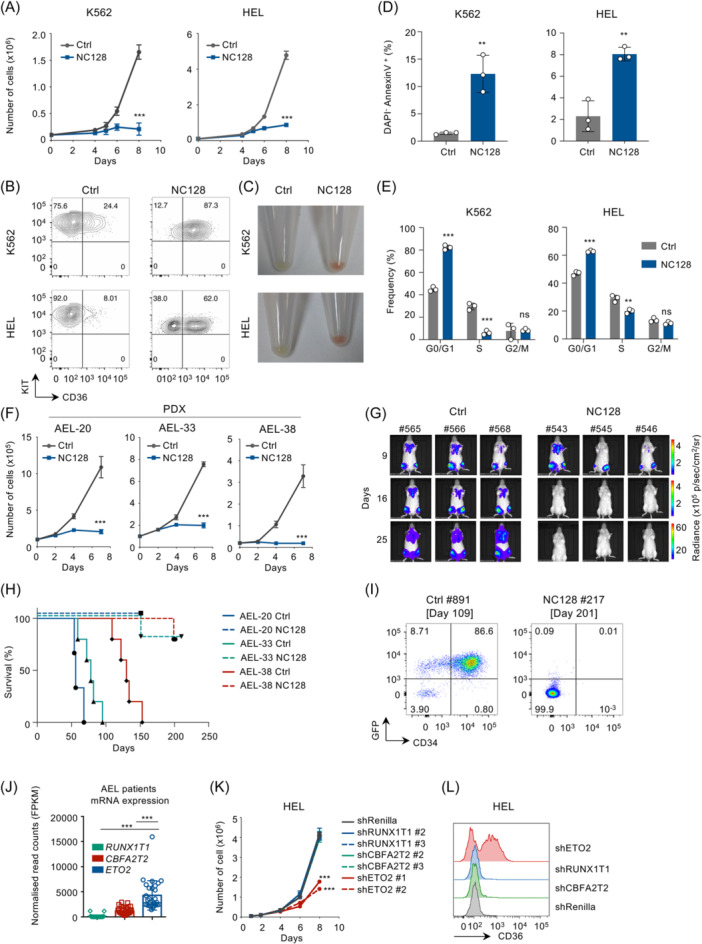
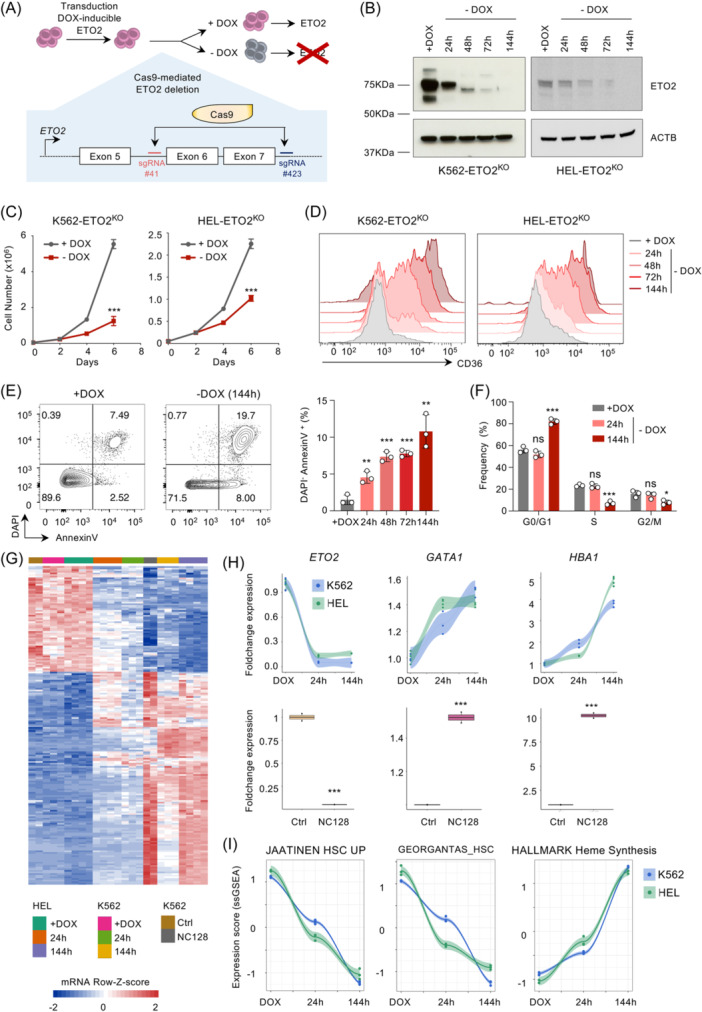
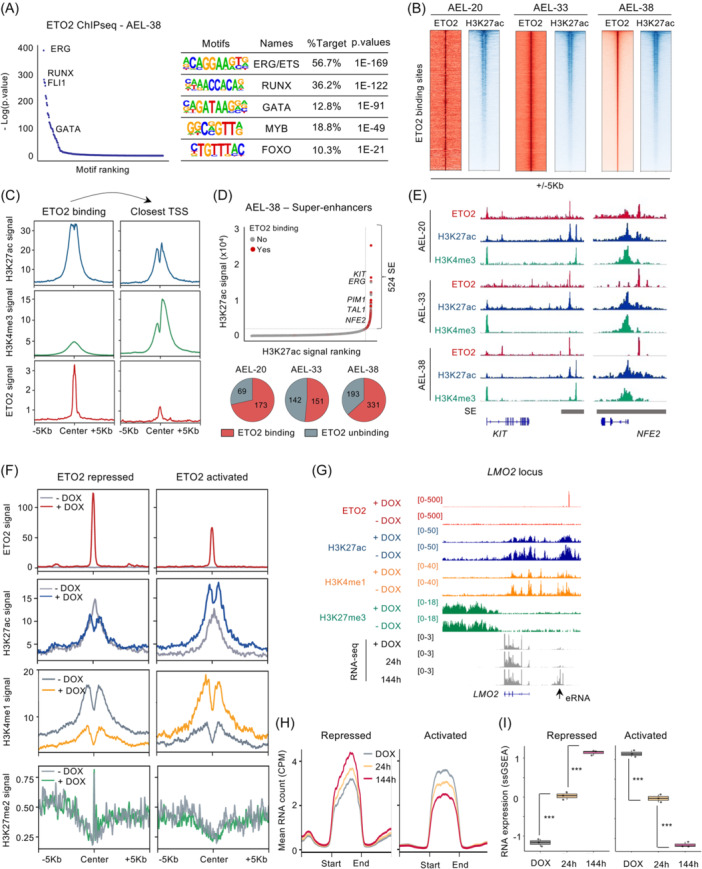
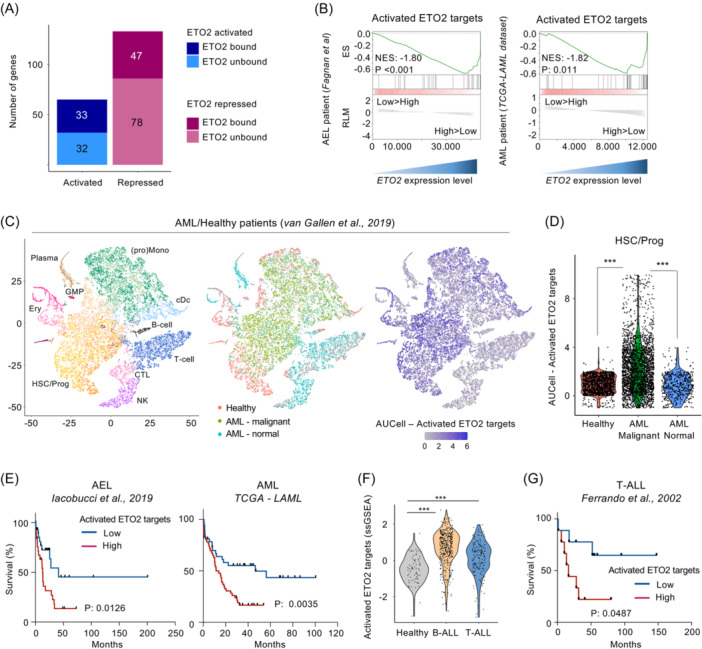
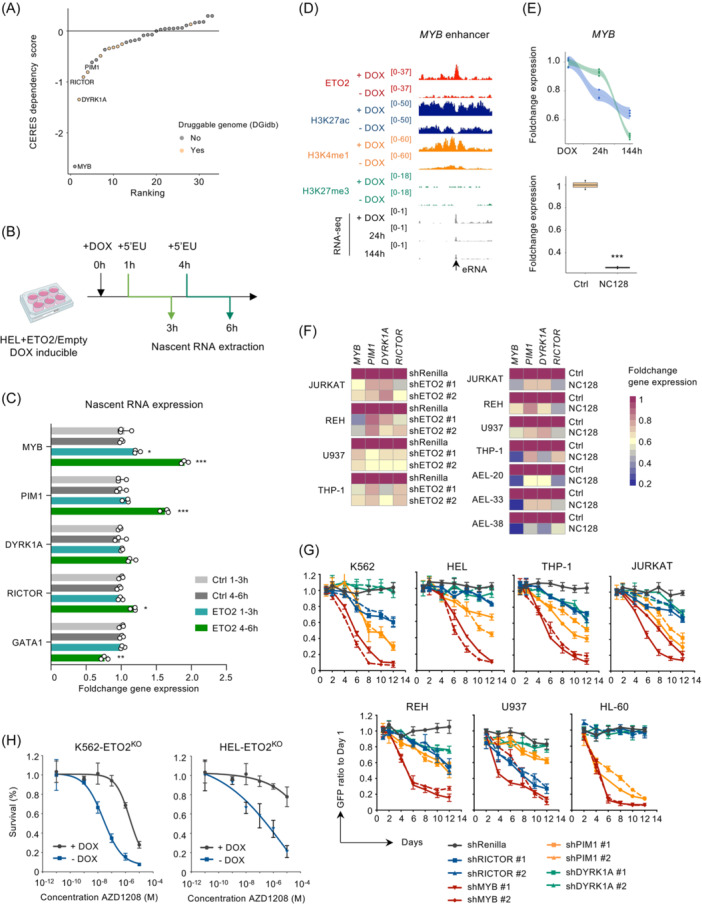
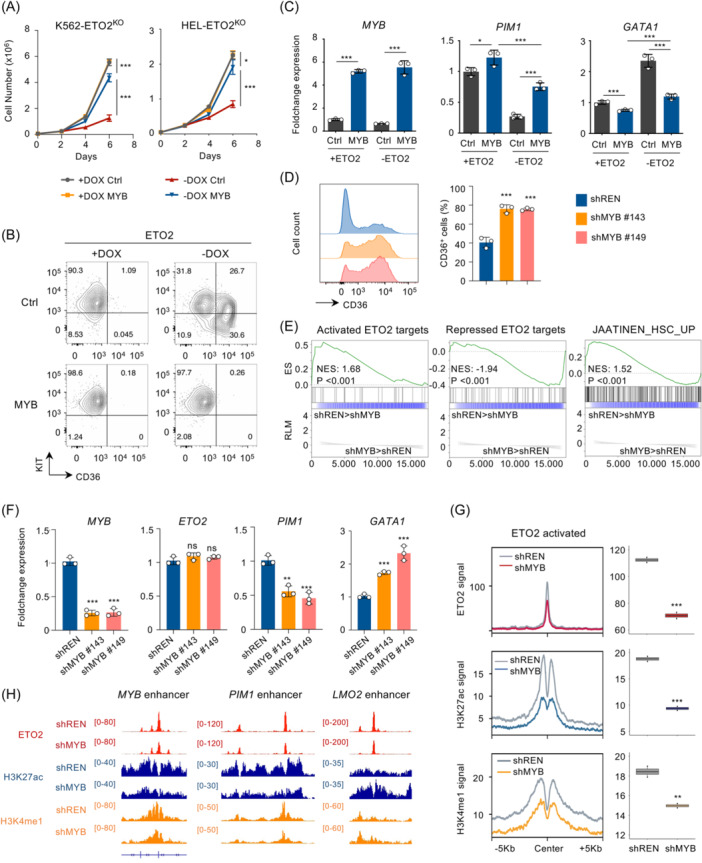
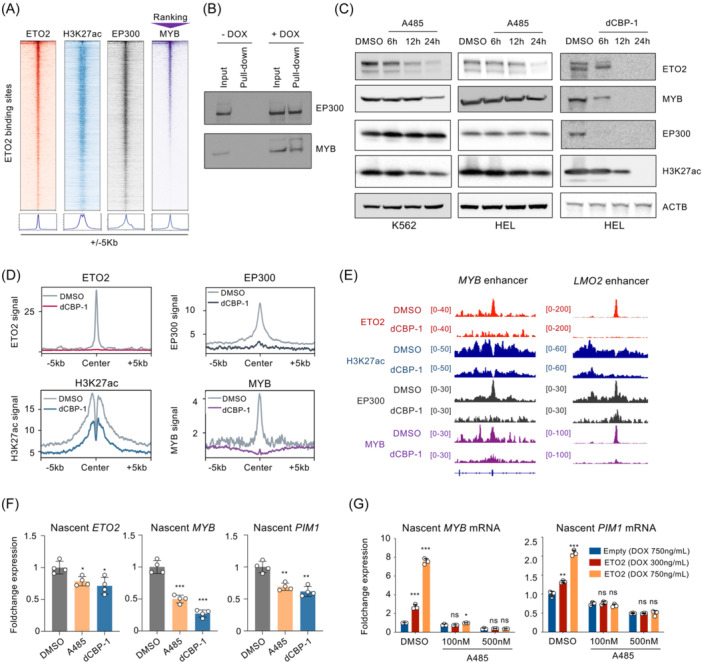
Transcriptional cofactors of the ETO family are recurrent fusion partners in acute leukemia. We characterized the ETO2 regulome by integrating transcriptomic and chromatin binding analyses in human erythroleukemia xenografts and controlled ETO2 depletion models. We demonstrate that beyond its well-established repressive activity, ETO2 directly activates transcription of MYB, among other genes. The ETO2-activated signature is associated with a poorer prognosis in erythroleukemia but also in other acute myeloid and lymphoid leukemia subtypes. Mechanistically, ETO2 colocalizes with EP300 and MYB at enhancers supporting the existence of an ETO2/MYB feedforward transcription activation loop (e.g., on MYB itself). Both small-molecule and PROTAC-mediated inhibition of EP300 acetyltransferases strongly reduced ETO2 protein, chromatin binding, and ETO2-activated transcripts. Taken together, our data show that ETO2 positively enforces a leukemia maintenance program that is mediated in part by the MYB transcription factor and that relies on acetyltransferase cofactors to stabilize ETO2 scaffolding activity.


Conflict of interest statement

The authors declare no conflict of interest.

Figures

Figure 1
Figure 1
ETO protein activity is essential for erythroleukemia cell survival. (A) Cell proliferation of the human erythroid cell lines K562 and HEL transduced with the NC128 or empty lentiviral (Ctrl) vectors expressing also a GFP reporter. Transduced (GFP+) cells were sorted 24 h after transduction, 100.000 cells per replicate were plated in culture medium for proliferation assay, and viable cells were then enumerated over time using trypan blue reagent; n = 3 technical replicates. (B) KIT and CD36 expression measured by flow cytometry in K562 and HEL erythroid cell lines expressing NC128 or empty vector (Ctrl) at 72 h posttransduction. The plots are gated on viable (SYTOX Blue‐negative) GFP+ (expressing NC128/Ctrl) cells as represented in Figure S1A. The result is representative of n = 3 technical replicates. (C) Photographs of pelleted K562 and HEL cell lines 5 days posttransduction with NC128 or empty vector (Ctrl). GFP+ cells were sorted 24 h after transduction and plated in culture medium. (D) Quantification of DAPI AnnexinV+ cells measured by flow cytometry in HEL and K562 cell lines expressing NC128 or empty vector (Ctrl) at 72 h posttransduction. GFP+ cells were sorted 24 h after transduction and 500.000 cells per replicate were plated in culture medium. Plots are gated on single GFP+ cells as represented in Figure S1B; n = 3 technical replicates per condition. (E) Cell cycle analysis performed by DNA quantification using 4′,6‐diamidino‐2‐phenylindole staining and measured by flow cytometry in HEL and K562 cell lines expressing NC128 or empty vector (Ctrl); 72 h posttransduction. Plots are gated as represented in Figure S1C. GFP+ cells were sorted 24 h after transduction and 500.000 cells per replicate were plated in culture medium; n = 3 technical replicates per condition. (F) Cell proliferation of AEL PDX models (AEL‐20, AEL‐33, and AEL‐38) expressing NC128 or empty vector (Ctrl) maintained ex vivo. GFP+ cells were sorted 24 h after transduction and 100.000 cells (AEL‐20 & AEL‐33) or 20.000 cells (AEL‐38) per replicate were plated in culture medium. Viable cells were enumerated using trypan blue reagent; n = 3 technical replicates. (G) Whole‐body bioluminescence images of NSG mice injected with 5 × 105 of patient‐derived luciferase‐positive AEL cells (AEL‐20) expressing NC128 (mice #543, #544, and #546) or empty vector (Ctrl; mice #565, #566, and #568). Cells were transduced and sorted at 24 h posttransduction based on high GFP level and then transplanted in recipient mice. Mice were analyzed at 9, 16, and 25 days posttransplantation (n = 3 recipients per group; luciferase intensity are represented as photons/s/cm2/sr [p/s/cm2/sr]). (H) Kaplan–Meier survival curve of NSG recipient mice transplanted with 5 × 105 of AEL PDX cells (AEL‐20, n = 3 technical replicates/group; AEL‐33, n = 5 technical replicates/group or AEL‐38, n = 5 technical replicates/group) expressing NC128 or empty vector (Ctrl). For two animals in the NC128 groups, while we have no evidence that these animals had a phenotypic leukemia, a death event was indicated because either an animal was found dead in cage and showed a significant proportion of GFP‐negative human cells quantified by flow cytometry (AEL‐33 #521), or no flow cytometry data were available to exclude the lack of human cells (AEL‐38 #284). (I) Flow cytometry analysis of the bone marrow from NSG recipient mice injected with 5 × 105AEL PDX cells (AEL‐38) transduced with either NC128 (mouse ID #217) or empty (Ctrl; mouse ID #891) lentiviruses. Analyses were performed at day 201 and 109 posttransplantation, respectively. Plot representing human CD34 and GFP expression was gated on viable (SYTOX Blue‐negative) cells. (J) Histogram representing RUNX1T1, CBFA2T2, and ETO2 genes expression measured by RNA‐seq in AEL patient samples; n = 29 patients. (K) Cell proliferation of HEL cell line expressing short hairpin RNA (shRNA) targeting RUNX1T1, CBFA2T2, ETO2, or Renilla, using 2 shRNA per genes. GFP+ cells were sorted 24 h after transduction, and 50.000 cells per replicate were plated in culture medium. Viable cells were enumerated using trypan blue reagent; n = 3 technical replicates. (L) Flow cytometry analysis of human CD36 gene expression of HEL cell line expressing shRNA targeting RUNX1T1, CBFA2T2, ETO2, or Renilla. GFP+ cells were sorted 24 h after transduction and plated in culture medium. Analysis was performed at 72 h posttransduction. Plots were gated on viable (SYTOX Blue‐negative) GFP+ (expressing shRNA) cells as shown in Figure S2D; n = 3 technical replicates. Data in (C) are representative of >4 independent experimental repeats, and data in (A, B, D, E, K, L) are representative of three independent experimental repeats. Mean ± SEM is represented. Statistical significance is indicated as p‐values (Student t test except when otherwise specified). *p < 0.05; **p < 0.01; ***p < 0.001.
Figure 2
Figure 2
Identification of ETO2‐specific target genes. (A) Experimental design of CRISPR/Cas9‐mediated ETO2 knockout using the erythroid cell line K562 and HEL expressing ETO2 in an inducible manner, generating 2 genetically engineered cell lines: K562‐ETO2KO and HEL‐ETO2KO. (B) Western blot analysis of exogeneous ETO2 and actin (ACTB) protein levels in HEL‐ETO2KO and K562‐ETO2KO cell lines with doxycycline (+DOX) or at 24, 48, 72, and 144 h after doxycycline depletion from culture media (−DOX). (C) Cell proliferation of K562‐ETO2KO and HEL‐ETO2KO cell lines ±DOX. Viable cells were enumerated using trypan blue reagent; n = 3 technical replicates per condition. (D) Flow cytometry analysis of human CD36 expression in K562‐ETO2KO and HEL‐ETO2KO + DOX or at 24, 48, 72, and 144 h after DOX withdrawal. Plots are gated on viable (SYTOX Blue‐negative) cells. FACS plots are representative of n = 3 technical replicates. (E) Quantification of 4′,6‐diamidino‐2‐phenylindole (DAPI) AnnexinV+ cells measured by flow cytometry in HEL‐ETO2KO + DOX or at 24, 48, 72, and 144 h after DOX withdrawal. Both FACS plots and histograms are represented. FACS plots are representative of n = 3 technical replicates. (F) Cell cycle analysis performed by DNA quantification using DAPI staining and measured by flow cytometry in HEL‐ETO2KO + DOX or at 24 and 144 h after DOX withdrawal; n = 3 technical replicates per condition. (G) Heatmap representation of differentially expressed genes measured by RNA‐seq, shared between K562‐ETO2KO & HEL‐ETO2KO at 24 or 144 h after DOX withdrawal compared to +DOX and K562 expressing NC128 or empty control (Ctrl). Row‐Z‐score were computed separately for K562‐ETO2KO (n = 3 technical replicates per condition), HEL‐ETO2KO (n = 4 technical replicates per condition), and K562 expressing NC128 (n = 2 technical replicates per condition) and then merged for heatmap representation. (H) Dot/line plot and histogram representation of ETO2, GATA1, and HBA1 foldchange gene expression quantified by RNA‐seq, in K562‐ETO2KO (n = 3 technical replicates per condition) and HEL‐ETO2KO (n = 4 technical replicates per condition) at 24 and 144 h after DOX withdrawal compared to +DOX and K652 expressing NC128 as compared to empty control (Ctrl; n = 2 technical replicates per condition). (I) Dot/line plot representation of GSEA scoring performed using ssGSEA R package on K562‐ETO2KO (n = 3 technical replicates per condition) and HEL‐ETO2KO (n = 4 technical replicates per condition) +DOX or at 24 and 144 h after DOX withdrawal using the gene expression signature JAATINEN_HSC_UP, Georgantas_HSC and Hallmark_Heme_synthesis from MSigDB database (https://www.gsea-msigdb.org/gsea/index.jsp). Data in (B–D) are representative of >4 independent experimental repeats; data in (E–F) are representative of three independent experimental repeats. Mean ± SEM is represented. Statistical significance is indicated as p‐values (Student t test except when otherwise specified). *p < 0.05; **p < 0.01; ***p < 0.001.
Figure 3
Figure 3
Genome‐wide ETO2 chromatin binding in human erythroleukemia. (A) Dot plot showing the –log(p value) and motif ranking under ETO2 peaks in AEL‐38 PDX cells determined using HOMER algorithm. Table of motif analysis under ETO2 peaks is also presented (right panel). Several motifs of known or unknown ETO2 partners including ERG, RUNX, GATA, MYB, and FOXO are represented. Motifs, associated transcription factors, percentages of peaks containing the motif, and p‐values are shown. (B) Heatmap representation of ETO2 and H3K27ac ChIP‐seq signals centered on ETO2 binding sites in AEL‐20, AEL‐33, and AEL‐38. ETO2 and H3K27ac signals are represented at ±5 kb based on ETO2 peak centers. (C) Line plot of H3K27ac, H3K4me3, and ETO2 ChIP‐seq signals under ETO2 peaks or centered on the closest TSS of ETO2 binding sites determined in AEL‐38 PDX cells. (D) Dot plot representing enhancers ranked by H3K27ac occupancy signals in AEL patient‐derived xenograft AEL‐38. Super‐enhancers were defined by H3K27ac occupancy signals upper the threshold computed by ROSE algorithm. The presence/absence of ETO2 binding in enhancers is represented by red (presence) or grey (absence) dots as well as by the pie chart diagram. (E) Picture representing ETO2, H3K27ac, and H3K4me3 ChIP‐seq signal at KIT and NFE2 genes in AEL PDX models AEL‐20, AEL‐33, and AEL‐38. Defined super‐enhancer regions are also represented in grey. (F) Line plot of ETO2, H3K27ac, H3K4me1, and H3K27me3 ChIP‐seq signal at ETO2 binding sites associated to repressed or activated ETO2 targets in HEL‐ETO2KO maintained with doxycycline (+DOX) or 144 h post‐DOX withdrawal (−DOX). (G) Visualization of ChIP‐seq signal of ETO2, H3K27ac, H3K4me1, and H3K27me3 as well as RNA‐seq count in HEL‐ETO2KO + DOX or at 24 and 144 h after DOX withdrawal. Location of enhancer RNA (eRNA) is shown. (H) Line plot of normalized RNA count quantified by RNA‐seq in HEL‐ETO2KO + DOX or at 24 and 144 h after DOX withdrawal, localized at ETO2 binding sites associated to repressed or activated ETO2 targets. Plot is representative of n = 4 independent samples per group. (I) Histogram representation of GSEA scoring computed by ssGSEA R package using RNA count quantified in HEL‐ETO2KO + DOX or at 24 and 144 h after DOX withdrawal, localized at ETO2 binding sites associated to repressed or activated ETO2 targets; n = 4 technical replicates per condition. Statistical significance is indicated as p‐values (Student t test except when otherwise specified). *p < 0.05; **p < 0.01; ***p < 0.001.
Figure 4
Figure 4
Characterization of ETO2 direct target genes in human leukemia. (A) Histogram representation of genes commonly activated/repressed by ETO2 in K562‐ETO2KO, HEL‐ETO2KO, and K562 expressing NC128, associated with ETO2 binding or not (unbound). (B) Gene set enrichment analysis (GSEA) comparing patient samples with high ETO2 expression (33% higher) versus low ETO2 expression (33% lower) in RNAseq data of AEL patient samples and AML patient samples (NIH ‐ TCGA‐LAML dataset) using the 33 activated ETO2 target signatures. NES score and p‐value (P) are represented. (C) t‐SNE representation of 14 pooled AML patients and healthy donors' single‐cell RNAseq previously annotated. Each dot represents a single cell. Dots were colored according to predicted cell type previously annotated (T cell, CTL, natural killer cell [NK], hematopoietic stem cell [HSC], immature hematopoietic progenitor [Prog], erythroid progenitor [Ery], B cell, plasma cell [Plasma], dendritic cell progenitor [pDC], and (pro)monocyte), predicted cell population (healthy [red], AML malignant [green], AML normal counterpart [blue]) as well as activated ETO2 target score defined using AUCell R package on the 33 activated ETO2 targets. (D) Violin plot representation of activated ETO2 target score (computed using AUCell R package) comparing healthy donors, AML malignant cells, and AML normal counterpart cells in HSC/Prog cell fraction defined from (C). (E) Kaplan–Meier survival curve of patients presenting a high (red) or low (blue) activated ETO2 target score (computed using ssGSEA R package) in two distinct cohorts of patient with AEL; n = 28 patient sample per group) and AML (NIH ‐ TCGA‐LAML database; n = 38 patient sample per group). AML patients presenting a RUNX1‐RUNX1T1 translocation were excluded from the analysis; p‐value (P) is represented. (F) Violin plot representing activated ETO2 target score in healthy bone marrow (n = 73 patient samples), B‐ALL (n = 442 patient samples), and T‐ALL (n = 173 patient samples) patient samples. Data originated from the MILE leukemia study. (G) Kaplan–Meier survival curve of T‐ALL patients presenting a high (red) or low (blue) activated ETO2 target score; n = 9 patient sample per group. Statistical significance is indicated as p‐values (Student t test except when otherwise specified). *p < 0.05; **p < 0.01; ***p < 0.001.
Figure 5
Figure 5
Molecular targeting of essential ETO2‐activated genes in human leukemia. (A) Median of CERES dependency score for each of the 33 activated ETO2 target genes in 17 acute myeloid leukemia (AML) cell lines. (B) Schematic experimental design of nascent RNA extraction between 1–3h and 4–6 h postdoxycycline (DOX) induction of ectopic ETO2 expression or empty vector (Ctrl) in the HEL cell line. (C) Histogram representation of MYB, PIM1, DYRK1A, RICTOR, and GATA1 nascent gene expression measured by quantitative reverse‐transcription polymerase chain reaction (RT‐qPCR) between 1–3 h and 4–6 h post‐DOX induction of ectopic ETO2 expression or empty vector (Ctrl) in the HEL cell line, n = 3 technical replicates per condition. (D) Dot/line plot and histogram representation of MYB foldchange gene expression quantified by RNA‐seq, in K562‐ETO2KO (n = 3 technical replicates per condition) and HEL‐ETO2KO (n = 4 technical replicates per condition) at 24 and 144 h after DOX withdrawal compared to +DOX and K652 expressing NC128 as compared to empty control (Ctrl; n = 2 technical replicates per condition). (E) Visualization of ChIP‐seq signal of ETO2, H3K27ac, H3K4me1, and H3K27me3 as well as RNA‐seq count in HEL‐ETO2KO + DOX or at 24 and 144 h after DOX withdrawal. Location of enhancer RNA (eRNA) is shown. (F) Heatmap representation of MYB, PIM1, DYRK1A, and RICTOR gene expression quantified by RT‐qPCR in several AEL PDX models (AEL‐20, AEL‐33, and AEL‐38), AML (U937 and THP‐1) cell line, and ALL (JURKAT and REH) cell line expressing either short hairpin RNA (shRNA) targeting ETO2 (#1 and #2) or Renilla or NC128 or empty vector (Ctrl); n = 3 technical replicates per condition. (G) Lineplot representation of GFP ratio (Day X/Day 1) postdoxycycline induction of shRNA targeting RICTOR, MYB, PIM1, DYRK1A, or Renilla genes in AEL (HEL and K562), AML (THP‐1 and HL‐60), and ALL (JURKAT and REH). GFP intensity analyzed by flow cytometry; 2 shRNA were used per genes (#1 and #2); n = 3 technical replicates per condition. (H) Dose‐response curve for proliferation of K562‐ETO2KO and HEL‐ETO2KO maintained with (grey) or without (blue) doxycycline in media culture, treated for 6 days with the indicated AZD1208 concentrations. Mean ± SD; n = 3 technical replicates. Data in (F) are representative of three independent experimental repeats; data in (C–E) are representative of two independent experimental repeats. Mean ± SEM is represented. Statistical significance is indicated as p‐values (Student t test except when otherwise specified). *p < 0.05; **p < 0.01; ***p < 0.001.
Figure 6
Figure 6
MYB is essential for the ETO2‐driven leukemic cell maintenance. (A) Cell proliferation of K562‐ETO2KO and HEL‐ETO2KO cell lines ±DOX expressing MYB or empty (Ctrl) backbone. GFP+ cells were sorted 24 h after transduction, and 50.000 cells per replicate were plated in culture medium supplemented ±DOX; n = 3 technical replicates. (B) Representation of KIT and CD36 expression measured by flow cytometry analysis in HEL‐ETO2KO cell lines ±DOX expressing MYB or empty (Ctrl) backbone, 48 h post‐DOX removal. Plots were gated on viable (SYTOX Blue‐negative) GFP+ (expressing MYB/Ctrl) cells. FACS plot is representative of n = 3 technical replicates for each group. (C) Histogram representation of MYB, PIM1, and GATA1 gene expression quantified by quantitative reverse‐transcription polymerase chain reaction (RT‐qPCR) in HEL‐ETO2KO cell lines ±DOX expressing MYB or empty (Ctrl) backbone, 48 h post‐DOX removal; n = 3 technical replicates per condition. (D) Histogram representation of CD36 expression quantified by flow cytometry in HEL expressing shRenilla (shREN) shMYB #143 and #149. GFP+ cells were sorted 24 h after transduction, and 100.000 cells per replicate were plated in culture medium. Plots were gated on viable (SYTOX Blue‐negative) GFP+ (expressing MYB/Ctrl) cells. FACS plot is representative of n = 3 technical replicates for each group. (E) GSEA analysis of the 33 activated or 47 repressed ETO2 target as well as JAATINEN_HSC_UP signatures in K562 expressing shRenilla (shREN) or shMYB; n = 4 technical replicates per group. (F) Histogram representation of MYB, ETO2, PIM1, and GATA1 gene expression in HEL expressing shRenilla (shREN) shMYB #143 or #149. GFP+ cells were sorted 48 h after transduction follow by RNA extraction; n = 3 technical replicates per condition. (G) Line plot and histogram representations of ETO2, H3K27ac, and H3K4me1 mean ChIP signal at ETO2 binding sites associated to activated ETO2 targets in HEL expressing shRenilla (shREN) or shMYB. Plot is representative of n = 2 technical replicates for each group. (H) Visualization of ChIP‐seq signal of ETO2, H3K27ac, and H3K4me1 in HEL expressing shRenilla (shREN) or shMYB, at MYB enhancer, PIM1 enhancer, and LMO2 enhancer. Data in (A, B, D) are representative of three independent experimental repeats; data in (C, F) are representative of two independent experimental repeats. Mean ± SEM is represented. Statistical significance is indicated as p‐values (Student t test except when otherwise specified). *p < 0.05; **p < 0.01; ***p < 0.001.
Figure 7
Figure 7
CBP/EP300 is essential for ETO2 transcriptional activation. (A) Heatmap and line plot representation of ETO2, H3K27ac, EP300, and MYB enrichment at ETO2 binding sites in HEL. Chromatin regions are ranked based on decreasing MYB signal intensity. (B) Western blot analysis of EP300 and MYB protein levels in total nuclear extract (Input) or following streptavidin pull‐down in HEL expressing ETO2‐BioID2 (+DOX) or not (−DOX). (C) Western blot analysis of ETO2, MYB, EP300, H3K27ac, and ACTIN (ACTB) protein levels in HEL or K562 cells treated with the catalytic CBP/EP300 inhibitor A485 (0.5 μM) or CBP‐PROTAC dCBP‐1 (0.5 μM) and analyzed at 6, 12, or 24 h posttreatment (dimethyl sulfoxide [DMSO] at 24 h). ETO2 and ACTB were probed on the same membrane, and MYB, EP300, and H3K27ac were probed separately. (D) Line plot representation of ETO2, H3K27ac, EP300, and MYB mean ChIP signals at ETO2 binding sites associated to activated ETO2 targets in HEL treated 3 h with DMSO or dCBP‐1 (0.5 μM). (E) Visualization of ChIP‐seq signal of ETO2, H3K27ac, EP300, and MYB in HEL treated 3 h with DMSO or dCBP‐1 (0.5 μM), at MYB enhancer and LMO2 enhancer. (F) Histogram representation of nascent ETO2, MYB, and PIM1 messenger RNA synthesized between 3 and 6 h following DMSO, A485, or dCBP‐1 (0.5 μM) treatment in the HEL cell line. Quantification measured by quantitative reverse‐transcription polymerase chain reaction (RT‐qPCR); n = 4 technical replicates per condition. (G) Histogram representing the quantification of MYB and PIM1 nascent RNA measured by RT‐qPCR. HEL cells were treated for 3 h with DMSO or A485 (0.1 or 0.5 μM) prior DOX induction of ETO2 or empty vector using different dose of doxycycline (300 ng/mL [DOX 300] or 750 ng/mL [DOX 750]). RNA synthesized between 3 and 6 h after DOX induction was collected by ClickIT Nascent RNA capture kit; n = 3 technical replicates per condition. Data in (B, C, F, G) are representative of two independent experimental repeats. Mean ± SEM is represented. Statistical significance is indicated as p‐values (Student t test except when otherwise specified). *p < 0.05; **p < 0.01; ***p < 0.001.

Similar articles

References

    1. Papaemmanuil E, Gerstung M, Bullinger L, et al. Genomic classification and prognosis in acute myeloid leukemia. N Engl J Med. 2016;374(23):2209‐2221. 10.1056/NEJMoa1516192 - DOI - PMC - PubMed
    1. Krivtsov AV, Evans K, Gadrey JY, et al. A Menin‐MLL inhibitor induces specific chromatin changes and eradicates disease in models of MLL‐rearranged leukemia. Cancer Cell. 2019;36(6):660‐673.e11. 10.1016/j.ccell.2019.11.001 - DOI - PMC - PubMed
    1. Zhu J, Koken MHM, Quignon F, et al. Arsenic‐induced PML targeting onto nuclear bodies: implications for the treatment of acute promyelocytic leukemia. Proc Natl Acad Sci. 1997;94(8):3978‐3983. 10.1073/pnas.94.8.3978 - DOI - PMC - PubMed
    1. Golub D, Iyengar N, Dogra S, et al. Mutant isocitrate dehydrogenase inhibitors as targeted cancer therapeutics. Front Oncol. 2019;9:417. 10.3389/fonc.2019.00417 - DOI - PMC - PubMed
    1. Wang Z, Wang P, Li Y, et al. Interplay between cofactors and transcription factors in hematopoiesis and hematological malignancies. Signal Transduct Target Ther. 2021;6(1):1‐16. 10.1038/s41392-020-00422-1 - DOI - PMC - PubMed