. 2024 Jun 6:18:1364067.
doi: 10.3389/fnins.2024.1364067. eCollection 2024.

Age-related changes of dopamine D1 and D2 receptors expression in parvalbumin-positive cells of the orbitofrontal and prelimbic cortices of mice

Affiliations

Age-related changes of dopamine D1 and D2 receptors expression in parvalbumin-positive cells of the orbitofrontal and prelimbic cortices of mice

Jihui Dong et al. Front Neurosci. .

Abstract

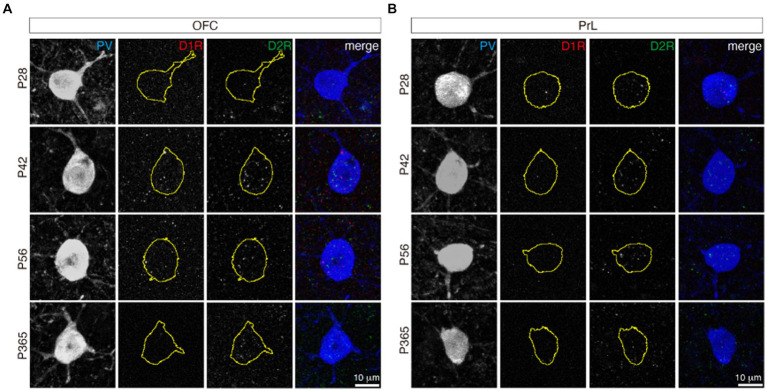
Dopamine (DA) plays a pivotal role in reward processing, cognitive functions, and emotional regulation. The prefrontal cortex (PFC) is a critical brain region for these processes. Parvalbumin-positive (PV+) neurons are one of the major classes of inhibitory GABAergic neurons in the cortex, they modulate the activity of neighboring neurons, influencing various brain functions. While DA receptor expression exhibits age-related changes, the age-related changes of these receptors in PV+ neurons, especially in the PFC, remain unclear. To address this, we investigated the expression of DA D1 (D1R) and D2 (D2R) receptors in PV+ neurons within the orbitofrontal (OFC) and prelimbic (PrL) cortices at different postnatal ages (P28, P42, P56, and P365). We found that the expression of D1R and D2R in PV+ neurons showed both age- and region-related changes. PV+ neurons in the OFC expressed a higher abundance of D1 than those in the PrL, and those neurons in the OFC also showed higher co-expression of D1R and D2R than those in the PrL. In the OFC and PrL, D1R in PV+ neurons increased from P28 and reached a plateau at P42, then receded to express at P365. Meanwhile, D2R did not show significant age-related changes between the two regions except at P56. These results showed dopamine receptors in the prefrontal cortex exhibit age- and region-specific changes, which may contribute to the difference of these brain regions in reward-related brain functions.

Keywords: D1; D2; age; development; dopamine receptor; orbitofrontal cortex; prefrontal cortex.


Conflict of interest statement

The authors declare that the research was conducted in the absence of any commercial or financial relationships that could be construed as a potential conflict of interest.

Figures

Figure 1
Figure 1
The distribution of PV+ neurons in the OFC and PrL at different ages of mice. (A) Brain sections containing the OFC and PrL with PV+ neurons immunolabeled with anti-parvalbumin at different ages. Inset at left, atlas indicating locations of the brain sections. Scale bar, 1 mm. (B) Blow-up of the OFC and PrL regions at different ages. Scale bar, 0.1 mm. (C) Comparisons of the cell density and soma area of PV+ neurons in the OFC and PrL regions (Left, PV+ cell density: Two-way ANOVA, F1, 332 (region) = 40.4, p = 6.84 × 10−10, F1, 332 (age) = 4.5, p = 0.004, F3, 332 (region: age) = 7.2, p = 0.0001; post hoc Tukey’s test: P28 of OFC vs. P28 of PrL, p = 3.95 × 10−9; P42 of OFC vs. P42 of PrL, p = 0.55; P56 of OFC vs. P56 of PrL, p = 0.06; P365 of OFC vs. P365 of PrL, p = 1.75 × 10−9. Right, PV+ cell soma area: Two-way ANOVA, F1, 2700 (region) = 12.0, p = 5.52 × 10−4, F1, 2700 (group) = 11.8, p = 1.14 × 10−7, F3, 2700 (region: group) = 1.3, p = 0.26; post hoc Tukey’s test: P28 of OFC vs. P28 of PrL, p = 7.36 × 10−4; P42 of OFC vs. P42 of PrL, p = 0.65; P56 of OFC vs. P56 of PrL, p = 0.15; P365 of OFC vs. P365 of PrL, p = 0.18. P28 of OFC: cell number, n = 528; section, n = 44; P28 of PrL: cell number, n = 279; section, n = 45; P42 of OFC: cell number, n = 220; section, n = 27; P42 of PrL: cell number, n = 281; section, n = 37; P56 of OFC: cell number, n = 343; section, n = 40; P56 of PrL: cell number, n = 426; section, n = 60; P365 of OFC: cell number, n = 449; section, n = 48; P365 of PrL: cell number, n = 182; section, n = 39; N = 3 mice/group). Circles and bars in violin plots denote the mean ± sem.
Figure 2
Figure 2
The expression of D1R in PV+ neurons of the OFC. (A) The characteristic expression of D1R in PV+ neurons in the OFC at different ages. Three panels on the right show the blow-up of the dashed square in the left panel. Scale bars, 50 and 10 μm. (B) The density and puncta average size of D1R expressed by PV+ neurons in the OFC (Left, OFC D1R density: Welch one-way ANOVA, F2, 248.3 = 24.8, p = 1.56 × 10−10; post hoc Tukey’s test: P28 vs. P42, p = 2.27 × 10−7; P28 vs. P56, p = 7.99 × 10−8; P42 vs. P56, p = 0.71. Right, OFC D1R puncta average size: Welch one-way ANOVA, F2, 255.1 = 6.0, p = 0.003; post hoc Tukey’s test: P28 vs. P42, p = 0.02; P28 vs. P56, p = 0.009; P42 vs. P56, p = 0.99. P28, n = 160; P42, n = 113; P56, n = 142; P365, n = 4; N = 3 mice/group).
Figure 3
Figure 3
The expression of D2R in PV+ neurons of the OFC. (A) The expression of D2R in PV+ neurons. Three panels on the right show the blow-up of the dashed square in the left panel. Scale bars, 50 and 10 μm. (B) The density and puncta average size of D2R expressed by PV+ neurons in the OFC (Left, OFC D2R density: Welch ANOVA, F3, 292 = 51.6, p = 8.55 × 10−27; post hoc Tukey’s test: P28 vs. P42, p = 2.35 × 10−13; P28 vs. P56, p = 6.52 × 10−13; P28 vs. P365, p = 0.39; P42 vs. P56, p = 0.96; P42 vs. P365, p = 8.09 × 10−14; P56 vs. P365, p = 1.54 × 10−13. Right, OFC D2R puncta average size: Welch ANOVA, F3, 285 = 3.5, p = 0.02; post hoc Tukey’s test: P28 vs. P42, p = 0.83; P28 vs. P56, p = 0.88; P28vs P365, p = 0.15; P42 vs. P56, p = 1.00; P42 vs. P365, p = 0.02; P56 vs. P365, p = 0.02. P28, n = 162; P42, n = 124; P56, n = 171; P365, n = 100; N = 3 mice/group).
Figure 4
Figure 4
The expression of D1R in PV+ neurons of the PrL. (A) The expression of D1R in PV+ neurons. Three panels on the right show the blow-up of the dashed square in the left panel. Scale bars, 50 and 10 μm. (B) The density and puncta average size of D1R expressed by PV+ neurons in the PrL (Left, PrL D1R density: Welch one-way ANOVA, F2, 41.7 = 0.1, p = 0.94. Right, PrL D1R puncta average size: Welch one-way ANOVA, F2, 30.7 = 0.3, p = 0.73. P28, n = 15; P42, n = 40; P56, n = 21; P365, n = 3; N = 3 mice/group).
Figure 5
Figure 5
The expression of D2R in PV+ neurons of the PrL. (A) The expression of D2R in PV+ neurons. Three panels on the right show the blow-up of the dashed square in the left panel. Scale bar, 50 μm, 10 μm. (B) The density and puncta average size of D2R expressed by PV+ neurons in the PrL (Left, PrL D2R density: Welch one-way ANOVA, F3, 177 = 10.1, p = 3.43 × 10−6; post hoc Tukey’s test: P28 vs. P42, p = 8.31 × 10−6; P28 vs. P56, p = 0.001; P28 vs. P365, p = 0.17; P42 vs. P56, p = 0.03; P42 vs. P365, p = 0.03; P56 vs. P365, p = 0.94. Right, PrL D2R puncta average size: Welch one-way ANOVA, F3, 180 = 4.12, p = 0.007; post hoc Tukey’s test: P28 vs. P42, p = 0.58; P28 vs. P56, p = 0.75; P28 vs. P365, p = 0.48; P42 vs. P56, p = 0.99; P42 vs. P365, p = 0.008; P56 vs. P365, p = 0.03. P28, n = 67; P42, n = 119; P56, n = 148; P365, n = 60; N = 3 mice/group).
Figure 6
Figure 6
D1R and D2R did not co-localize in both the OFC and PrL. The stainings of D1R (red) and D2R (green) in PV+ neurons (blue) of the OFC (A) and PrL (B). The yellow circles of the D1R and D2R panels indicate the related PV+ cell soma shape. Scale bars, 10 μm.
Figure 7
Figure 7
Correlation analysis of the expressions of D1R and D2R in PV+ neurons. (A) The proportion of D1R and D2R expressed by PV+ neurons in the OFC and PrL (N = 3/group). (B–D) Correlation analysis of density of D1R and D2R expressions in PV+ neurons in the OFC and PrL (B, OFC, n = 741; PrL, n = 663. C, P28, n = 215; P42, n = 138; P56, n = 182; P365, n = 206. D, P28, n = 167; P42, n = 186; P56, n = 208; P365, n = 102; N = 3 mice/group).
Figure 8
Figure 8
Comparisons of D1R and D2R expressions of PV+ neurons of the PrL and OFC. (A) Comparative analysis of the density of PV+ neurons expressing only D1R in the OFC and PrL (Left, D1R density: Two-way ANOVA, F1, 50 (region) = 0.9, p = 0.34, F3, 50 (Age) = 3.3, p = 0.03, F3, 50 (region: Age) = 1.0, p = 0.39; post hoc Tukey’s test: OFC vs. PrL, p = 0.04; P28 vs. P56, p = 0.05. Right, D1R puncta average size: Two-way ANOVA, F1, 50 (region) = 0.5, p = 0.50, F3, 50 (Age) = 3.6, p = 0.02, F3, 50 (region: Age) = 1.2, p = 0.31. OFC: P28, n = 30; P42, n = 9; P56, n = 9; P365, n = 1; PrL: P28, n = 3; P42, n = 3; P56, n = 2; P365, n = 1; N = 3 mice/group). (B) Comparative analysis of the density of PV+ neurons expressing only D2R in the OFC and PrL (Left, D2R density: Two-way ANOVA, F1, 503 (region) = 0.2, p = 0.69, F3, 503 (Age) = 16.1, p = 5.13 × 10−10, F3, 503 (region: Age) = 6.5, p = 2.46 × 10−4; post hoc Tukey’s test: OFC vs. PrL, p = 0.03; P28 vs. P42, p = 7.47 × 10−7; P28 vs. P56, p = 3.91 × 10−6; P42 vs. P365, p = 4.24 × 10−4; P56 vs. P365, p = 2.58 × 10−3; P28 of OFC vs. P42 of OFC, p = 5.36 × 10−3; P28 of OFC vs. P56 of OFC, p = 6.09 × 10−7; P28 of PrL vs. P42 of OFC, p = 3.49 × 10−4; P28 of PrL vs. P42 of PrL, p = 0.002; P28 of PrL vs. P56 of OFC, p = 6.25 × 10−10; P42 of OFC vs. P365 of OFC, p = 0.02; P42 of PrL vs. P56 of OFC, p = 0.003; P56 of OFC vs. P56 of PrL, p = 1.86 × 10−6; P56 of OFC vs. P365 of OFC, p = 3.46 × 10−7; P56 of OFC vs. P365 of PrL, p = 9.18 × 10−6. Right, D2R puncta average size: Two-way ANOVA, F1, 503 (region) = 0.3, p = 0.61, F3, 503 (Age) = 2.7, p = 0.05, F3, 503 (region: Age) = 0.9, p = 0.43; post hoc Tukey’s test: P56 vs. P365, p = 0.04. OFC: P28, n = 32; P42, n = 20; P56, n = 38; P365, n = 97; PrL: P28, n = 55; P42, n = 82; P56, n = 129; P365, n = 58; N = 3 mice/group). (C) Comparative analysis of the density of D1R and D2R co-expressed by PV+ neurons in OFC and PrL (Top-left, D1R density: Two-way ANOVA, F1, 432 (region) = 2.9, p = 0.09, F3, 432 (Age) = 14.8, p = 3.68 × 10−9, F3, 432 (region: Age) = 2.04, p = 0.11; post hoc Tukey’s test: OFC vs. PrL, p < 0.00001; P28 vs. P42, p = 1.44 × 10−5; P28 vs. P56, p = 3.33 × 10−7; P28 of OFC vs. P42 of OFC, p = 1.9 × 10−5; P28 of OFC vs. P56 of OFC, p = 3.48 × 10−7; P28 of PrL vs. P42 of PrL, p = 0.003; P28 of PrL vs. P56 of OFC, p = 0.001; P42 of OFC vs. P42 of PrL, p = 7.25 × 10−8; P42 of OFC vs. P56 of PrL, p = 1.08 × 10−4; P42 of PrL vs. P56 of OFC, p = 4.53 × 10−9; P56 of OFC vs. P56 of PrL, p = 2.67 × 10−5. Top-right, D1R puncta average size: Two-way ANOVA, F1, 432 (region) = 0.90, p = 0.34, F3, 432 (Age) = 1.8, p = 0.15, F3, 432 (region: Age) = 1.2, p = 0.30. Bottom-left, D2R density: Two-way ANOVA, F1, 432 (region) = 0.005, p = 0.95, F3, 432 (Age) = 21.4, p = 6.05 × 10−13, F3, 432 (region: Age) = 1.8, p = 0.15; post hoc Tukey’s test: OFC vs. PrL, p = 0.04; P28 vs. P42, p < 0.00001; P28 vs. P56, p = 1.27 × 10−8; P28 of OFC vs. P42 of OFC, p = 2.46 × 10−10; P28 of OFC vs. P56 of OFC, p = 4.71 × 10−9; P28 of PrL vs. P42 of OFC, p = 0.04; P42 of OFC vs. P56 of PrL, p = 0.003; P56 of OFC vs. P56 of PrL, p = 0.01. Bottom-right, D2R puncta average size: Two-way ANOVA, F1, 432 (region) = 0.5, p = 0.50, F3, 432 (Age) = 0.40, p = 0.76, F3, 432 (region: Age) = 0.4, p = 0.74. OFC: P28, n = 130; P42, n = 104; P56, n = 133; P365, n = 3; PrL: P28, n = 12; P42, n = 37; P56, n = 19; P365, n = 2; N = 3 mice/group).

Similar articles

References

    1. Backman L., Karlsson S., Fischer H., Karlsson P., Brehmer Y., Rieckmann A., et al. . (2011). Dopamine D1 receptors and age differences in brain activation during working memory. Neurobiol. Aging 32, 1849–1856. doi: 10.1016/j.neurobiolaging.2009.10.018, PMID: - DOI - PubMed
    1. Baker P. M., Ragozzino M. E. (2014). Contralateral disconnection of the rat prelimbic cortex and dorsomedial striatum impairs cue-guided behavioral switching. Learn. Mem. 21, 368–379. doi: 10.1101/lm.034819.114, PMID: - DOI - PMC - PubMed
    1. Banks P. J., Burroughs A. C., Barker G. R., Brown J. T., Warburton E. C., Bashir Z. I. (2015). Disruption of hippocampal-prefrontal cortex activity by dopamine D2R-dependent LTD of NMDAR transmission. Proc. Natl. Acad. Sci. U.S.A. 112, 11096–11101. doi: 10.1073/pnas.1512064112, PMID: - DOI - PMC - PubMed
    1. Belmaker R. H., Agam G. (2008). Major depressive disorder. N. Engl. J. Med. 358, 55–68. doi: 10.1056/NEJMra073096 - DOI - PubMed
    1. Bolla K. I., Eldreth D. A., London E. D., Kiehl K. A., Mouratidis M., Contoreggi C., et al. . (2003). Orbitofrontal cortex dysfunction in abstinent cocaine abusers performing a decision-making task. NeuroImage 19, 1085–1094. doi: 10.1016/s1053-8119(03)00113-7, PMID: - DOI - PMC - PubMed