

Optimizing spatial specificity and signal quality in fNIRS: an overview of potential challenges and possible options for improving the reliability of real-time applications
- PMID: 38903906
- PMCID: PMC11188482
- DOI: 10.3389/fnrgo.2024.1286586
Optimizing spatial specificity and signal quality in fNIRS: an overview of potential challenges and possible options for improving the reliability of real-time applications
Abstract
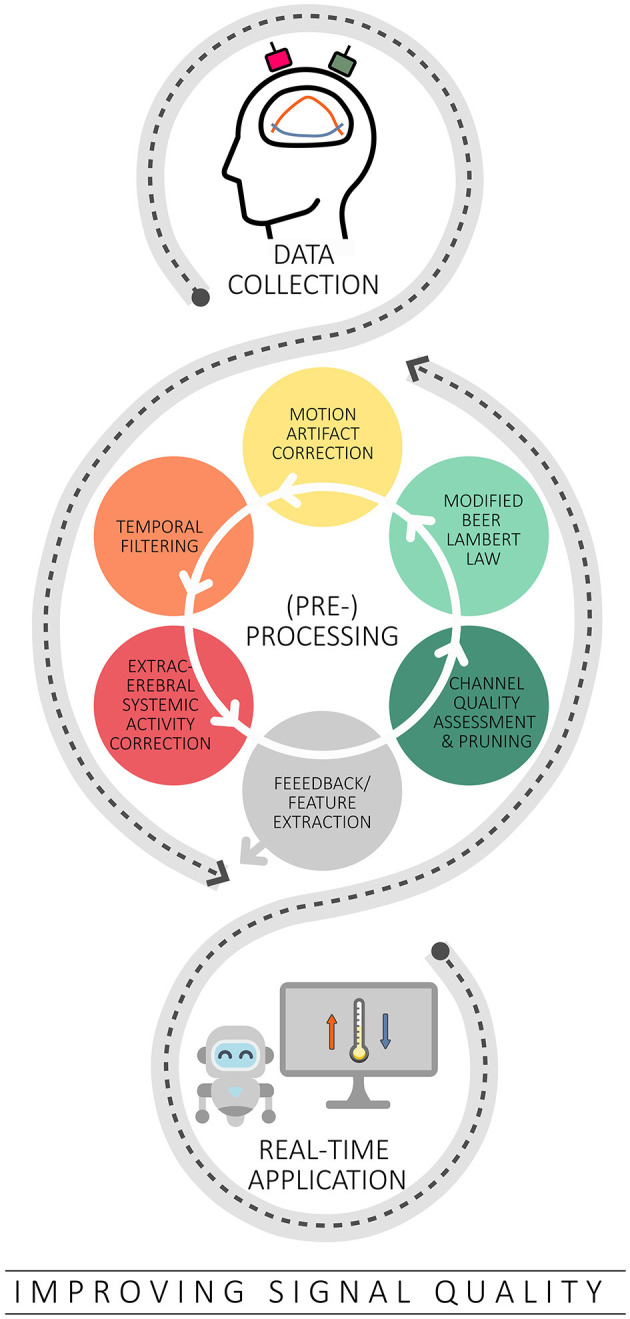
The optical brain imaging method functional near-infrared spectroscopy (fNIRS) is a promising tool for real-time applications such as neurofeedback and brain-computer interfaces. Its combination of spatial specificity and mobility makes it particularly attractive for clinical use, both at the bedside and in patients' homes. Despite these advantages, optimizing fNIRS for real-time use requires careful attention to two key aspects: ensuring good spatial specificity and maintaining high signal quality. While fNIRS detects superficial cortical brain regions, consistently and reliably targeting specific regions of interest can be challenging, particularly in studies that require repeated measurements. Variations in cap placement coupled with limited anatomical information may further reduce this accuracy. Furthermore, it is important to maintain good signal quality in real-time contexts to ensure that they reflect the true underlying brain activity. However, fNIRS signals are susceptible to contamination by cerebral and extracerebral systemic noise as well as motion artifacts. Insufficient real-time preprocessing can therefore cause the system to run on noise instead of brain activity. The aim of this review article is to help advance the progress of fNIRS-based real-time applications. It highlights the potential challenges in improving spatial specificity and signal quality, discusses possible options to overcome these challenges, and addresses further considerations relevant to real-time applications. By addressing these topics, the article aims to help improve the planning and execution of future real-time studies, thereby increasing their reliability and repeatability.
Keywords: BCI; extracerebral systemic activity; fNIRS; motion artifacts; neurofeedback; noise reduction; real-time preprocessing; spatial specificity.
Copyright © 2024 Klein.
Conflict of interest statement
The author declares that the research was conducted in the absence of any commercial or financial relationships that could be construed as a potential conflict of interest.
Figures


Similar articles
-
From lab to life: challenges and perspectives of fNIRS for haemodynamic-based neurofeedback in real-world environments.Philos Trans R Soc Lond B Biol Sci. 2024 Dec 2;379(1915):20230087. doi: 10.1098/rstb.2023.0087. Epub 2024 Oct 21. Philos Trans R Soc Lond B Biol Sci. 2024. PMID: 39428887 Free PMC article. Review.
-
The Potential of Functional Near-Infrared Spectroscopy-Based Neurofeedback-A Systematic Review and Recommendations for Best Practice.Front Neurosci. 2020 Jul 21;14:594. doi: 10.3389/fnins.2020.00594. eCollection 2020. Front Neurosci. 2020. PMID: 32848528 Free PMC article.
-
Analysis of task-evoked systemic interference in fNIRS measurements: insights from fMRI.Neuroimage. 2014 Feb 15;87:490-504. doi: 10.1016/j.neuroimage.2013.10.024. Epub 2013 Oct 19. Neuroimage. 2014. PMID: 24148922
-
Development of a combined, sequential real-time fMRI and fNIRS neurofeedback system to enhance motor learning after stroke.J Neurosci Methods. 2020 Jul 15;341:108719. doi: 10.1016/j.jneumeth.2020.108719. Epub 2020 May 18. J Neurosci Methods. 2020. PMID: 32439425
-
Multivariate Kalman filter regression of confounding physiological signals for real-time classification of fNIRS data.Neurophotonics. 2022 Apr;9(2):025003. doi: 10.1117/1.NPh.9.2.025003. Epub 2022 Jun 8. Neurophotonics. 2022. PMID: 35692628 Free PMC article.
Cited by
-
NINFA: Non-commercial interface for neuro-feedback acquisitions.Neurophotonics. 2025 Apr;12(2):026601. doi: 10.1117/1.NPh.12.2.026601. Epub 2025 May 14. Neurophotonics. 2025. PMID: 40370478 Free PMC article.
-
Investigating short windows of interbrain synchrony: A step toward fNIRS-based hyperfeedback.Imaging Neurosci (Camb). 2025 Jun 17;3:IMAG.a.43. doi: 10.1162/IMAG.a.43. eCollection 2025. Imaging Neurosci (Camb). 2025. PMID: 40800758 Free PMC article.
-
From lab to life: challenges and perspectives of fNIRS for haemodynamic-based neurofeedback in real-world environments.Philos Trans R Soc Lond B Biol Sci. 2024 Dec 2;379(1915):20230087. doi: 10.1098/rstb.2023.0087. Epub 2024 Oct 21. Philos Trans R Soc Lond B Biol Sci. 2024. PMID: 39428887 Free PMC article. Review.
-
Creating anatomically-derived, standardized, customizable, and three-dimensional printable head caps for functional neuroimaging.bioRxiv [Preprint]. 2024 Dec 17:2024.08.30.610386. doi: 10.1101/2024.08.30.610386. bioRxiv. 2024. Update in: Neurophotonics. 2025 Jan;12(1):015016. doi: 10.1117/1.NPh.12.1.015016. PMID: 39257741 Free PMC article. Updated. Preprint.
-
Method for Using Functional Near-Infrared Spectroscopy (fNIRS) to Explore Music-Induced Brain Activation in Orchestral Musicians in Concert.Sensors (Basel). 2025 Mar 14;25(6):1807. doi: 10.3390/s25061807. Sensors (Basel). 2025. PMID: 40292950 Free PMC article.
References
-
- Abdulkader S. N., Atia A., Mostafa M.-S. M. (2015). Brain computer interfacing: Applications and challenges. Egypt. Inform. J. 16, 213–230. 10.1016/j.eij.2015.06.002 - DOI
Publication types
LinkOut - more resources
Full Text Sources
Miscellaneous