. 2024 May 28;27(6):110146.
doi: 10.1016/j.isci.2024.110146. eCollection 2024 Jun 21.

Novel requirements for HAP2/GCS1-mediated gamete fusion in Tetrahymena

Affiliations

Novel requirements for HAP2/GCS1-mediated gamete fusion in Tetrahymena

Jennifer F Pinello et al. iScience. .

Abstract

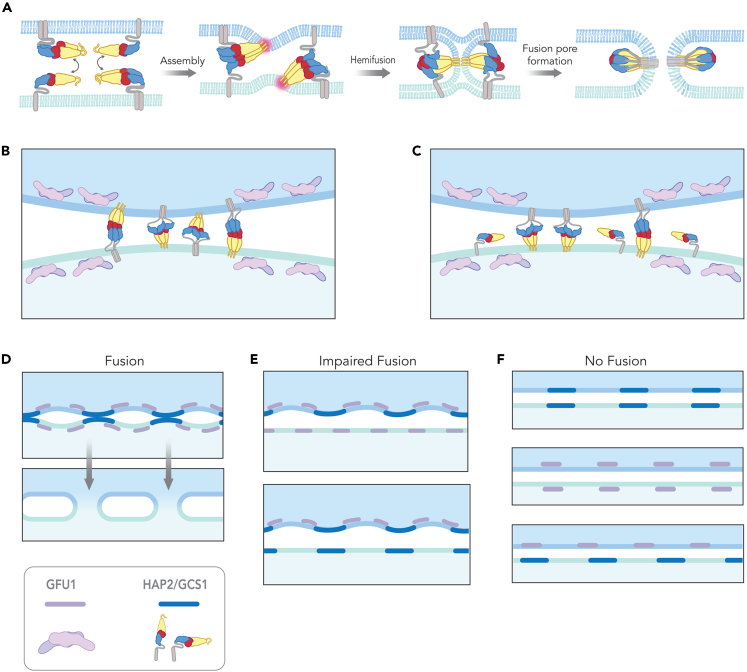
The ancestral gamete fusion protein, HAP2/GCS1, plays an essential role in fertilization in a broad range of taxa. To identify factors that may regulate HAP2/GCS1 activity, we screened mutants of the ciliate Tetrahymena thermophila for behaviors that mimic Δhap2/gcs1 knockout phenotypes in this species. Using this approach, we identified two new genes, GFU1 and GFU2, whose products are necessary for membrane pore formation following mating type recognition and adherence. GFU2 is predicted to be a single-pass transmembrane protein, while GFU1, though lacking obvious transmembrane domains, has the potential to interact directly with membrane phospholipids in the cytoplasm. Like Tetrahymena HAP2/GCS1, expression of GFU1 is required in both cells of a mating pair for efficient fusion to occur. To explain these bilateral requirements, we propose a model that invokes cooperativity between the fusion machinery on apposed membranes of mating cells and accounts for successful fertilization in Tetrahymena's multiple mating type system.

Keywords: Cell biology; Molecular biology.


Conflict of interest statement

The authors declare no competing interests.

Figures

None
Graphical abstract
Figure 1
Figure 1
Characteristics of cell-cell pairing by Δgfu1 and Δgfu2 mutant cell lines (A–D) Wild type and deletion strains lacking either GFU1 or GFU2 were starved to induce mating competency and then mixed with equal numbers of cells of complementary mating type as indicated in each panel. A–D are phase contrast images showing mixtures of Δgfu1 (A, B) or Δgfu2 (C, D) deletion strains fixed immediately after mixing (A, C) or 4 h post-mixing (B, D) (bar = 20 μm). Note the heart-shaped mating pairs visible at the 4 h time point in (B) and (D). (E and F) show the kinetics of pair formation in undisturbed cultures. For (E–H), mating competent cells were mixed at ratios of 1:1, then fixed at the indicated time points and counted to determine the percentage of cells in pairs. (G and H) show the relative stability of pairs from mating cultures of WT, Δgfu1, and Δgfu2 strains following vortexing. Samples were collected from undisturbed cultures at 4 h post-mixing, vortexed at a fixed speed for the times shown on the x axis, then fixed and counted to determine the percentage of cells in pairs. (E–H) show representative data from individual experiments in each case.
Figure 2
Figure 2
Quantitation of cell-cell fusion by flow cytometry (A) and (B) are fluorescence confocal images of a mating culture of wild type T. thermophila containing equal numbers of cells of complementary mating type that had been labeled with CFSE (green) or CTFR (red) prior to mixing. (A) shows cells immediately after mixing (0 h), while (B) shows cells 24 h after mixing when sexual development was complete and pairs of cells had come apart. Note that cells in (A) are either red or green, while in (B), four of five cells show both colors and appear yellow (scale bar = 30 μm). (C) and (D) are representative smoothed display pseudocolor flow cytometry plots of the same cultures imaged in (A) and (B) either before (C) or after (D) cells had undergone fusion and exchanged cytosolic proteins. Initially (0 h), only two populations were present (labeled CTRFhi and CFSEhi). After fusion (24 h), the original single-labeled populations were diminished, and >90% of cells were present in two new populations labeled with both dyes (labeled “Mid” gate in (D)). An additional small population was also present at the 24 h time point labeled “Pairs”. As shown previously, this gate represents cell pairs that either failed to come apart or continued to attempt to pair after normal mating was complete. (E–H) are representative flow cytometry plots of mating cultures of Δgfu1 or Δgfu2 deletion strains crossed to complementary mating types carrying the Δgfu1 or Δgfu2 deletions (panels E,F) or to WT cells (G, H) 18–24 h post-mixing. (I) is a bar graph showing the compiled data from multiple crosses between WT, Δgfu1, Δgfu2, and Δhap2 deletion strains as indicated on the x axis (n = 12–78 biological replicates/cross). Bars show the mean percentage of cells that had undergone fusion (calculated from the “Mid” gate) and the bracketed lines, the standard deviations (+/−). Asterisks represent the level of statistical significance between indicated crosses based on one-sided Kruskal-Wallis tests and Dunn’s post-tests (∗∗∗∗ = p < 0.0001; ∗∗ = p < 0.01; ∗ = p < 0.05; ns = not significant).
Figure 3
Figure 3
Localization and predicted structural features of GFU1 (A–C) show fluorescence light microscopic images of mating pairs formed by WT cells and transgenic cell lines expressing C-terminal HA- (A) or mCherry-tagged (B,C) versions of GFU1 from chimeric genes introduced at the endogenous GFU1 locus. In (A), the HA-tagged gene product was detected with a fluorescein-labeled (green) secondary antibody. In (B) and (C), the mCherry-tagged construct (red) was visualized directly using confocal imaging. In (C), the labeled cell is co-expressing an inducible, GFP-tagged version of HAP2/GCS1 (green) from the β-tubulin 1 locus. White boxes indicate the conjugation junction (CJ) where mating types adhere and the dashed white lines demarcate the borders of mating cells (scale bars, lower right corner = 10 μm). (D) shows orthogonal views of the AlphaFold2 predicted structure of GFU1. Color coding is based on prediction reliability scores with blue (0.0) representing the lowest and red (1.0) the highest confidence scores. Note the shallow curvature along the long axes of the extended α-helices in the lower image, a common feature of F-BAR domains. (E) shows the results of a structure homology search comparing GFU1 to known structures in the PDB database using RaptorX. Three of the five top hits (highlighted in green) are to known F-BAR domain-containing proteins,, with p-values and uGDT scores reflecting high quality predictions in each case. (F) and (G) are ESR plots showing changes in the order parameter (ΔS0) of spin-labeled lipid probes labeled on their head groups (DPPTC) or acyl chains (5PC), respectively, within multilamellar liposome vesicles as a function of increasing protein-to-lipid ratio. Plots show the relative ordering effects of recombinant GFU1 (red), compared with previously described fusion peptides from influenza virus HA (black), Tetrahymena HAP2/GCS1 (blue), and a corresponding scrambled peptide for the ciliate protein as a negative control (green). Data points and error bars in (F) and (G) represent the means +/− standard deviations in ΔS0 from 3 independent experiments.
Figure 4
Figure 4
Heterologous cell-cell fusion assays (A) and (B) are box and whisker plots showing levels of cell-cell fusion in BSR-T7 baby hamster kidney (BHK) cell cultures 30 h post-transfection with plasmid expression vectors encoding cDNAs indicated on the x axes. (A) shows relative levels of cell-cell fusion in cultures transfected with empty vector alone (pcDNA), or vectors encoding the Nipah virus (NiV) triggering protein G and fusion protein F (NiV G/F), or the HAP2/GCS1 orthologs of Arabidopsis thaliana (Ara.HAP2) or Tetrahymena thermophila (T.HAP2). (B) shows levels of cell-cell fusion in cultures transfected with pcDNA alone, or vectors encoding the HAP2/GCS1 orthologs with or without co-transfection with plasmids encoding Tetrahymena GFU1, GFU2, or both (GFU1/2). Levels of cell-cell fusion were measured by counting the total number of nuclei in syncytia per field (y axis) in 4–6 random fields across 3 separate experiments. In each case, the midline represents the median, and the whiskers the minimum and maximum values for the total number of nuclei in syncytia per field, with a syncytium defined as any cell with ≥4 nuclei. In panels (A,B), statistical differences in pairwise comparisons between categories are indicated by horizontal lines above the plots as determined by Student’s t test with asterisks denoting p-values (∗∗∗∗ = p < 0.0001; ∗∗ = p ≤ 0.01; ∗ = p ≤ 0.05; ns = not significant). In panel (B), asterisks above the categories represent statistical differences compared with the empty vector control calculated using a one-way, non-parametric Kruskal-Wallis ANOVA (∗∗∗∗ = p < 0.0001; ∗∗∗ = p ≤ 0.001).
Figure 5
Figure 5
Cooperativity in membrane pore formation (A) and (B) are representative flow cytometry plots of CFSE and CTFR-labeled cells expressing the R164A mutant allele of HAP2/GCS1 mated to either WT cells (panel A) or a complementary mating type carrying the identical R164A mutant allele (panel B) fixed at 24 h post-mixing. (C) is a bar graph showing the compiled data of percent fusion in crosses between WT, R164A mutant, and Δhap2/gcs1 deletion strains as indicated on the x axis (n = 6–78 biological replicates/cross). The mating types (VI and VII) of strains carrying the R164A mutant allele are shown in superscript. (D and E) are representative flow cytometry plots of crosses between CFSE and CTFR-labeled cells expressing C-terminal HA- or mCherry-tagged versions of GFU1, respectively, fixed at 24 h post-mixing. Fluorescence from the mCherry construct itself is negligible in fixed cells and does not contribute to the recorded signal. (F and G), WT cells were mixed with either GFU1:mCherry expressing cells (F) or with a Δgfu1 deletion strain lacking the gene (G), and fixed 24 h post-mixing. Note the substantially larger population of cells in the “Mid” gate in (F) compared to (G). Panel (H) is a bar graph showing the compiled data for percent fusion from all experiments with tagged GFU1 constructs (n = 3–18 biological replicates/cross). Bars in panels (C, H) represent the mean and bracketed lines the standard deviations (+/−). Asterisks represent the level of statistical significance between indicated crosses based on one-sided Kruskal-Wallis tests and Dunn’s post-tests (∗∗∗∗ = p < 0.0001; ∗ = p < 0.05; ns = no significance).
Figure 6
Figure 6
Ultrastructural analysis of membranes at the conjugation junction Representative transmission electron micrographs showing sections spanning the conjugation junction of mating pairs are shown. (A) = WT pair; panel (B) = Δhap2/gcs1 knockout pair; and panels (C) and (D) = Δgfu1 knockout pairs fixed at 4 h post-mixing. Cells are oriented top-to-bottom with the junctional membranes of each cell (demarcated by small black arrows) running horizontally at the middle of each panel. In panel (A), numerous pores (white arrows) were visible along the length of the conjugation junction in the WT pair. The inset at the upper right is a higher magnification image showing dome-shaped structures (white arrows) that appeared to push membranes outward toward the apposed membrane. In serial sections, these structures were shown to be fully open pores cut at an oblique angle (Figure S5). In (B), no pores were visible along the junctional membranes formed by Δhap2/gcs1 deletion strains. However, large vesicular bodies (bordered by the white square) were present in the luminal space separating cells. In (C) and (D), neither junctional pores nor large vesicular bodies were visible in pairs formed by Δgfu1 deletion strains. Note the slightly greater distance between cells in (D) compared to (C). Scale bars in the lower right corner of each panel = 0.5 μm.
Figure 7
Figure 7
Alterative models of cooperativity in the fusion process (A and B) Like previous models proposed for EFF-1 from C. elegans,, the model shown in panel (A) hypothesizes that HAP2/GCS1 protomers emanating from apposed membranes on either side of the conjugation junction interact to form trimers, except that in this case, insertion of fusion loops into lipid bilayers would be obligatory. As in conventional models for class II viral fusogens, trimers would then undergo conformational foldback to generate the forces necessary to bend membranes and promote fusion pore opening. Alternatively, the model in panel (B) forgoes trans-interactions between the HAP2/GCS1 protomers and proposes instead that the HAP2/GCS1 transmembrane helix and cytosolic domains together with other proteins such as GFU1, impose local membrane curvature creating an energetically favorable environment for membrane fusion where such regions interact. (C) depicts a scenario in which the R164A mutant protein in the lower bilayer would be unable to form trimers but would still deform the membrane and lower the energy barrier for membrane merger catalyzed by native HAP2/GCS1 trimers on the apposed membrane. (D) shows the expected outcome for crosses between WT cells or WT X R164A strains, namely full fusion where curved membranes interact. (E) shows the expected outcome when either HAP2/GCS1 or GFU1 are absent from one membrane, namely, inefficient fusion of only a small percentage of pairs. (F) shows the expected outcome when either HAP2/GCS1 or GFU1 are absent from both membranes (upper two schematics) or in crosses between cells lacking one or the other protein (lower schematic), namely, no fusion.

Update of

References

    1. Wong J.L., Johnson M.A. Is HAP2-GCS1 an ancestral gamete fusogen? Trends Cell Biol. 2010;20:134–141. doi: 10.1016/j.tcb.2009.12.007. - DOI - PubMed
    1. Speijer D., Lukeš J., Eliáš M. Sex is a ubiquitous, ancient, and inherent attribute of eukaryotic life. Proc. Natl. Acad. Sci. USA. 2015;112:8827–8834. doi: 10.1073/pnas.1501725112. - DOI - PMC - PubMed
    1. Pinello J.F., Lai A.L., Millet J.K., Cassidy-Hanley D., Freed J.H., Clark T.G. Structure-Function Studies Link Class II Viral Fusogens with the Ancestral Gamete Fusion Protein HAP2. Curr. Biol. 2017;27:651–660. doi: 10.1016/j.cub.2017.01.049. - DOI - PMC - PubMed
    1. Fédry J., Liu Y., Péhau-Arnaudet G., Pei J., Li W., Tortorici M.A., Traincard F., Meola A., Bricogne G., Grishin N.V., et al. The Ancient Gamete Fusogen HAP2 Is a Eukaryotic Class II Fusion Protein. Cell. 2017;168:904–915.e10. doi: 10.1016/j.cell.2017.01.024. - DOI - PMC - PubMed
    1. Valansi C., Moi D., Leikina E., Matveev E., Graña M., Chernomordik L.V., Romero H., Aguilar P.S., Podbilewicz B. Arabidopsis HAP2/GCS1 is a gamete fusion protein homologous to somatic and viral fusogens. J. Cell Biol. 2017;216:571–581. doi: 10.1083/jcb.201610093. - DOI - PMC - PubMed

LinkOut - more resources