. 2024 Jul 23;98(7):e0081324.
doi: 10.1128/jvi.00813-24. Epub 2024 Jun 21.

Enterovirus 3A protein disrupts endoplasmic reticulum homeostasis through interaction with GBF1

Affiliations

Enterovirus 3A protein disrupts endoplasmic reticulum homeostasis through interaction with GBF1

Junki Hirano et al. J Virol. .

Abstract

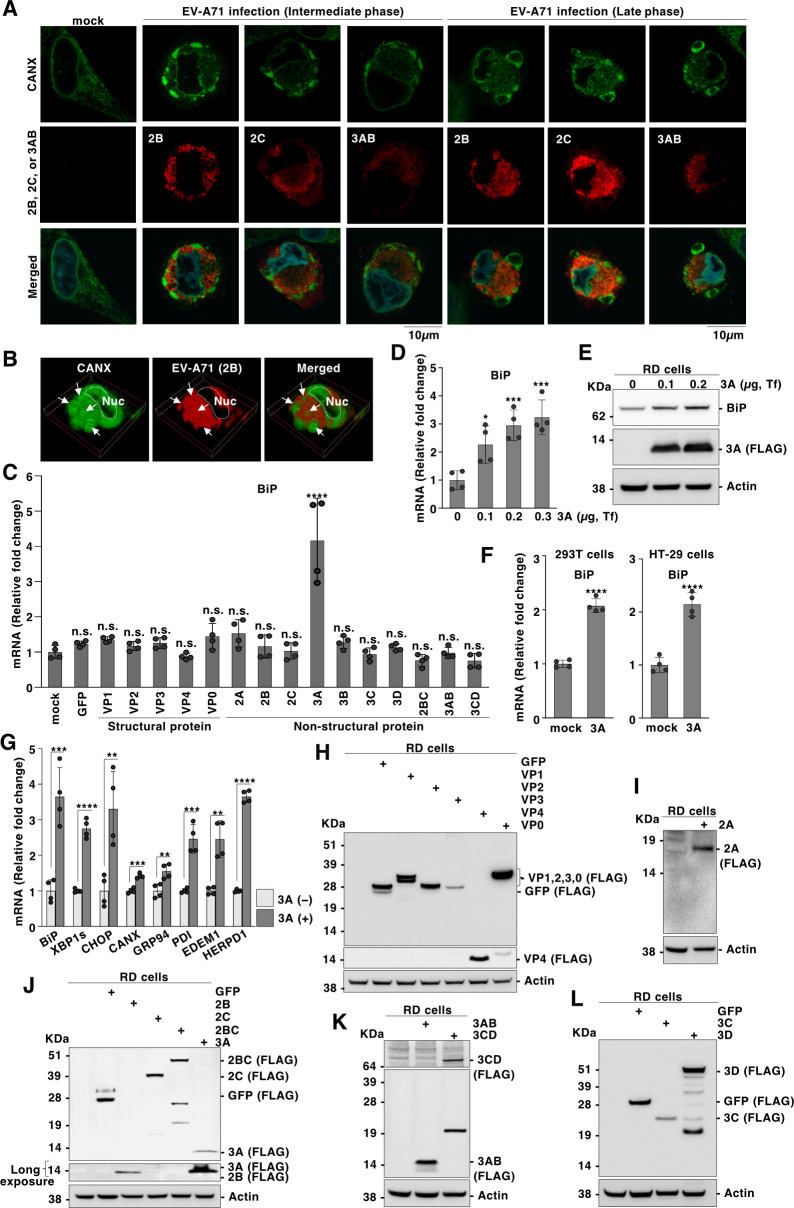
Enteroviruses are single-stranded, positive-sense RNA viruses causing endoplasmic reticulum (ER) stress to induce or modulate downstream signaling pathways known as the unfolded protein responses (UPR). However, viral and host factors involved in the UPR related to viral pathogenesis remain unclear. In the present study, we aimed to identify the major regulator of enterovirus-induced UPR and elucidate the underlying molecular mechanisms. We showed that host Golgi-specific brefeldin A-resistant guanine nucleotide exchange factor 1 (GBF1), which supports enteroviruses replication, was a major regulator of the UPR caused by infection with enteroviruses. In addition, we found that severe UPR was induced by the expression of 3A proteins encoded in human pathogenic enteroviruses, such as enterovirus A71, coxsackievirus B3, poliovirus, and enterovirus D68. The N-terminal-conserved residues of 3A protein interact with the GBF1 and induce UPR through inhibition of ADP-ribosylation factor 1 (ARF1) activation via GBF1 sequestration. Remodeling and expansion of ER and accumulation of ER-resident proteins were observed in cells infected with enteroviruses. Finally, 3A induced apoptosis in cells infected with enteroviruses via activation of the protein kinase RNA-like endoplasmic reticulum kinase (PERK)/C/EBP homologous protein (CHOP) pathway of UPR. Pharmaceutical inhibition of PERK suppressed the cell death caused by infection with enteroviruses, suggesting the UPR pathway is a therapeutic target for treating diseases caused by infection with enteroviruses.IMPORTANCEInfection caused by several plus-stranded RNA viruses leads to dysregulated ER homeostasis in the host cells. The mechanisms underlying the disruption and impairment of ER homeostasis and its significance in pathogenesis upon enteroviral infection remain unclear. Our findings suggested that the 3A protein encoded in human pathogenic enteroviruses disrupts ER homeostasis by interacting with GBF1, a major regulator of UPR. Enterovirus-mediated infections drive ER into pathogenic conditions, where ER-resident proteins are accumulated. Furthermore, in such scenarios, the PERK/CHOP signaling pathway induced by an unresolved imbalance of ER homeostasis essentially drives apoptosis. Therefore, elucidating the mechanisms underlying the virus-induced disruption of ER homeostasis might be a potential target to mitigate the pathogenesis of enteroviruses.

Keywords: ER stress; GBF1; PERK; apoptosis; enterovirus; unfolded protein response.


Conflict of interest statement

The authors declare no conflict of interest.

Figures

Fig 1
Fig 1
EV-A71 infection alters ER homeostasis and morphology. (A) Expression of BiP, XBP1s, CHOP, and viral RNA in RD cells infected with EV-A71 at an MOI of 0.001, 0.01, and 0.1 was quantified using qPCR at 36 h post-infection. (B) Expression levels of BiP, XBP1s, CHOP, and EV-A71 3CD protein in RD cells infected with EV-A71 at an MOI of 0.01 and 0.1 were detected using immunoblotting at 36 h post-infection. (C) RD cells infected with EV-A71 at an MOI of 0.3 were incubated for 30 h and stained with anti-CANX antibody, anti-EV-A71 3CD antibody, and DAPI; fluorescent signals were detected using microscopy (FV-3000, OLYMPUS). The scale bar represents 10 µm. (D) RD cells infected with EV-A71 at an MOI of 0.3 were incubated for 8 h (early phase), 16 h (intermediate phase), or 30 h (late phase) and stained with anti-CANX antibody, anti-EV-A71 3CD antibody, and DAPI. The fluorescent signals were detected using microscopy. The arrowhead and straight arrow represent uninfected and EV-A71-infected cells, respectively. The scale bars represent 10 µm. (E) RD, HEK293T, and HeLa cells infected with EV-A71 at an MOI of 0.3 were incubated for 30 h and stained with anti-CANX antibody, anti-EV-A71 3CD antibody, and DAPI; fluorescent signals were detected using microscopy. Arrows indicate EV-A71-infected cells. The scale bar represents 10 µm. (F) RD cells infected with EV-A71 at an MOI of 0.3 were incubated for 8 h (early phase), 16 h (intermediate phase), or 30 h (late phase) and stained with anti-PDI antibody, anti-EV-A71 3CD antibody, and DAPI. The fluorescent signals were detected using microscopy. The arrowhead and straight arrow represent uninfected and EV-A71-infected cells, respectively. The scale bars represent 10 µm (Left). The colocalization analysis was performed using Fiji software (Right). The data presented in A denote mean ± S.D. of two independent experiments; those in B-F are representative of two independent experiments. For the experiment presented in A significance (*P ≤ 0.05; **P ≤ 0.01; ****P ≤ 0.00001; n.s., not significant; n.d., not detected) was determined using one-way analysis of variance (ANOVA) test (n = 4).
Fig 2
Fig 2
EV-A71 infection alters ER homeostasis through viral 3A protein. (A) RD cells infected with EV-A71 at an MOI of 0.3 were incubated for 16 h (intermediate phase) or 30 h (late phase) and stained with anti-CANX antibody, anti-EV-A71 2B, 2C, or 3AB antibody, and DAPI; fluorescent signals were detected using microscopy. The scale bar represents 10 µm. (B) RD cells infected with EV-A71 at an MOI of 0.3 were incubated for 30 h and stained with anti-CANX and anti-EV-A71 2B antibodies. The fluorescent signals were detected using microscopy, and 3D reconstitution was performed using the cellSens imaging software (OLYMPUS). Nuc, nucleus. The straight arrows indicate the cytoplasmic structure of EV-A71-infected cells. (C) RD cells were transfected with GFP, viral proteins of EV-A71 (VP1, VP2, VP3, VP4, 2A, 2B, 2C, 3A 3B, 3C, or 3D), or its precursors (VP0, 2BC, 3AB, or 3CD). BiP expression was quantified using qPCR at 48 h post-transfection. RD cells were transfected with an increasing amount of a plasmid encoding 3A protein, and BiP expression was detected using qPCR (D) and immunoblotting (E) at 48 h post-transfection. Tf, transfection. (F) Expression of BiP in HEK293T cells (Left) or HT-29 cells (Right) expressing 3A was quantified using qPCR at 48 h post-transfection. (G) RD cells were transfected with 3A protein, and expression of genes related to UPR (BiP, XBP1s, CHOP, CANX, GRP94, PDI, EDEM1, or HERPD1) was quantified using qPCR at 48 h post-transfection. (H-L) Expression of GFP, VP1, VP2, VP3, VP4, VP0, 2A, 2B, 2C, 3A, 3C, 3D, 2BC, 3AB, or 3CD in RD cells was detected using immunoblotting. The transfected amounts of plasmid presented in each figure were calculated based on 24-well plates. The data presented in C, D, F, and G denote mean ± S.D. of two independent experiments; those in A, B, E, and H-L are representative of two independent experiments. For the experiments presented in C, D, and F, significance (*P ≤ 0.05; **P ≤ 0.01; ***P ≤ 0.001; ****P ≤ 0.00001; n.s., not significant) was determined using one-way ANOVA test (n = 4). For the experiment presented in G, significance (**P ≤ 0.01; ***P ≤ 0.001; ****P ≤ 0.00001) was determined using Student’s t-test (n = 4).
Fig 3
Fig 3
3A protein of EV-A71 activates UPR pathways. (A) The structure of the reporter vector detecting XBP1 splicing (Addgene, #115968) (Upper). RD cells transfected with a plasmid encoding N-terminal mCherry-tagged 3A protein and the reporter vector. The fluorescent signals were detected using microscopy at 24 h post-transfection. Arrowhead: mNeonGreen-positive cells. The scale bar represents 40 µm. (B) The row data of fluorescent images obtained from the experiment in Fig. 2A (20× magnification, n = 3 in each experiment) were quantified using Fiji software to determine the percentage of mCherry-positive cells expressing mNeonGreen. RD cells were transfected with increasing concentrations of the 3A protein, and XBP1s expression was detected using qPCR (C) and immunoblotting (D) at 48 h post-transfection. RD cells were transfected with N-terminal AcGFP-tagged ATF6 and N-terminal mCherry-tagged 3A protein; (E) fluorescent signals were detected using microscopy at 48 h post-transfection. The scale bar represents 10 µm. (F) Expression levels of full-length ATF6, cleaved ATF6, and 3A protein were detected using immunoblotting at 48 h post-transfection using an anti-FLAG antibody. (G) The structure of the reporter vector detecting induction of ATF4 (Addgene, #115969) (Upper). RD cells co-transfected with a plasmid encoding N-terminal AcGFP-tagged 3A protein, and the reporter vector and fluorescent signals were detected using microscopy at 24 h post-transfection. Arrowhead, mScarlet-I-positive cells. The scale bar represents 40 µm. (H) The row data of fluorescent images obtained from the experiment in Fig. 2G (20× magnification, n = 3 in each experiment) were quantified using Fiji software to determine the percentage of AcGFP-positive cells expressing mScarlet-I. RD cells were transfected with an increasing amount of a plasmid encoding 3A protein, and CHOP expression was detected using qPCR (I) and immunoblotting (J) at 48 h post-transfection. The transfected amounts of plasmid presented in each figure were calculated based on 24-well plates. The data presented in C and I denote mean ± S.D. of two independent experiments; those in A, B, D–H, and J are representative of two independent experiments. Significance (*P ≤ 0.05; **P ≤ 0.01; ***P ≤ 0.001; ****P ≤ 0.00001; n.s., not significant) was determined using one-way ANOVA test (n = 4).
Fig 4
Fig 4
2B, 2C, or 2BC protein is not involved in UPR responses. (A) RD cells co-transfected with a plasmid encoding N-terminal mCherry-tagged 2B, 2C, 2BC, or 3A protein and the reporter vector. The fluorescent signals were detected using microscopy at 24 h post-transfection. Arrowhead: mNeonGreen-positive cells. The scale bar represents 40 µm. (B) RD cells co-transfected with a plasmid encoding N-terminal AcGFP-tagged 3A protein. The reporter vector and fluorescent signals were detected using microscopy at 24 h post-transfection. Arrowhead: mScarlet-I-positive cells. The scale bar represents 40 µm. (C) Expression levels of full-length ATF6, cleaved ATF6, GFP, 2B, 2C, 2BC, and 3A protein were detected using immunoblotting at 48 h post-transfection using an anti-FLAG antibody. (D) Expression of GFP, 2B, 2C, 2BC, 3A, BiP, XBP1s, and CHOP in RD cells was detected using immunoblotting. (E) Expression of BiP, XBP1s, or CHOP in RD cells expressing 2B, 2C, 2BC, or 3A was quantified using qPCR at 48 h post-transfection. The data presented in E denote mean ± S.D. of two independent experiments; data in A-D are representative of two independent experiments. For the experiment presented in E, significance (****P ≤ 0.00001; n.s., not significant) was determined using one-way ANOVA test (n = 4).
Fig 5
Fig 5
Inhibition of PERK reduces the plaque size of EV-A71. (A) The chemical structure of compounds used. (B) RD cells were treated with PERKi I, 4µ8C, or Ceapin-A7 for 96 h, and cell viability was determined by CellTiter-Glo (Promega). (C) Plaque morphology of EV-A71 in RD cells. The plaque overlay medium was supplemented with or without 3 µM of PERKi I. (D) Plaque overlay medium of RD cells infected with EV-A71 was supplemented with or without 3 µM of PERKi I, and plaque formation assay was performed in triplicate. The dilution of the viruses was 10−4. All plaques presented in each well were analyzed, and their areas were quantified using Fiji software. (E) Plaque morphology of EV-A71-infected RD cells overlayed with medium supplemented with/without 3 µM of 4µ8c, or Ceapin-A7. The dilution of the viruses was 10−3. (F) Plaque morphology of EV-A71 in RD cells. The plaque overlay medium was supplemented with or without 10 µM of AMG PERK 44. (G) The plaque overlay medium of EV-A71-infected RD cells was supplemented with or without 10 µM of AMG PERK 44, and plaque formation assay was performed in triplicate. The dilution of the viruses was 10−4. All plaques in each well were analyzed, and their areas were quantified using Fiji software. (H) RD cells were treated with AMG PERK 44 for 96 h, and cell viability was determined by CellTiter-Glo (Promega). (I) RD cells infected with EV-A71 at an MOI of 0.3 were treated with PERKi I, 4µ8C, or Ceapin-A7 at concentrations of 1.0, 3.0, or 10 µM. Infectious titers in the culture supernatants were determined using a plaque-forming assay, and (J) intracellular EV-A71 RNA levels were determined using qPCR at 24 h post-infection. The data presented in I and J denote mean ± S.D. of two independent experiments; those in B–H are representative of two independent experiments. For the experiments presented in I and J, significance (*P ≤ 0.05; **P ≤ 0.01; ****P ≤ 0.00001; n.s., not significant) was determined using one-way ANOVA test (n = 4). For the experiments presented in D and G, significance (****P ≤ 0.00001) was determined using Student’s t-test (n = 3).
Fig 6
Fig 6
Enterovirus infection induces ER stress-dependent cell death. (A) RD cells infected with EV-A71 at an MOI of 0.3 were treated with 3 µM of PERKi I, 4µ8C, or Ceapin-A7 for 24 h, and phase contrast images were acquired using microscopy. The scale bar represents 40 µm. (B) RD cells infected with EV-A71 at an MOI of 0.3 were treated with 3 µM of PERKi I, and the expression of PARP and cleaved PARP was detected using immunoblotting at 24 h post-infection. (C) RD cells infected with EV-A71 at an MOI of 0.3 were treated with PERKi I at concentrations of 0.03, 0.1, 0.3, 1.0, or 3.0 µM, and the expression of PARP and cleaved PARP was detected using immunoblotting at 48 h post-transfection. (D) RD cells infected with EV-A71 at an MOI of 0.3 were treated with PERKi I at a concentration of 3 µM, and activity of caspase 3/7 was detected at 24 h post-transfection. (E). Expression of PARP and cleaved PARP in RD cells pre-transfected with various amounts of the 3A plasmids was detected using immunoblotting at 48 h post-transfection. (F) Caspase-3 and -7 activity in RD cells expressing varying levels of 3A protein was detected at 48 h post-transfection. (G) RD cells infected with EV-A71 or EV-D68 at an MOI of 0.1 were incubated for 36 h. RD cells infected with CVB3 or PV1 at an MOI of 0.01 were incubated for 18 h. Expression of BiP, XBP1s, and CHOP was quantified using qPCR. (H) RD cells expressing GFP or 3A proteins of enterovirus species (EV-A71, CVB3, PV1, and EV-D68). Expression of BiP, XBP1s, and CHOP was quantified using qPCR at 48 h post-transfection. (I) RD cells expressing GFP or 3A proteins of enterovirus species. Expression of BiP, XBP1s, and CHOP was detected using immunoblotting at 48 h post-transfection. (J) Plaque morphology of CVB3, PV1, PV3, and EV-D68 in RD cells. The plaque overlay medium was supplemented with or without 3 µM of PERKi I. Dilution of the viruses was 10−4 (CVB3), 10−7 (PV1), 10−7 (PV3), and 10−5 (EV-D68). (K) Plaque overlay medium of RD cells infected with CVB3, PV1, PV3, or EV-D68 was supplemented with or without 3 µM of PERKi I, and plaque formation assay was performed in triplicate. The dilution of the viruses was 10−4 (CVB3), 10−7 (PV1), 10−7 (PV3), and 10−5 (EV-D68). All plaques presented in each well were analyzed, and their areas were quantified using Fiji software. The transfected amounts of plasmid presented in each figure were calculated based on 24-well plates. The data presented in G and H denote the mean ± S.D. of two independent experiments; those in A–F and I–K are representative of two independent experiments. For the experiment presented in D, F, G, and H, significance (*P ≤ 0.05; **P ≤ 0.01; ***P ≤ 0.001; ****P ≤ 0.00001; n.s., not significant) was determined using one-way ANOVA test (n = 4). For the experiment presented in K, significance (****P ≤ 0.00001) was determined using Student’s t-test (n = 3).
Fig 7
Fig 7
Role of Ile8 and Ile10 of the 3A protein in inducing UPR responses. (A) Schematic representation of the constructed mutant 3A proteins. (B) RD cells expressing C-terminal deletion mutants of 3A protein were lysed with 1% Triton X-100-containing lysis buffer, and both soluble and pellet fractions were subjected to immunoblotting. 3A protein was detected using an anti-FLAG antibody. (C) RD cells expressing 3A protein were subsequently treated with ALLN (proteasome inhibitor, 20 µM) for 12 h, and 3A protein was detected using immunoblotting. (D-G) RD cells expressing mutant 3A proteins were subjected to immunoblotting at 48 h post-transfection. (H) Expression of BiP and XBP1s in RD cells expressing wild-type or mutants of 3A was quantified using qPCR at 48 h post-transfection. (I) Expression of BiP or XBP1s in RD cells expressing wild-type or mutants of 3A protein was quantified using qPCR at 48 h post-transfection. (J) The N-terminal amino acid sequence of 3A proteins of enterovirus species (EV-A71, CVB3, PV1, and EV-D68) was aligned using Clustal Omega (upper). Secondary structures of 3A protein derived from EV-A71 were indicated. Information on the secondary structures was obtained from Protein Data Bank (PDB ID code: 6HLW) and a related article (PMID: 31381608) (Lower). (K) Homology modeling of the N-terminal region of 3A protein was performed using the Iterative Threading ASSEmbly Refinement (I-TASSER) server. The structure of the 3A protein is shown with a cartoon backbone representation (Left) and electrostatic surface representation (Right). (L) Infectious titers of the non-passaged EV-A71-I8A or EV-A71-I10A produced in RD cells were determined using a plaque-forming assay. (M) RD cells were infected with EV-A71-3A-I8A at an MOI of 0.1, and infectious titers were determined using a plaque-forming assay at 4, 8, 16, 24, 36, 48, or 72 h post-infection. (N) Expression of BiP (Left) and XBP1s (Right) in RD cells infected with EV-A71 at an MOI of 0.1 was determined using qPCR at 36 h post-infection. (O) The infectious titers of EV-A71 and EV-A71-3A-I8A obtained from the experiment presented in Fig. 7N were determined using a plaque-forming assay. The data shown in H, I, and L-O are the mean S.D. of two independent experiments; those in B-G are representative of two independent experiments. Significance (**P ≤ 0.01; ***P ≤ 0.001; ****P ≤ 0.00001; n.s., not significant) was determined using one-way ANOVA test (n = 4).
Fig 8
Fig 8
Role of Ile8 and Ile10 of the 3A protein in UPR induction and protein transportation. (A) HEK293T cells co-expressing HA-tagged BiP with FLAG-tagged GFP, FLAG-tagged wild type or mutants of 3A were immunoprecipitated and subjected to sodium dodecyl sulfate-polyacrylamide gel electrophoresis and immunoblotting. (B) Schematic representation of RNA-seq performed. RD cells expressing wild-type or mutants of 3A protein were analyzed. (C) Volcano plots depicting the differentially expressed genes (DEGs). RD cells and 3A-expressing RD cells were compared. (D) Gene ontology (GO) biological process of RD cells and 3A-expressing RD cells were compared using Integrated Differential Expression and Pathway (iDEP) analysis. All biological processes demonstrated significant differences. (E) Gene ontology (GO) biological process of RD cells expressing wild type or mutants 3A protein was compared using iDEP analysis. All biological processes that showed significant differences were shown. (F) Chemical structure of Brefeldin A (BFA). Expression of BiP and XBP1s in RD cells treated with BFA (0.1, 0.3, and 1.0 µM) for 24 h was quantified using qPCR (G) and immunoblotting (H). The data presented in G denote mean ± S.D. of two independent experiments; those in A and H are representative of two independent experiments. Significance (**P ≤ 0.01; ****P ≤ 0.00001; n.s., not significant) was determined using one-way ANOVA test (n = 4).
Fig 9
Fig 9
GBF1-induced ARF1 activation is crucial for ER homeostasis. (A) Schematic representation of inhibitors used in this study and their targets. BFA broadly targets GEF families, whereas Golgicide A (GCA) specifically targets GBF1. (B) Expression of BiP (Left) and XBP1s (Right) in GCA-treated RD cells (1, 3, 10 µM) for 24 h was quantified using qPCR. (C) Expression of BiP (Left) or GBF1 (Right) in RD or GBF1-knockdown RD cells was quantified using qPCR. (D) Schematic representation of the domain structure of GBF1. The E794K mutation introduced in GBF1 is located in the Sec7 domain. (E) Expression of BiP (Upper) and XBP1s (lower) in RD cells transfected with wild type or E794K mutant of GBF1 was quantified using qPCR at 48 h post-transfection. (F) Expression of GBF1 in RD cells transfected with wild type or E794K mutant of GBF1 was confirmed using immunoblotting at 48 h post-transfection. (G) Expression of BiP (Upper) and XBP1s (Lower) in RD cells transfected with wild type or T31N mutant of ARF1 was quantified using qPCR at 48 h post-transfection. (H) Expression of ARF1 in RD cells transfected with wild type or T31N mutant of ARF1 was assessed using immunoblotting at 48 h post-transfection. (I) RD cells expressing ARF1 Q71L at varying levels were treated with GCA (10 µM) 24 h post-transfection. The expression of BiP (Upper) and XBP1s (Lower) was quantified using qPCR at 48 h post-transfection. (J) RD cells expressing ARF1 Q71L at varying levels were treated with GCA (10 µM) 24 h post-transfection. The expression of ARF1 was detected using immunoblotting at 48 h post-transfection. The amount of the transfected plasmids presented in each figure was calculated based on 24-well plates. The data presented in B, C, E, G, and I denote mean ± S.D. of two independent experiments; those in F, H, and J are representative of two independent experiments. Significance (*P ≤ 0.05; **P ≤ 0.01; ***P ≤ 0.001; ****P ≤ 0.00001; n.s., not significant) was determined using one-way ANOVA test (n = 4).
Fig 10
Fig 10
3A protein sequesters GBF1 in the cytosolic structure and induces UPR. (A) Expression of BiP and XBP1s in RD cells co-expressing 3A protein with either GFP, GBF1, or ARF1 Q71L was quantified using qPCR at 48 h post-transfection. (B) Expression of BiP and XBP1s in RD cells co-expressing 3A protein with either GFP or ACBD3 was quantified using qPCR at 48 h post-transfection. (C) RD cells co-expressing 3A with GFP or GBF1 were subjected to immunoblotting at 48 h post-transfection. (D) RD cells co-expressing 3A with GFP or ARF1 Q71L were subjected to immunoblotting at 48 h post-transfection. (E) RD cells co-expressing 3A with GFP or ACBD3 were subjected to immunoblotting at 48 h post-transfection. (F) RD cells infected with EV-A71 at an MOI of 0.3 were stained with anti-GM130 antibody, anti-EV-A71 3CD antibody, and DAPI at 30 h post-infection, and fluorescent signals were detected using microscopy. Arrowhead and straight arrow denote uninfected and EV-A71-infected cells, respectively. The scale bar represents 10 µm. (G) RD cells infected with EV-A71 expressing HA-tagged 3A protein (EV-A71-HA-3A) at an MOI of 0.3 were stained with anti-GBF1 antibody, anti-HA antibody, and DAPI at 24 h post-infection, and fluorescent signals were detected using microscopy. The scale bar represents 10 µm. (H) RD cells infected with recombinant EV-A71-HA-3A at an MOI of 0.3 were stained with anti-GBF1 antibody, anti-HA antibody, and DAPI at 24 h post-infection, and fluorescent signals were detected using microscopy. The scale bar represents 5 µm. The colocalization analysis was performed using Fiji software (Right). (I) RD cells co-expressing N-terminal mCherry-tagged 3A protein with N-terminal AcGFP-tagged GBF1 were examined using fluorescent microscopy at 48 h post-transfection. 3d reconstitution was performed using the cellSens imaging software (OLYMPUS). The arrows indicate the co-localization of GBF1 and 3A proteins. The data presented in A and B denote mean ± S.D. of two independent experiments; those in C-I are representative of two independent experiments. Significance (***P ≤ 0.001; ****P ≤ 0.00001; n.s., not significant) was determined using one-way ANOVA test (n = 4).
Fig 11
Fig 11
Interaction of Ile8 and Ile10 of the 3A protein with GBF1. (A) The protein complex of 3A and the N-terminal half of GBF1 was generated using the AlphaFold2 algorithm. The DCB, HUS, and Sec7 domains of GBF1 are indicated in yellow, blue, and green, respectively. (B) A close-up view of the interaction interface of 3A and GBF1. The 3A interacts with GBF1 via amino acid residues I8 and I10. (C) RD cells expressing N-terminal AcGFP-tagged GBF1 and N-terminal mCherry-tagged wild type or mutants of 3A protein and fluorescent signals were detected using microscopy at 48 h post-transfection. The scale bar represents 10  µm. The colocalization analysis was performed using Fiji software (Right). (D) HEK293T cells co-expressing GFP-tagged GBF1 with One-STrEP-tagged GFP, One-STrEP-tagged wild type or mutants of 3A protein were subjected to immunoprecipitation assay. Immunoprecipitated samples (IP) and whole-cell lysates (WCL) were subjected to sodium dodecyl sulfate-polyacrylamide gel electrophoresis and immunoblotting. The data presented in C and D are representative of two independent experiments.
Fig 12
Fig 12
EV-A71 infection induces accumulation of proteins localized in ER. (A) RD cells infected with recombinant EV-A71-HA-3A at an MOI of 0.3 were stained with anti-CANX antibody, anti-HA antibody, and DAPI at 24 h post-infection, and fluorescent signals were detected using microscopy. The scale bar represents 5 µm. (B) RD cells infected with EV-A71 at an MOI of 0.3 were incubated for 30 h and stained with anti-KDEL antibody, anti-EV-A71 3CD antibody, and DAPI. The fluorescent signals were detected using microscopy. The scale bars represent 10 µm. (C) RD cells infected with EV-A71 at an MOI of 0.3 were incubated for 8 h (early phase), 16 h (intermediate phase), or 30 h (late phase) and stained with anti-KDEL antibody, anti-EV-A71 3CD antibody, and DAPI. The fluorescent signals were detected using microscopy. The arrowhead and straight arrow represent uninfected and EV-A71-infected cells, respectively. The scale bars represent 10 µm (Left). The cytoplasmic structures of ER-resident proteins were analyzed, and their areas were quantified using Fiji software (n = 30 in each group) (Right). (D) Schematic representation of GBF1 hijacking by 3A. Expression of 3A upon infection induces sequestration of GBF1 at RO, inhibiting ARF1 activation. The inhibition of GBF1 affects ER homeostasis, causing activation of the PERK/CHOP-mediated apoptotic branch of UPR. The data presented in A-C are representative of two independent experiments. Significance (**P ≤ 0.01; ***P ≤ 0.001; n.s., not significant) was determined using one-way ANOVA test (n = 30).

References

    1. Baumann O, Walz B. 2001. Endoplasmic reticulum of animal cells and its organization into structural and functional domains. Int Rev Cytol 205:149–214. doi:10.1016/s0074-7696(01)05004-5 - DOI - PubMed
    1. Reimertz C, Kögel D, Rami A, Chittenden T, Prehn JHM. 2003. Gene expression during ER stress-induced apoptosis in neurons: induction of the BH3-only protein Bbc3/PUMA and activation of the mitochondrial apoptosis pathway. J Cell Biol 162:587–597. doi:10.1083/jcb.200305149 - DOI - PMC - PubMed
    1. Wang M, Kaufman RJ. 2016. Protein misfolding in the endoplasmic reticulum as a conduit to human disease. Nature 529:326–335. doi:10.1038/nature17041 - DOI - PubMed
    1. Choi JA, Song CH. 2019. Insights into the role of endoplasmic reticulum stress in infectious diseases. Front Immunol 10:3147. doi:10.3389/fimmu.2019.03147 - DOI - PMC - PubMed
    1. Li S, Kong L, Yu X. 2015. The expanding roles of endoplasmic reticulum stress in virus replication and pathogenesis. Crit Rev Microbiol 41:150–164. doi:10.3109/1040841X.2013.813899 - DOI - PMC - PubMed

MeSH terms