The effect of phencyclidine-mediated blockade of NMDA receptors in the early postnatal period on glutathione and sulfur amino acid levels in the rat brain as a potential causative factor of schizophrenia-like behavior in adulthood
- PMID: 38904712
- PMCID: PMC11294273
- DOI: 10.1007/s43440-024-00607-3
The effect of phencyclidine-mediated blockade of NMDA receptors in the early postnatal period on glutathione and sulfur amino acid levels in the rat brain as a potential causative factor of schizophrenia-like behavior in adulthood
Abstract
Background: Phencyclidine, an NMDA receptor antagonist, is frequently used to model behavioral and neurochemical changes correlated with schizophrenia in laboratory animals. The present study aimed to examine the effects of repeated administration of phencyclidine during early postnatal development on the contents of glutathione and sulfur-containing amino acids, as well as the activity of antioxidant enzymes in the brain of 12-day-old rats, and schizophrenia-like symptoms in adulthood.
Methods: Male Sprague-Dawley pups were administered phencyclidine (10 mg/kg) or saline subcutaneously on the postnatal days p2, p6, p9 and p12. In 12-day-old pups, 4 h after the last dose of phencyclidine, the levels of glutathione, cysteine, methionine, and homocysteine, and the enzymatic activity of superoxide dismutase (SOD), glutathione peroxidase (GPx), and glutathione reductase (GR) were measured in the frontal cortex, hippocampus, and striatum. In 70-72-day-old rats, schizophrenia-like symptoms were assessed using behavioral tests.
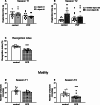
Results: Biochemical data showed that perinatal phencyclidine treatment significantly reduced glutathione and cysteine levels in all brain structures studied, methionine was diminished in the striatum, and homocysteine in both the frontal cortex and striatum. GR activity was increased in the frontal cortex while SODactivity was decreased in the hippocampus. Behaviorally, perinatal phencyclidine induced long-term deficits in social and cognitive function and a decrease in locomotor activity assessed as the time of walking. Finally, perinatal treatment with phencyclidine resulted in a significant reduction in body weight gain over time.
Conclusion: Our research provides further evidence for the usefulness of the phencyclidine-induced neurodevelopmental model of schizophrenia for studying the pathogenesis of schizophrenia.
Keywords: Glutathione deficiency; Neurodevelopmental model of schizophrenia; Phencyclidine in early postnatal development; Social and cognitive deficits; Sulfur amino acid homeostasis.
© 2024. The Author(s).
Conflict of interest statement
The authors declare no competing interests.
Figures


Similar articles
-
Decreased glutathione levels and altered antioxidant defense in an animal model of schizophrenia: long-term effects of perinatal phencyclidine administration.Neuropharmacology. 2010 Mar-Apr;58(4-5):739-45. doi: 10.1016/j.neuropharm.2009.12.009. Epub 2009 Dec 27. Neuropharmacology. 2010. PMID: 20036264
-
Long-term behavioral and neurodegenerative effects of perinatal phencyclidine administration: implications for schizophrenia.Neuroscience. 2001;107(4):535-50. doi: 10.1016/s0306-4522(01)00384-0. Neuroscience. 2001. PMID: 11720778
-
Glutathione Deficiency and Alterations in the Sulfur Amino Acid Homeostasis during Early Postnatal Development as Potential Triggering Factors for Schizophrenia-Like Behavior in Adult Rats.Molecules. 2019 Nov 22;24(23):4253. doi: 10.3390/molecules24234253. Molecules. 2019. PMID: 31766654 Free PMC article.
-
Postnatal Phencyclidine (PCP) as a Neurodevelopmental Animal Model of Schizophrenia Pathophysiology and Symptomatology: A Review.Curr Top Behav Neurosci. 2016;29:403-428. doi: 10.1007/7854_2015_403. Curr Top Behav Neurosci. 2016. PMID: 26510740 Review.
-
Phencyclidine animal models of schizophrenia: approaches from abnormality of glutamatergic neurotransmission and neurodevelopment.Neurochem Int. 2007 Jul-Sep;51(2-4):173-84. doi: 10.1016/j.neuint.2007.06.019. Epub 2007 Jun 27. Neurochem Int. 2007. PMID: 17669558 Review.
References
MeSH terms
Substances
LinkOut - more resources
Full Text Sources
Medical
Research Materials
