. 2024 Jun 21;9(96):eadi8954.
doi: 10.1126/sciimmunol.adi8954. Epub 2024 Jun 21.

MAIT cells monitor intestinal dysbiosis and contribute to host protection during colitis

Affiliations

MAIT cells monitor intestinal dysbiosis and contribute to host protection during colitis

Yara El Morr et al. Sci Immunol. .

Abstract

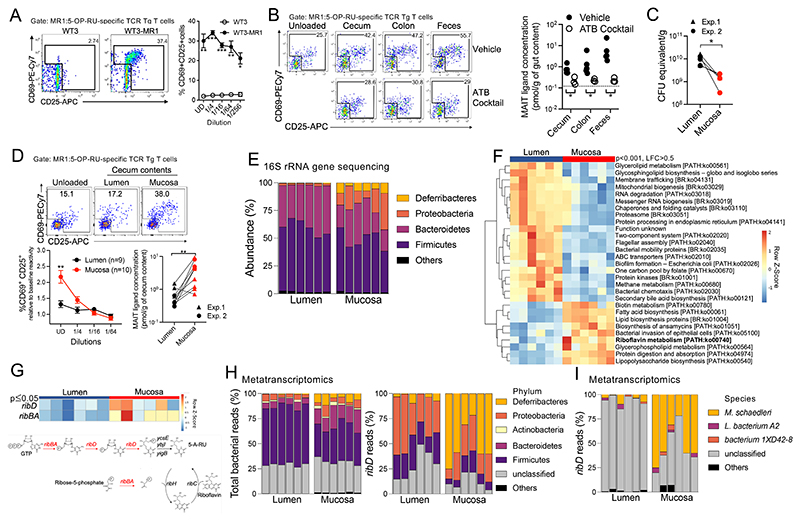
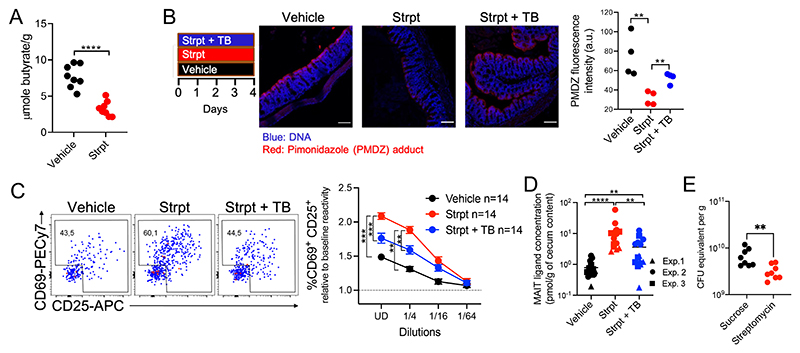
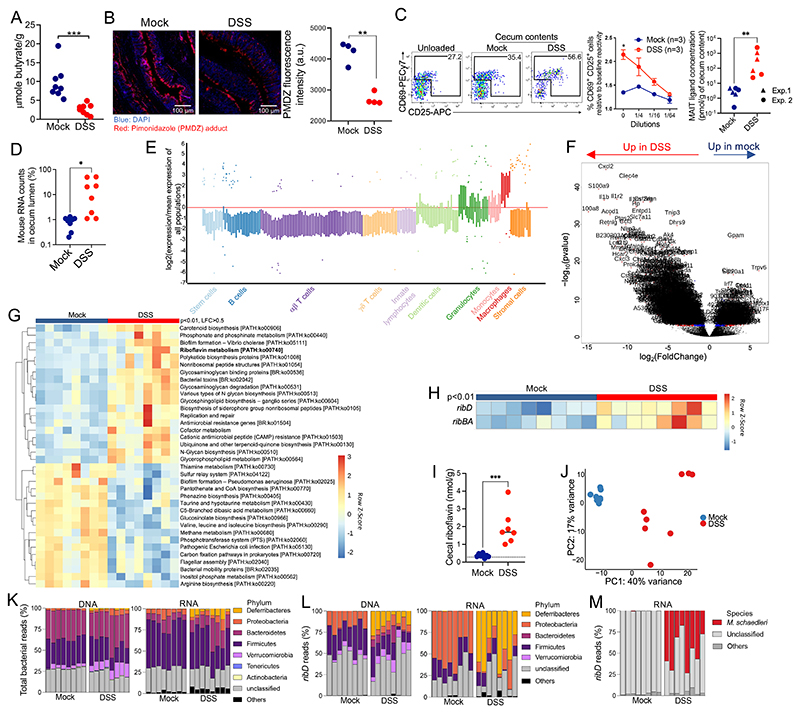
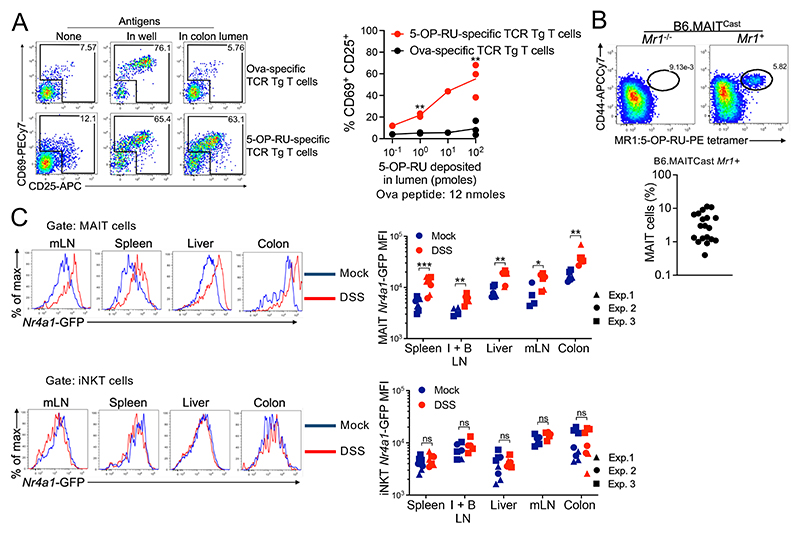
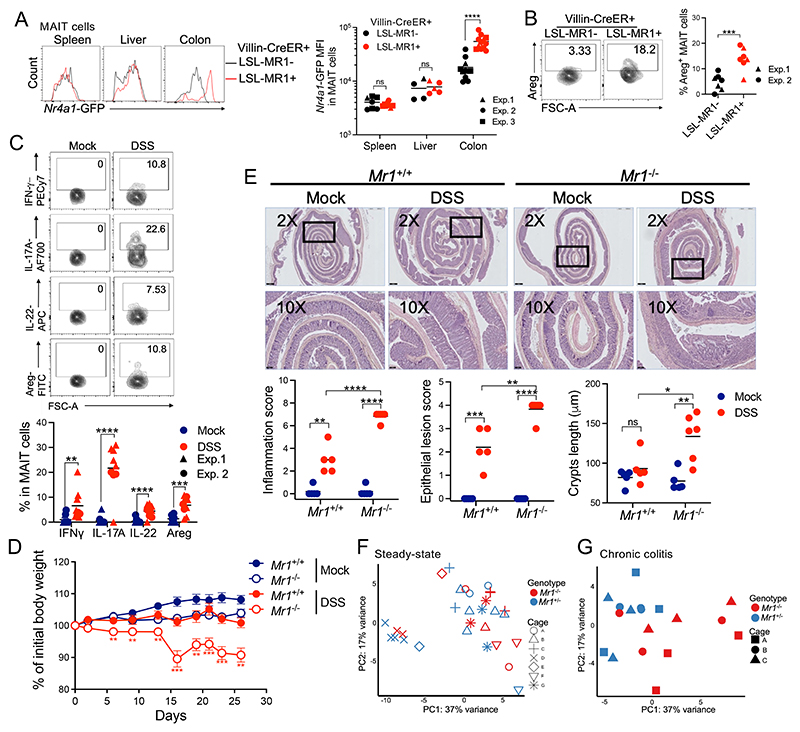
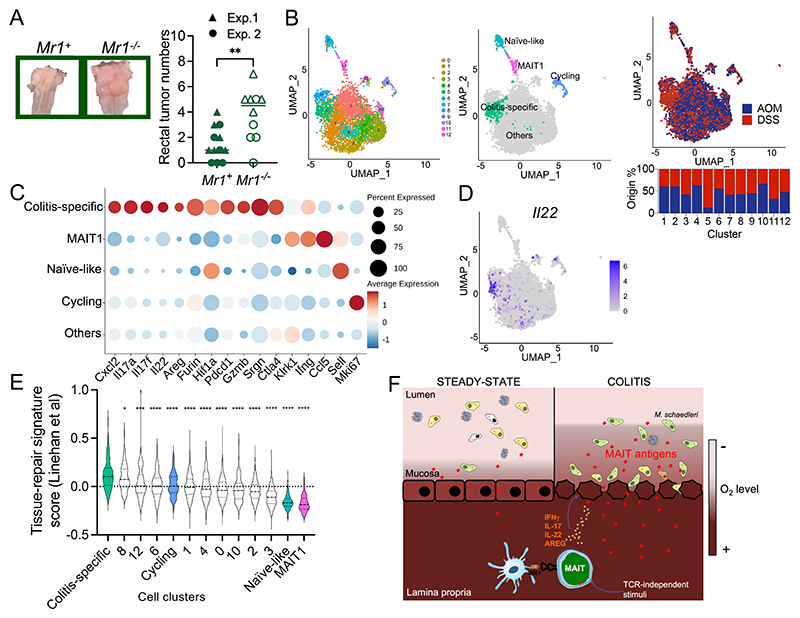
Intestinal inflammation shifts microbiota composition and metabolism. How the host monitors and responds to such changes remains unclear. Here, we describe a protective mechanism by which mucosal-associated invariant T (MAIT) cells detect microbiota metabolites produced upon intestinal inflammation and promote tissue repair. At steady state, MAIT ligands derived from the riboflavin biosynthesis pathway were produced by aerotolerant bacteria residing in the colonic mucosa. Experimental colitis triggered luminal expansion of riboflavin-producing bacteria, leading to increased production of MAIT ligands. Modulation of intestinal oxygen levels suggested a role for oxygen in inducing MAIT ligand production. MAIT ligands produced in the colon rapidly crossed the intestinal barrier and activated MAIT cells, which expressed tissue-repair genes and produced barrier-promoting mediators during colitis. Mice lacking MAIT cells were more susceptible to colitis and colitis-driven colorectal cancer. Thus, MAIT cells are sensitive to a bacterial metabolic pathway indicative of intestinal inflammation.


Conflict of interest statement

Competing interests: The authors declare that they have no competing interests.

Figures

Fig. 1
Fig. 1. Bacterial production of MAIT ligands in the colonic mucosa.
(A) activation of MR1:5-OP-RU–specific TCR Tg T cells after coculture with WT3 or WT3-MR1 cells pulsed with colon luminal contents at the indicated dilutions (n = 3 mice per group; data pooled from N = 2). *P < 0.05, **P < 0.01, and ***P < 0.001 by unpaired multiple t tests with a false discovery rate (FDR) = 1%. UD, undiluted. (B) left, MR1:5-OP-RU–specific TCR Tg T cell activation after coculture with WT3-MR1 cells pulsed with filtered luminal contents from control or antibiotic-treated mice. Right, MAIT ligand concentrations expressed as 5-OP-RU equivalent (n = 3 to 5 mice per group; representative of N = 2). the dotted line indicates TCR Tg T cell activation in the absence of intestinal contents. *P < 0.05 by unpaired multiple Mann-Whitney U tests with an FDR = 1%. (C) Estimation of cecal bacterial numbers by qPcR amplification of the 16S rRna gene (data pooled from N = 2). *P < 0.05 by paired Wilcoxon test. (D) top, MR1:5-OP-RU–specific TCR Tg T cell activation after coculture with WT3-MR1 cells pulsed with lumen or mucosal cecal contents. Bottom left, relative expression of CD25 and CD69 by MR1:5-OP-RU–specific TCR Tg T cells in the indicated conditions (means ± SEMs, n = 9 or 10 mice; data pooled from N = 2). **P < 0.01 by paired multiple t tests with an FDR = 1%. Bottom right: Mait ligand concentrations expressed as 5-OP-RU equivalent. **P < 0.01 by paired Wilcoxon test. (E) abundance of the indicated phyla in the cecum. columns indicate individual mice. (F) Differentially expressed metabolic pathways between the lumen and mucosal bacterial communities [Padj < 0.001 by Mann-Whitney U test, log fold change (LFC) > 0.5]. (G) top, riboflavin biosynthetic pathway gene expression in the cecal lumen and mucosa (Padj ≤ 0.05 by Mann-Whitney U test). Bottom, scheme of the riboflavin biosynthesis pathway. (H) taxonomy of total (left) and ribD (right) bacterial transcripts in the lumen and mucosa. (I) Species-level taxonomy of ribD transcripts in the lumen and mucosa.
Fig. 2
Fig. 2. Dysanaerobiosis drives microbiota production of MAIT ligands.
(A) cecal butyrate concentrations in control (vehicle) and streptomycin (strpt)–treated mice. n = 8 mice per group, N = 1. ****P < 0.0001 by unpaired Student’s t test. (B) left, PMDZ adduct (red) and DaPi (blue) staining at colon epithelial surfaces (each dot summarizes data from one mouse). White bars represent 100 μm. Representative of N = 2. **P < 0.01 by unpaired Student’s t test. (C) MR1:5-OP-RU–specific TCR Tg T cell activation after coculture with WT3-MR1 cells pulsed with cecal contents from the indicated mice (n = 14 mice per group; data pooled from N = 3). ***P < 0.001, **P < 0.01 by unpaired multiple t tests with FDR = 1%. (D) MAIT ligand concentrations expressed as 5-OP-RU equivalent (n = 14 mice per group, data pooled from N = 3). **P < 0.01 and ****P < 0.0001 by unpaired Mann-Whitney U tests. (E) qPCR-based estimation of cecal bacterial numbers in the indicated mice. n = 8 mice per group, N = 1. **P < 0.01 by unpaired Mann–Whitney U test.
Fig. 3
Fig. 3. Intestinal inflammation triggers riboflavin and MAIT ligand production by the microbiota.
(A) cecal butyrate concentrations in control (mock) and DSS-treated mice. n = 8 mice, N = 1. ***P < 0.001 by unpaired Student’s t test. (B) left, PMDZ adduct (red) and DNA (blue) staining in the colon. White bars represent 100 μm. Right, quantification of PMDZ staining at colon epithelium surfaces (each dot summarizes data from one mouse. Data representative of N = 2. **P < 0.01 by unpaired Student’s t test. (C) left, MR1:5-OP-RU–specific TCR Tg T cell activation after coculture with WT3-MR1 cells pulsed with cecal contents from control or DSS-treated mice (means ± SEMs, n = 3 mice per group, representative of N = 2). *P < 0.05 by unpaired multiple t tests with an FDR = 1%. Right, Mait ligand concentrations expressed as 5-OP-RU equivalent (n = 6 mice per group, data pooled from N = 2). **P < 0.01 by unpaired Mann-Whitney U test. (D) Percentage of mouse transcripts in ceca from the indicated mice. *P < 0.05 by unpaired Mann-Whitney U test. (E) Predicted cell-type enrichment in the cecum lumen upon DSS treatment (see Materials and Methods). (F) Differentially expressed mouse genes in the cecum lumen upon DSS treatment. (G) Bacterial metabolic pathways differentially expressed between control and DSS-treated mice (Padj < 0.01 by Mann-Whitney U test, LFC > 0.5). (H) Differentially expressed riboflavin biosynthetic pathway transcripts between control and DSS-treated mice (Padj < 0.01 by Mann-Whitney U test). (I) cecal riboflavin concentration (n = 7 or 8 mice per group, representative of N = 2). the dotted line indicates the plasma riboflavin concentration at steady state. ***P < 0.001 by unpaired Student’s t test. (J) PCA of cecal DNA reads at the family level in control and DSS-treated mice. (K) Phylum-level taxonomy of total bacterial DNA (left) or RNA (right) reads from the cecum. (L) Phylum-level taxonomy of ribD DNA (left) or RNA (right) reads from the cecum. (M) Species-level taxonomy of ribD transcripts.
Fig. 4
Fig. 4. MAIT ligands cross the intestinal barrier and are presented to MAIT cells in various tissues.
(A) TCR Tg T cell activation in the indicated conditions. Data were pooled from N = 2. **P < 0.01 by paired multiple t tests with FDR = 1%. (B) identification of Mait cells from the colon lamina propria of B6-MAITCast mice. Pooled data from N = 3. (C) Nr4a1-GFP expression in MAIT (top) and iNKT (bottom) cells. Data pooled from N = 3. ns, P > 0.05, *P < 0.05, **P < 0.01, and ***P < 0.001 by unpaired multiple Mann-Whitney tests with FDR = 1%.
Fig. 5
Fig. 5. MAIT cells reduce colitis severity.
(A) Nr4a1-GFP expression by Mait cells from the indicated mice. Both LSL-MR1+ and LSL-MR1 mice carried the villin-CreER Tg and received tamoxifen. Pooled data from N = 3. ****P < 0.0001 by unpaired Mann-Whitney U test. (B) areg expression by colonic Mait cells from the indicated mice. n = 7 mice per group. Data pooled from N = 2. ***P < 0.001 by unpaired Student’s t test. (C) cytokine production by colonic MAIT cells from control mice and from mice with chronic colitis. n = 9 to 11 mice per group. Data were pooled from N = 2. **P < 0.01, ***P < 0.001, and ****P < 0.0001 by unpaired Student’s t tests. (D) Mouse body weight after mock or chronic DSS treatment. n = 12 or 13 mice per group; data pooled from N = 3. **P < 0.01 and ***P < 0.001 between DSS-treated Mr1+/+ and Mr1−/− mice, by unpaired multiple t tests with FDR = 1%. (E) top, H&E staining of colon from the indicated condition. Representative 2× and 10× magnifications are shown. Black bars represent 500 μm (top) and 100 μm (bottom). Bottom, investigator-blinded pathology assessments in the indicated conditions. n = 5 to 7 mice per group. Data representative of N = 3. ns, P ≥ 0.05, *P < 0.05, **P < 0.01, ***P < 0.001, and ****P < 0.0001 by unpaired Student’s t tests. (F and G) PCA of bacterial families in Mr1+/− and Mr1−/− B6-MAITCast mice either untreated (F) or upon chronic DSS-induced colitis (G). Symbols indicate the cage of origin.
Fig. 6
Fig. 6. MAIT cells protect against inflammation-induced CRC.
(A) Left, representative images of the rectum after inflammation-induced CRC. Right, rectal tumor numbers in the indicated mice. Pooled data from N = 2. **P < 0.01 by unpaired Student’s t test. (B) UMAP of colonic MAIT cells isolated from control (AOM) or colitic (DSS) mice analyzed by single-cell RNA-seq. The relative contribution of MAIT cells from control and colitic mice to each cluster is indicated. (C) Expression of selected genes by MAIT cells from the indicated UMAP clusters. (D) Il22 expression by single-cell RNA-seq in colonic MAIT cells. (E) Tissue-repair gene signature expression in the indicated clusters. the dashed bar represents the median score. *P < 0.05, ***P < 0.001, and ****P < 0.0001 by unpaired Student’s t tests. (F) Schematic summary of the main findings of the study.

References

    1. Lee J-Y, Tsolis RM, Bäumler AJ. The microbiome and gut homeostasis. Science. 2022;377:eabp9960. - PubMed
    1. Litvak Y, Byndloss MX, Bäumler AJ. Colonocyte metabolism shapes the gut microbiota. Science. 2018;362:eaat9076. - PMC - PubMed
    1. Byndloss MX, Bäumler AJ. The germ-organ theory of non-communicable diseases. Nat Rev Microbiol. 2018;16:103–110. - PubMed
    1. Dusseaux M, Martin E, Serriari N, Péguillet I, Premel V, Louis D, Milder M, Le Bourhis L, Soudais C, Treiner E, Lantz O. Human MAIT cells are xenobiotic-resistant, tissue-targeted, CD161hi IL-17-secreting T cells. Blood. 2011;117:1250–1259. - PubMed
    1. Legoux F, Salou M, Lantz O. MAIT cell development and functions: The microbial connection. Immunity. 2020;53:710–723. - PubMed

Publication types

LinkOut - more resources