. 2024 Jun 21;10(25):eadk8501.
doi: 10.1126/sciadv.adk8501. Epub 2024 Jun 21.

Integration mapping of cardiac fibroblast single-cell transcriptomes elucidates cellular principles of fibrosis in diverse pathologies

Affiliations

Integration mapping of cardiac fibroblast single-cell transcriptomes elucidates cellular principles of fibrosis in diverse pathologies

Ralph Patrick et al. Sci Adv. .

Abstract

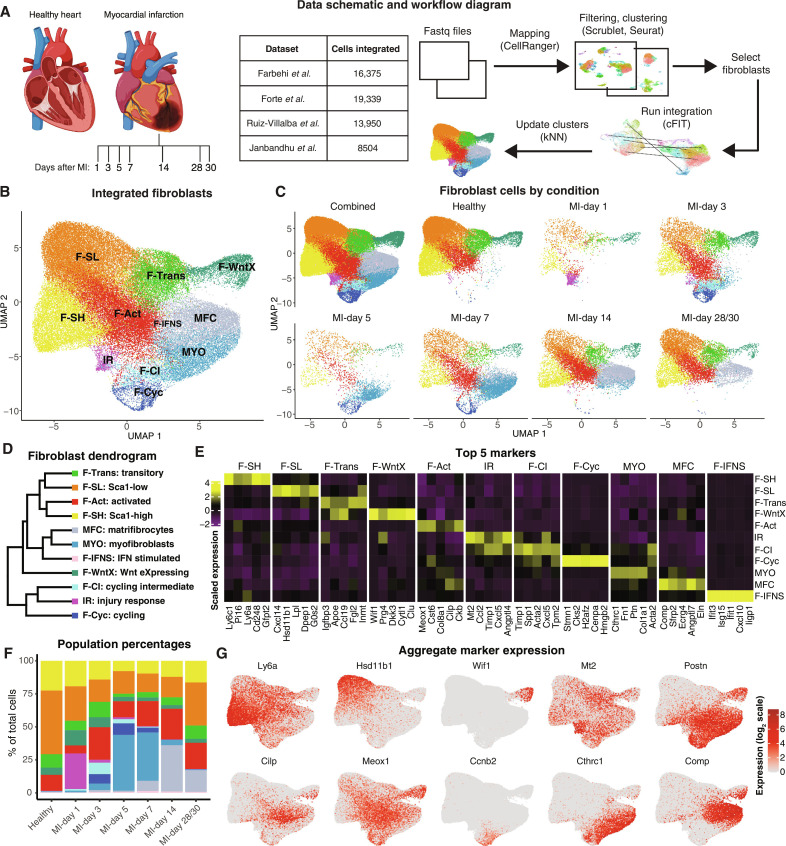
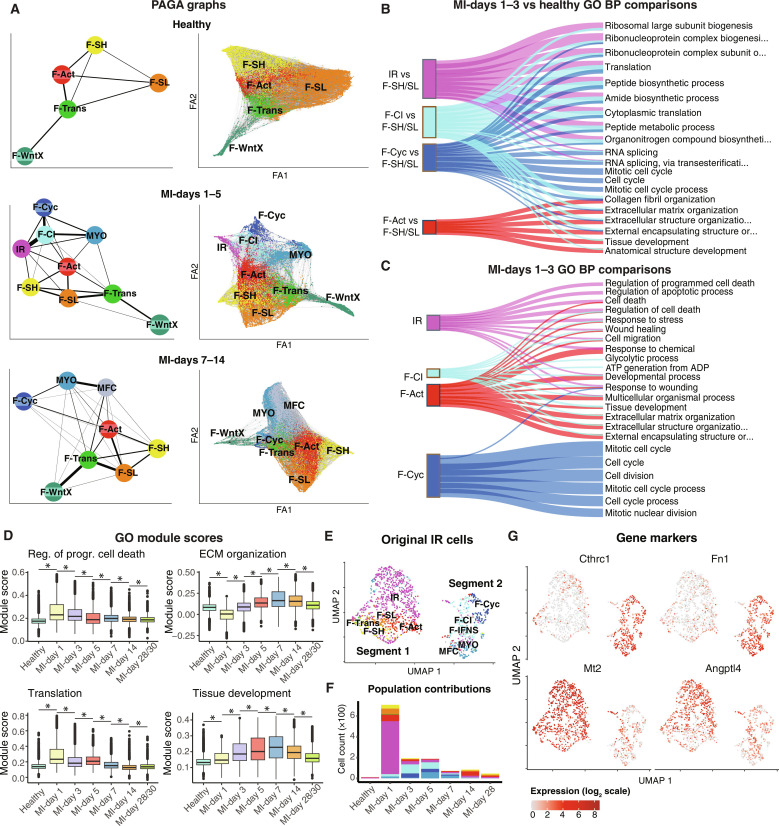
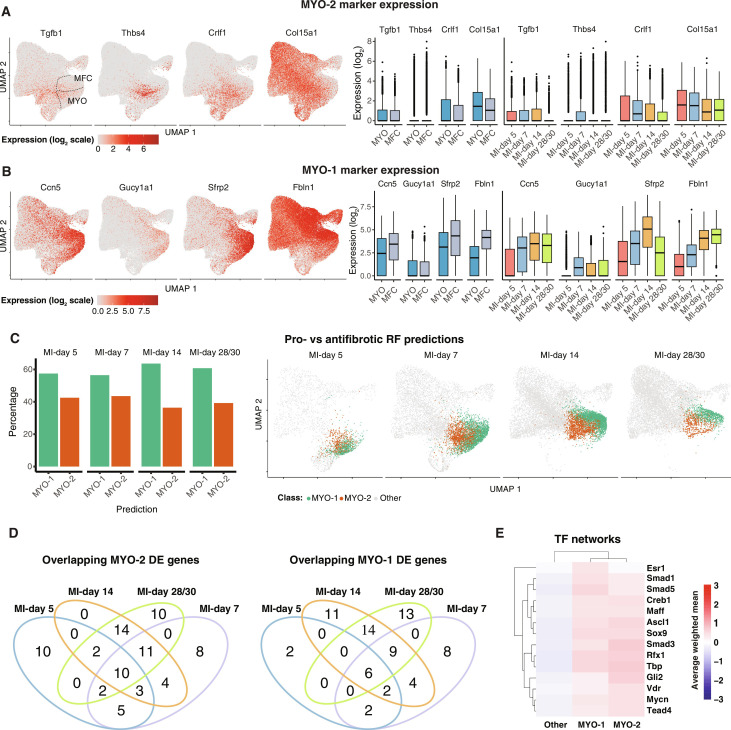
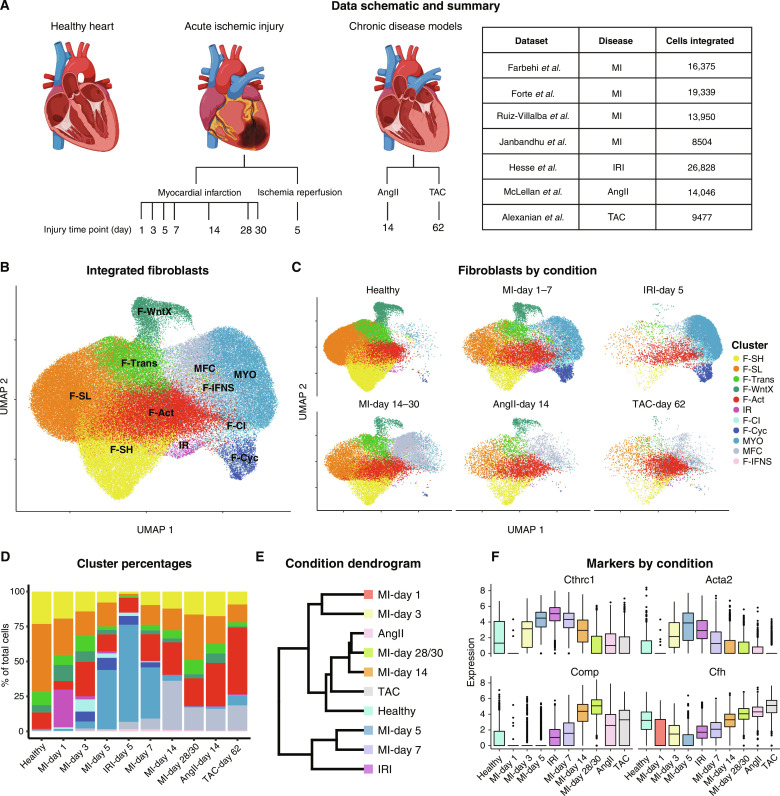
Single-cell technology has allowed researchers to probe tissue complexity and dynamics at unprecedented depth in health and disease. However, the generation of high-dimensionality single-cell atlases and virtual three-dimensional tissues requires integrated reference maps that harmonize disparate experimental designs, analytical pipelines, and taxonomies. Here, we present a comprehensive single-cell transcriptome integration map of cardiac fibrosis, which underpins pathophysiology in most cardiovascular diseases. Our findings reveal similarity between cardiac fibroblast (CF) identities and dynamics in ischemic versus pressure overload models of cardiomyopathy. We also describe timelines for commitment of activated CFs to proliferation and myofibrogenesis, profibrotic and antifibrotic polarization of myofibroblasts and matrifibrocytes, and CF conservation across mouse and human healthy and diseased hearts. These insights have the potential to inform knowledge-based therapies.


Figures

Fig. 1.
Fig. 1.. MI integration of CFs.
(A) Schematic and table of datasets used and workflow for integrative analysis. Created with BioRender.com. (B) UMAP plot showing an aggregate of CFs across conditions. (C) UMAP plot showing CFs according to condition. (D) Dendrogram of CF subtypes determined by average batch-corrected expression in populations. (E) Heatmap of top 5 marker genes per CF population [MAST testing; Padj < 1 × 10−05; log2(fold change) > 0.5]. (F) Percentage of cells in each population according to experimental condition. (G) Expression of select genes in different CF populations as visualized on UMAP coordinates.
Fig. 2.
Fig. 2.. Trajectory analysis of the MI time course.
(A) PAGA graphs of cells from healthy hearts, MI-days 1 to 5, or MI-days 7 to 14. Shown are (left) PAGA trajectories between cell types and (right) the force atlas (FA) layout of cells with top 10 nearest neighbor connections. (B) Sankey plot of top 6 GO BP terms among up-regulated genes [MAST testing; Padj < 1 × 10−05; log2(fold change) > 0.5] per population at MI-days 1 and 3 in comparison to resting (F-SH and F-SL) fibroblasts from uninjured hearts. (C) Sankey plot of top 6 GO BP terms comparing each of the indicated activated populations to the remainder at MI-days 1 and 3. (D) Module scores for DEGs within select GO terms across the MI time points. * indicates a statistically significant difference (Bonferroni-adjusted P < 0.05) according to a two-sided Wilcoxon rank sum test. (E) UMAP of IR cells as identified by initial clustering of the Forte et al. data, with updated cell labels following the kNN analysis incorporating all MI datasets. (F) Population proportion breakdown of (E) according to time point. (G) Expression of indicated genes on the UMAP coordinates of the IR cells from the initial clustering.
Fig. 3.
Fig. 3.. Profibrotic versus antifibrotic MYOs and MFCs.
(A and B) Expression of marker genes for MYO-2 [(A) profibrotic] or MYO-1 [(B) antifibrotic] on an aggregate UMAP or as visualized in box plots comparing MYO and MFC or an aggregate of MYO and MFC across the relevant MI time points. (C) Percentage of MYO/MFC cells across the indicated MI time points predicted with a RF classifier corresponding to either antifibrotic versus profibrotic subtypes. Shown are the percentage of cells predicted in either category (left) or the location of the predicted pro/antifibrotic cells on UMAP coordinates according to time point (right). (D) Venn diagrams representing flux of MYO-1 and MYO-2 differentially expressed signature genes [MAST testing; Padj < 1 × 10−05; log2(fold change) > 0.5] across treatment conditions. (E) Top 10 predicted TFs for MYO-1 or MYO-2 cells for MI-days 5 to 30 cells. Shown are the average weighted mean decoupleR scores across the cells for each indicated population.
Fig. 4.
Fig. 4.. Cross-disease integration.
(A) Schematic of the disease and time points used for integration and the corresponding studies. (B) UMAP plot showing an aggregate of CFs across conditions. (C) UMAP plot showing CFs according to condition. (D) Percentage of CFs in each population according to experimental condition. (E) Dendrogram of disease conditions determined by average batch-corrected expression in each condition across populations. (F) Expression of select markers according to disease condition.
Fig. 5.
Fig. 5.. MFCs are derived from MYOs in AngII model.
(A) Schematic of the experimental (Expt) design. (B) Heart weight–to–body weight ratio (HW/BW) following AngII administration (n = 9 to 10). (C and D) Percentage of tdTomato+CD31CD45 (C) and CD45+ (D) cells (E) in total interstitial cell population (n = 6). (E) Representative immunofluorescence images of heart sections showing staining for indicated antigens. Scale bars, 100 μm. Orthogonal slice views are shown on the right. Scale bar, 25 μm. Data from 9 to 10 biological replicates are presented. Bars represent the means ± SEM. *P < 0.05, **P < 0.01, and ***P < 0.001 by ANOVA.
Fig. 6.
Fig. 6.. Cross-disease comparison of MFCs and activated fibroblasts.
(A) Dendrogram of indicated disease conditions determined by average batch-corrected expression in MFCs. (B and C) Overlapping DE [MAST testing; Padj < 1 × 10−05; log2(fold change) > 0.5] (B) and DTU [Sierra; Padj < 0.05; log2(fold change) > 0.5] (C) genes between conditions determined by comparing MFCs to the healthy F-SH cells of the relevant dataset. (D) Comparison of log2(fold changes) comparing MFC to F-SH for AngII and MI-day 14. (E and F) Representative GO BP terms for MFC versus F-SH (E) DE or DTU (F) genes between conditions. (G and H) Read coverage plots for example DTU genes (G) Fbln1 and (H) Pabpc1 with the differential peak indicated. Shown is read coverage for F-SH from a merge of healthy hearts compared to MFC cells from the indicated conditions. (I) Dendrogram of disease conditions determined by average batch-corrected expression in F-Act. (J and K) Overlapping DE (J) and DTU (K) genes between conditions determined by comparing F-Act to the healthy F-SH cells of the relevant dataset.
Fig. 7.
Fig. 7.. Cross-species comparison of CFs between human and mouse.
(A) UMAP of human CFs with identified subclusters. (B) Dendrogram of human CF clusters determined by average integrated expression in populations. (C) Jaccard coefficients for the overlap of human and mouse CF marker genes [MAST testing; Padj < 1 × 10−05; log2(fold change) > 0.5] from uninjured hearts. (D and E) Gene expression as visualized in box and UMAP plots comparing human (top) and mouse (bottom) fibroblasts for (D) F-SH markers and (E) F-Act markers.
Fig. 8.
Fig. 8.. Localization of Pdgfra-eGFP+DPP4+ fibroblasts in myocardium vascular adventitia and interstitium.
(A) UMAP of fibroblasts from healthy hearts. Expression of select genes in different CF populations as visualized in UMAP plots is shown on the right with population identities shown on the left. (B) Sectioning outline and example of a mid-ventricular heart section of adult PdgfraeGFP/+ knockin mice stained for indicated antigens. Scale bar, 500 μm. (C and D) 9 μm Z-stack high-resolution confocal images showing staining of indicated antigens in the perivascular zone of adventitial layer of large to small vessels (C) and myocardium, epicardium, and endocardium (D). PDGFRα corresponds to nuclear eGFP fluorescence. RV, right ventricle; LV, left ventricle; RA, right atrium; LA, left atrium; SMCs, smooth muscle cells; ECs, endothelial cells (n = 2). Scale bars, 20 μm. (E) Spectrum of live fibroblasts from mouse ventricles labeled with DPP4, SCA-1, CD90.2, and CD55 antibodies, after selection for Pdgfra-eGFP+ cells. Unstained and isotype control cells were included to define the gating strategy (n = 3).
Fig. 9.
Fig. 9.. Analysis of CFs in human hearts from patients with AS and MI.
(A) UMAP of human AS CFs with identified subclusters. (B and C) Jaccard coefficients for (B) the overlap of AS fibroblast population markers with markers from fibroblasts from healthy (H) hearts and (C) the overlap of human and mouse CF marker genes from AngII and TAC hearts [MAST testing; Padj < 1 × 10−05; log2(fold change) > 0.5]. (D) Gene expression as visualized in box and UMAP plots comparing human AS fibroblasts (top) and mouse (bottom) AngII/TAC fibroblasts. (E) Representative GO BP terms overrepresented among AS fibroblast clusters. (F) UMAP of snRNA-seq–resolved human MI fibroblast populations colored by unbiased clusters. (G) Heatmap of Jaccard indices of marker genes for human MI fibroblast population clusters with mouse CF populations. (H) Dot plot displaying relative proportion of human MI fibroblast populations within each patient sample. Color and size of dots corresponds to relative proportion among the four clusters within each patient sample. (I) Spatial coordinates of Visium-resolved human MI samples, colored using bivariate color scheme corresponding to MFC and MYO scores. Only spots corresponding to the majority Fibroblast percentage are displayed. Patient samples are organized by control (left), ischemic (middle), and fibrotic (right).

References

    1. Tanay A., Regev A., Scaling single-cell genomics from phenomenology to mechanism. Nature 541, 331–338 (2017). - PMC - PubMed
    1. Rood J. E., Maartens A., Hupalowska A., Teichmann S. A., Regev A., Impact of the human cell atlas on medicine. Nat. Med. 28, 2486–2496 (2022). - PubMed
    1. Lim J., Chin V., Fairfax K., Moutinho C., Suan D., Ji H., Powell J. E., Transitioning single-cell genomics into the clinic. Nat. Rev. Genet. 24, 573–584 (2023). - PubMed
    1. Frangogiannis N. G., Cardiac fibrosis. Cardiovasc. Res. 117, 1450–1488 (2021). - PMC - PubMed
    1. Chong J. J. H., Chandrakanthan V., Xaymardan M., Asli N. S., Li J., Ahmed I., Heffernan C., Menon M. K., Scarlett C. J., Rashidianfar A., Biben C., Zoellner H., Colvin E. K., Pimanda J. E., Biankin A. V., Zhou B., Pu W. T., Prall O. W. J., Harvey R. P., Adult cardiac-resident MSC-like stem cells with a proepicardial origin. Cell Stem Cell 9, 527–540 (2011). - PMC - PubMed

Publication types