. 2024 Jun 21;10(25):eadj9173.
doi: 10.1126/sciadv.adj9173. Epub 2024 Jun 21.

Harmonized cross-species cell atlases of trigeminal and dorsal root ganglia

Affiliations

Harmonized cross-species cell atlases of trigeminal and dorsal root ganglia

Shamsuddin A Bhuiyan et al. Sci Adv. .

Erratum in

Abstract

Sensory neurons in the dorsal root ganglion (DRG) and trigeminal ganglion (TG) are specialized to detect and transduce diverse environmental stimuli to the central nervous system. Single-cell RNA sequencing has provided insights into the diversity of sensory ganglia cell types in rodents, nonhuman primates, and humans, but it remains difficult to compare cell types across studies and species. We thus constructed harmonized atlases of the DRG and TG that describe and facilitate comparison of 18 neuronal and 11 non-neuronal cell types across six species and 31 datasets. We then performed single-cell/nucleus RNA sequencing of DRG from both human and the highly regenerative axolotl and found that the harmonized atlas also improves cell type annotation, particularly of sparse neuronal subtypes. We observed that the transcriptomes of sensory neuron subtypes are broadly similar across vertebrates, but the expression of functionally important neuropeptides and channels can vary notably. The resources presented here can guide future studies in comparative transcriptomics, simplify cell-type nomenclature differences across studies, and help prioritize targets for future analgesic development.


Figures
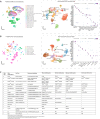
Fig. 1.
Fig. 1.. Harmonized DRG and TG neuronal atlases.
(A) Integration of DRG neuronal sc/snRNA-seq datasets. Left: Co-clustering without integration of the 21 sc/snRNA-seq datasets used in the harmonized neuronal DRG atlas. Each study’s citation is listed. Cells/nuclei are colored by study. Middle: UMAP projection of harmonized DRG neuronal atlas (75,928 cells/nuclei). Cells/nuclei are colored by their final cell type annotations in the harmonized atlas, which are named with their defining marker genes. Right: Dot plot of cell-type–specific marker gene expression. Dot size indicates the fraction of cells/nuclei expressing each gene, and color indicates average log-normalized scaled expression of each gene. (B) Integration of TG neuronal sc/snRNA-seq datasets. Left: Co-clustering without integration of the eight sc/snRNA-seq datasets used in the harmonized neuronal TG atlas. Each study’s citation is listed. Cells/nuclei are colored by study. Right: UMAP projection of harmonized TG neuronal atlas (42,350 cells/nuclei). Cells/nuclei are colored by their final cell type annotations in the harmonized atlas. Right: Dot plot of cell-type–specific marker gene expression. Dot size indicates the fraction of cells/nuclei expressing each gene, and color indicates average log-normalized scaled expression of each gene. (C) DRG/TG cell-type nomenclature. Atlas nomenclature along with fiber type, corresponding Cre-recombinase line, cutaneous physiology, and cell-type marker genes for each species. LTMR, low-threshold mechanoreceptor; HTMR, high-threshold mechanoreceptor; C-Heat, C-fiber responsive to heat stimuli; C-Cold, C-fiber responsive to cold stimuli; C-HTMR/Heat, fiber responsive to mechanical and heat stimuli.
Fig. 2.
Fig. 2.. Harmonized DRG and TG non-neuronal atlases.
(A) Harmonized DRG non-neuronal atlas. Left: Co-clustering without integration of the 23 sc/snRNA-seq datasets (dot color) used in the harmonized non-neuronal DRG atlas. Each study’s citation are listed. Middle: UMAP projection of harmonized DRG non-neuronal atlas (194,227 cells/nuclei colored by cell types). Right: Cell-type–specific marker gene expression. Dot size indicates the fraction of cells/nuclei expressing each gene, and color indicates log-normalized scaled gene expression. (B) Harmonized TG non-neuronal atlas. Left: Co-clustering without integration of the six sc/snRNA-seq datasets (dot color) used in the harmonized non-neuronal TG atlas. Each study’s citation are listed. Middle: UMAP projection of harmonized TG non-neuronal atlas (137,444 cells/nuclei colored by cell types). Right: Cell-type–specific marker gene expression. Dot size indicates the fraction of cells/nuclei expressing each gene, and color indicates average log-normalized scaled gene expression. (C) DRG immune subtypes. Left: UMAP projection of DRG immune cells/nuclei (7552 cells/nuclei). Right: Immune subtype–specific gene expression. Dot size indicates the fraction of cells/nuclei expressing each gene, and color indicates log-normalized scaled gene expression. (D) TG immune subtypes. Left: UMAP projection of TG immune cells/nuclei (5506 cells/nuclei). Right: Immune subtype–specific gene expression. Dot size indicates the fraction of cells/nuclei expressing each gene, and color indicates log-normalized scaled gene expression. (E) Immune subtype proportions. Fractions display the number of cells/nuclei for an immune subtype (bar color) out of the total number of DRG (left) or TG (right) immune cells. (F and G) Neuroimmune interactions of ligand or receptor expression in DRG/TG cell types. Dot size indicates the fraction of cells/nuclei expressing the ligand or receptor, and color indicates log-normalized gene expression. Arrows connect the cell-cell interactions of the top three LR enrichment scores and arrow thickness correspond to the enrichment score (see Materials and Methods). (F) Immune residency factors; (G) chemokine interactions.
Fig. 3.
Fig. 3.. Harmonized atlas improves cell type annotations of human DRG snRNA-seq data.
(A) Increased transcriptomic coverage of harmonized atlases compared to individual DRG and TG sc/snRNA-seq datasets. Plots display the fold increase of the average number of detected genes per cell type in the harmonized atlas compared to the average number of detected genes in the respective cell type of each individual DRG or TG sc/snRNA-seq dataset. Expression deciles, from lowest (bin 1) to highest (bin 10), are based on atlas counts matrices. Error bars represent SD. (B) Increased transcriptomic coverage of G protein–coupled receptors (GPCRs) and peptides in harmonized atlases compared to individual DRG and TG datasets. Each plot represents the number of detected GPCRs or ligands per cell type in either the harmonized atlas or individual sc/snRNA-seq datasets. Studies with multiple species were combined. (C) Human DRGs from 10 donors were sequenced at three different sites: University of Texas at Dallas (UTD), Harvard Medical School (HMS), and Washington University in St. Louis (WashU). The sequencing platforms used were either 10x Genomics 3′ RNA gene expression assay (v3.1) or 10x Genomics fixed RNA assay (FLEX). (D) Individual cell type annotation of human DRG snRNA-seq datasets. UMAP visualization of 63,950 nuclei from UTD, 24,145 nuclei from WashU, or 40,312 nuclei from HMS. Each dataset was analyzed separately. Nuclei are colored by cell type. (E) Reference-based annotation of human DRG snRNA-seq data. UMAP projection of human neuronal (left) and non-neuronal (right) data colored by institution. Cell type annotations of snRNA-seq data after anchoring to the harmonized reference atlas are circled. Nuclei with anchoring scores of >0.5 displayed (see Materials and Methods). (F) Cell types resolved after anchoring human DRG snRNA-seq data to reference atlas. Plot of the number of DRG cell types resolved from individual annotation or reference-based annotation of each human dataset.
Fig. 4.
Fig. 4.. Cell-type–specific gene expression patterns in human and mice.
(A and B) Overlap of cell-type–specific gene expression between human and mouse cell types. Displayed are the log2FC values of cell-type–specific genes (columns) of either human or mouse (log2FC > 0.5 and adjusted P value < 0.05) when comparing expression in one cell type compared to all other DRG (A) or TG (B) neuronal/non-neuronal cell types of the same species. Numbers to the left of rows (% overlap) represent the percent of human cell-type–specific genes that overlap with mouse cell-type–specific genes. Mouse cells/nuclei were downsampled to match the number of human nuclei per cell type and cell types with fewer than 15 human nuclei are not displayed. (C) LR interactions between skin, DRG neurons, and spinal cord. Predicted interactions between receptors expressed by skin, ligands expressed by DRG neurons, and receptors expressed by dorsal horn neurons (aggregated rank of <0.05; see Materials and Methods). Only interactions predicted for both humans and mice are displayed. Linewidth scaled to the largest number of interactions between skin, DRG neurons, and spinal cord. (D) LR interactions between meninges, TG neurons, and spinal trigeminal nucleus. Predicted interactions between ligands expressed by TG neurons, receptors expressed by meningeal cells (aggregated rank of <0.05; see Materials and Methods). Only interactions predicted for both humans and mice are displayed between meninges and TG neurons, however, only mouse interections are shown between TG neurons and spinal trigeminal nucleus because human data for this region is not yet available. Linewidth scaled to the largest number of interactions between meninges, TG neurons, and spinal trigeminal nucleus. NK, natural killer.
Fig. 5.
Fig. 5.. Comparison of axolotl and mammalian DRG cell types.
(A) Axolotl DRG collection schema. Cervical DRGs were collected (two animals; total of six DRGs per animal), freshly dissociated and sequenced by scRNA-seq. (B) Axolotl DRG neuronal subtypes: 1817 axolotl DRG neurons form five subtypes (colored by subtype). “AX” denotes A-fiber subtypes, and “CX” denotes C-fibers. (C) Axolotl DRG neuronal subtype–specific gene expression. Dot size indicates the fraction of cells expressing each gene, and color indicates average log-normalized scaled gene expression. (D) Comparison of axolotl and mammalian DRG neuronal subtype transcriptomes. Sankey plot displays axolotl DRG neuronal subtypes (left) and their corresponding mammalian DRG reference based annotation after anchoring to the DRG reference atlas (right). Only cells with anchoring scores of >0.5 are displayed. (E) Axolotl C-fibers often express both Trpm8 and Trpv1. Fractions display the number of C-fibers that express Trpm8 over the total number of C-fibers in axolotols or the DRG neuronal reference atlas. (F) Axolotl DRG non-neuronal subtypes: 3031 axolotl DRG non-neurons colored by cell type. (G) Axolotl DRG non-neuronal subtype–specific marker gene expression. Dot size indicates the fraction of cells expressing each gene, and color indicates average log-normalized scaled gene expression. (H) Cell-type proportions of axolotl non-neurons. Proportions displayed are a ratio of the number of axolotl non-neuronal DRG cells for a given cell type to the total number of non-neuronal cells. (I) Transcriptomic correlation of DRG cell types over evolutionary distance. For each species, the correlation between the average expression of all genes (log-normalized counts) in each cell type to the average expression of all genes in the corresponding human cell type (y axis; red triangle, median correlation), plotted against the evolutionary distance from the last common ancestor with humans [million years (Ma) ago; x axis]. Macaque species were grouped together as well as mouse and rat.

Update of

References

    1. Usoskin D., Furlan A., Islam S., Abdo H., Lönnerberg P., Lou D., Hjerling-Leffler J., Haeggström J., Kharchenko O., Kharchenko P. V., Linnarsson S., Ernfors P., Unbiased classification of sensory neuron types by large-scale single-cell RNA sequencing. Nat. Neurosci. 18, 145–153 (2015). - PubMed
    1. Kupari J., Ernfors P., Molecular taxonomy of nociceptors and pruriceptors. Pain 164, 1245–1257 (2023). - PMC - PubMed
    1. Wang K., Cai B., Song Y., Chen Y., Zhang X., Somatosensory neuron types and their neural networks as revealed via single-cell transcriptomics. Trends Neurosci. 46, 654–666 (2023). - PubMed
    1. Avraham O., Deng P.-Y., Jones S., Kuruvilla R., Semenkovich C. F., Klyachko V. A., Cavalli V., Satellite glial cells promote regenerative growth in sensory neurons. Nat. Commun. 11, 4891 (2020). - PMC - PubMed
    1. Avraham O., Feng R., Ewan E. E., Rustenhoven J., Zhao G., Cavalli V., Profiling sensory neuron microenvironment after peripheral and central axon injury reveals key pathways for neural repair. eLife 10, e68457 (2021). - PMC - PubMed

Publication types

LinkOut - more resources