. 2024 Jun 21;10(25):eadn0014.
doi: 10.1126/sciadv.adn0014. Epub 2024 Jun 21.

Olfaction regulates peripheral mitophagy and mitochondrial function

Affiliations

Olfaction regulates peripheral mitophagy and mitochondrial function

Julian G Dishart et al. Sci Adv. .

Abstract

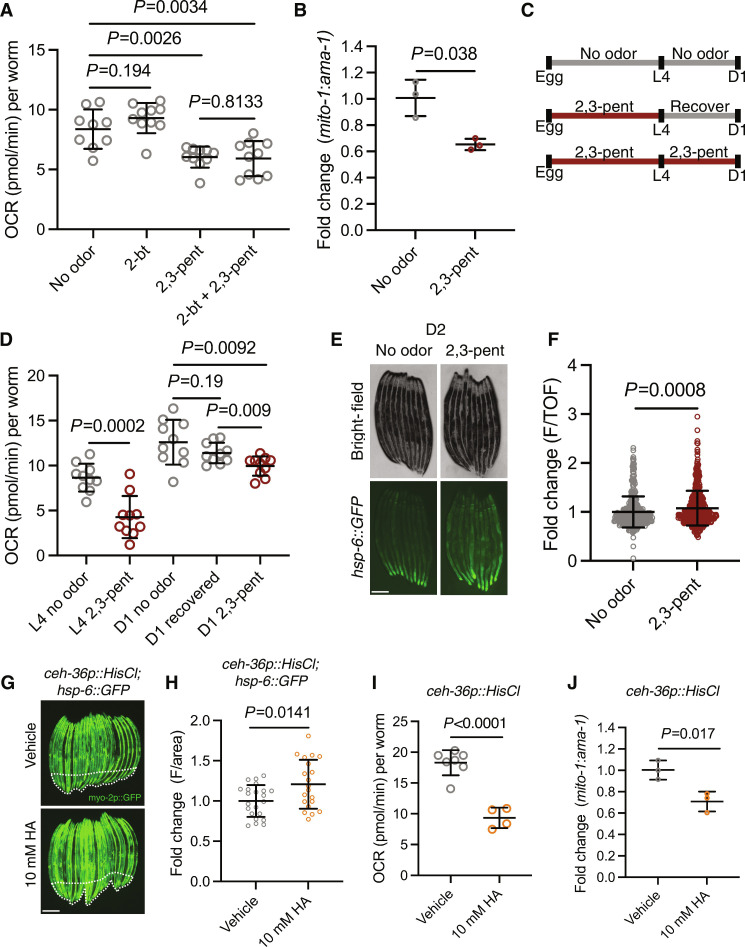
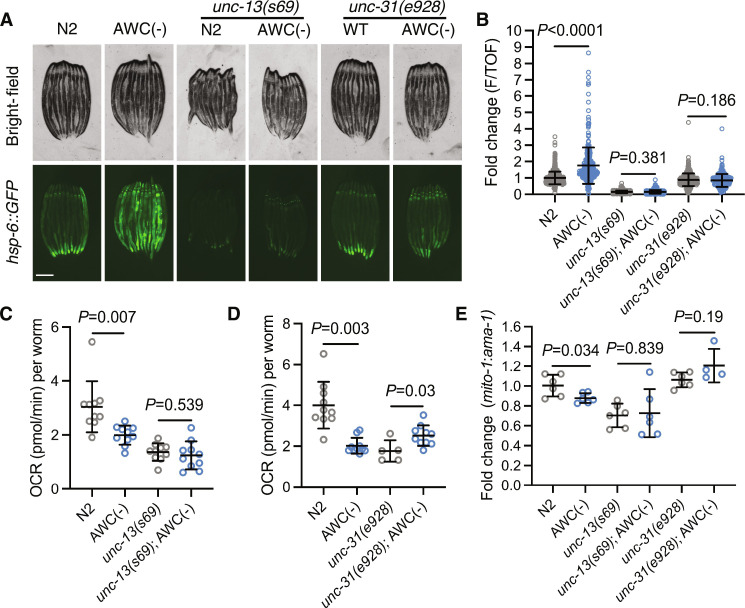
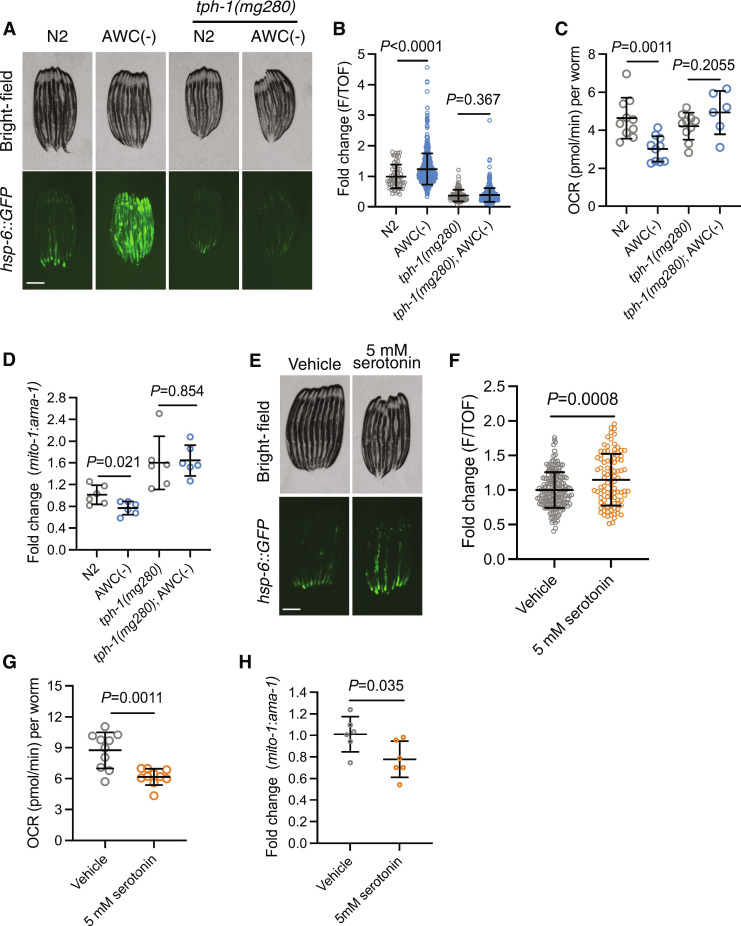
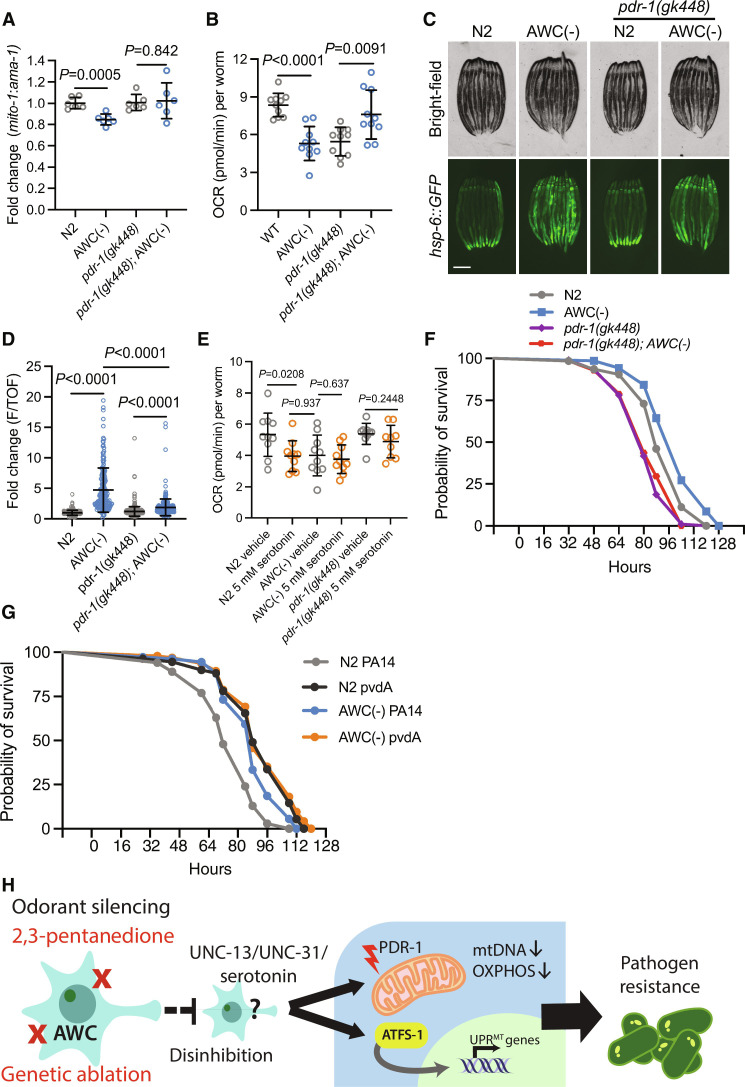
The central nervous system coordinates peripheral cellular stress responses, including the unfolded protein response of the mitochondria (UPRMT); however, the contexts for which this regulatory capability evolved are unknown. UPRMT is up-regulated upon pathogenic infection and in metabolic flux, and the olfactory nervous system has been shown to regulate pathogen resistance and peripheral metabolic activity. Therefore, we asked whether the olfactory nervous system in Caenorhabditis elegans controls the UPRMT cell nonautonomously. We found that silencing a single inhibitory olfactory neuron pair, AWC, led to robust induction of UPRMT and reduction of oxidative phosphorylation dependent on serotonin signaling and parkin-mediated mitophagy. Further, AWC ablation confers resistance to the pathogenic bacteria Pseudomonas aeruginosa partially dependent on the UPRMT transcription factor atfs-1 and fully dependent on mitophagy machinery. These data illustrate a role for the olfactory nervous system in regulating whole-organism mitochondrial dynamics, perhaps in preparation for postprandial metabolic stress or pathogenic infection.


Figures

Fig. 1.
Fig. 1.. Ablation of olfactory neuron AWC induces UPRMT, confers ATFS-1–mediated pathogen resistance, reduces OXPHOS, and depletes mtDNA content.
(A) Survival of N2, AWC(−), atfs-1(gk3094), and atfs-1(gk3094); AWC(−) on PA14. Log-rank Mantel-Cox test: N2 versus AWC (P < 0.0001); atfs-1(gk3094) versus atfs-1(gk3094); AWC(−) (P = 0.1201); AWC(−) versus atfs-1(gk3094); AWC(−) (P = 0.0027). N = 2 biological replicates. (B) Representative fluorescent images of hsp-6::GFP in N2 and AWC(−) animals. Scale bar, 250 μm. (C) Fold change of integrated fluorescence intensity [fluorescence (F)/time of flight (TOF)] measured by bioSorter of hsp-6::GFP in strains imaged in (B). Two-tailed unpaired t test with Welch’s correction. N = 3 biological replicates. (D) OCR in N2 without (basal) and with FCCP (maximal). Two-tailed unpaired t test with Welch’s correction. N = 3 biological replicates. (E) Log2 fold change of the ratio of mito-1 to ama-1 in AWC(−) normalized to N2, measured by qPCR. Two-tailed unpaired t test with Welch’s correction. N = 6 biological replicates. (F) OCR in N2, AWC(−), atfs-1(gk3094), and atfs-1(gk3094); AWC(−). Two-tailed unpaired t test with Welch’s correction. N = 2 biological replicates. (G) Log2 fold change of the ratio of mito-1 to ama-1 in AWC(−), atfs-1(gk3094), and atfs-1(gk3094); AWC(−) normalized to N2, measured by qPCR. Two-tailed unpaired t test with Welch’s correction. N = 6 biological replicates.
Fig. 2.
Fig. 2.. Odorant and genetic silencing of AWC neurons activates UPRMT, reduces OXPHOS, and depletes mtDNA content.
(A) OCR in N2 treated with no odor, 2-butanone (2-bt), 2,3-pentanedione (2,3-pent), and 2-bt and 2,3-pent. Two-tailed unpaired t test with Welch’s correction. N = 2 biological replicates. (B) Log2 fold change of the ratio of mito-1 to ama-1 in N2 treated with 2,3-pent normalized to untreated N2, measured by qPCR. Two-tailed unpaired t test with Welch’s correction. N = 3 biological replicates. (C) Schematic of recovery assay. (D) OCR in control and 2,3-pent treatment at L4, and in control, 24-hour 2,3-pent recovery, and chronic 2,3-pent exposure at D1. Two-tailed unpaired t test with Welch’s correction. N = 2 biological replicates. (E) Representative fluorescent images of hsp-6::GFP in no odor– and 2,3-pent–treated animals. Scale bar, 250 μm. (F) Fold change of integrated fluorescence intensity (F/TOF) measured by bioSorter of hsp-6::GFP in conditions imaged in (E). Two-tailed unpaired t test with Welch’s correction. N = 2 biological replicates. (G) Representative fluorescent images of ceh-36p::HisCl; hsp-6::GFP in HA-treated and untreated animals. Body-wall muscle GFP is delineated by dashed lines. Scale bar, 250 μm. (H) Fold change of average fluorescence/area of distal intestine (excluding body-wall muscle GFP) imaged in (G), measured by FIJI. Two-tailed unpaired t test with Welch’s correction. N = 2 biological replicates. (I) OCR in HA untreated and HA-treated ceh-36p::HisCl animals. Two-tailed unpaired t test with Welch’s correction. N = 2 biological replicates. (J) Log2 fold change of the ratio of mito-1 to ama-1 in ceh-36p::HisCl treated with HA, normalized to untreated ceh-36p::HisCl. Two-tailed unpaired t test with Welch’s correction. N = 3 biological replicates.
Fig. 3.
Fig. 3.. Ablation of AWC neurons remodels peripheral mitochondria dependent on neurotransmission.
(A) Representative fluorescent images of hsp-6::GFP in N2, AWC(−), unc-13(s69), AWC(−); unc-13(s69), unc-31(e928), and AWC(−); unc-31(e928) animals. Scale bar, 250 μm. (B) Fold change of integrated fluorescence intensity (F/TOF) measured by bioSorter of hsp-6::GFP in strains imaged in (A). Two-tailed unpaired t test with Welch’s correction. N = 2 biological replicates. (C) OCR in N2, AWC(−), unc-13(s69), and AWC(−); unc-13(s69). Two-tailed unpaired t test with Welch’s correction. N = 2 biological replicates. (D) OCR in N2, AWC(−), unc-31(e928), and AWC(−); unc-31(e928) animals. Two-tailed unpaired t test with Welch’s correction. N = 3 biological replicates. (E) Log2 fold change of the ratio of mito-1 to ama-1 in AWC(−), unc-13(s69), AWC(−); unc-13(s69), unc-31(e928), and AWC(−); unc-31(e928) animals normalized to N2, measured by qPCR. Two-tailed unpaired t test with Welch’s correction. N = 4 to 6 biological replicates.
Fig. 4.
Fig. 4.. Ablation of AWC neurons remodels peripheral mitochondria dependent on serotonergic signaling.
(A) Representative fluorescent images of hsp-6::GFP in N2, AWC(−), tph-1(mg280), and AWC(−); tph-1(mg280) animals. Scale bar, 250 μm. (B) Fold change of integrated fluorescence intensity (F/TOF) measured by bioSorter of hsp-6::GFP in strains imaged in (A). Two-tailed unpaired t test with Welch’s correction. N = 2 biological replicates. (C) OCR in N2, AWC(−), tph-1(mg280), and AWC(−); tph-1(mg280) animals. Two-tailed unpaired t test with Welch’s correction. N = 2 biological replicates. (D) Log2 fold change of the ratio of mito-1 to ama-1 in AWC(−), tph-1(mg280), and AWC(−); tph-1(mg280) animals normalized to N2, measured by qPCR. Two-tailed unpaired t test with Welch’s correction. N = 6 biological replicates. (E) Representative fluorescent images of hsp-6::GFP in N2 treated with vehicle or 5 mM serotonin. Scale bar, 250 μm. (F) Fold change of average fluorescence/area of conditions imaged in (E), measured by FIJI. Two-tailed unpaired t test with Welch’s correction. N = 2 biological replicates. (G) OCR in N2 treated with vehicle or 5 mM serotonin. Two-tailed unpaired t test with Welch’s correction. N = 2 biological replicates. (H) Log2 fold change of the ratio of mito-1 to ama-1 in N2 treated with 5 mM serotonin normalized to vehicle-treated N2, measured by qPCR. Two-tailed unpaired t test with Welch’s correction. N = 6 biological replicates.
Fig. 5.
Fig. 5.. Ablation of AWC activates UPRMT partially dependent on PDR-1 and reduces OCR and mtDNA levels fully dependent on PDR-1.
(A) Log2 fold change of the ratio of mito-1 to ama-1 in AWC(−), pdr-1(gk448), and pdr-1(gk448); AWC(−) animals normalized to N2, measured by qPCR. Two-tailed unpaired t test with Welch’s correction. N = 6 biological replicates. (B) OCR in N2, AWC(−), pdr-1(gk448), and pdr-1(gk448); AWC(−) animals. Two-tailed unpaired t test with Welch’s correction. N = 3 biological replicates. (C) Representative fluorescent images of hsp-6::GFP in N2, AWC(−), pdr-1(gk448), and pdr-1(gk448); AWC(−) animals. Scale bar, 250 μm. (D) Fold change of integrated fluorescence intensity (F/TOF) measured by bioSorter of hsp-6::GFP in strains imaged in (C). Two-tailed unpaired t test with Welch’s correction. N = 2 biological replicates. (E) OCR in N2, AWC(−), and pdr-1(gk448) treated with vehicle or 5 mM serotonin. Welch’s correction. N = 2 biological replicates. (F) Survival of N2, AWC(−), pdr-1(gk448), and pdr-1(gk448); AWC(−) animals on PA14. Log-rank Mantel-Cox test: N2 versus AWC(−) (P = 0.0028); pdr-1(gk448) versus pdr-1(gk448); AWC(−) (P = 0.9068); AWC(−) versus pdr-1(gk448); AWC(−) (P < 0.0001). N = 2 biological replicates. (G) Survival of N2 and AWC(−) on PA14 and PA14 mutant pvdA. Log-rank Mantel-Cox test: N2 PA14 versus AWC(−) PA14 (P < 0.0001); N2 pvdA versus AWC(−) pvdA (P = 0.3590); AWC(−) PA14 versus AWC(−) pvdA (P = 0.1129). N = 2 biological replicates. (H) Summary schematic.

References

    1. Taylor R. C., Dillin A., XBP-1 is a cell-nonautonomous regulator of stress resistance and longevity. Cell 153, 1435–1447 (2013). - PMC - PubMed
    1. Douglas P. M., Baird N. A., Simic M. S., Uhlein S., McCormick M. A., Wolff S. C., Kennedy B. K., Dillin A., Heterotypic signals from neural HSF-1 separate thermotolerance from longevity. Cell Rep. 12, 1196–1204 (2015). - PMC - PubMed
    1. Durieux J., Wolff S., Dillin A., The cell-non-autonomous nature of electron transport chain-mediated longevity. Cell 144, 79–91 (2011). - PMC - PubMed
    1. Berendzen K. M., Durieux J., Shao L.-W., Tian Y., Kim H.-E., Wolff S., Liu Y., Dillin A., Neuroendocrine coordination of mitochondrial stress signaling and proteostasis. Cell 166, 1553–1563.e10 (2016). - PMC - PubMed
    1. Chen L.-T., Lin C.-T., Lin L.-Y., Hsu J.-M., Wu Y.-C., Pan C.-L., Neuronal mitochondrial dynamics coordinate systemic mitochondrial morphology and stress response to confer pathogen resistance in C. elegans. Dev. Cell 56, 1770–1785.e12 (2021). - PubMed

Publication types

MeSH terms