. 2024 Aug 13;8(15):4129-4143.
doi: 10.1182/bloodadvances.2023012426.

Neurobeachin regulates hematopoietic progenitor differentiation and survival by modulating Notch activity

Affiliations

Neurobeachin regulates hematopoietic progenitor differentiation and survival by modulating Notch activity

Miguel Ganuza et al. Blood Adv. .

Abstract

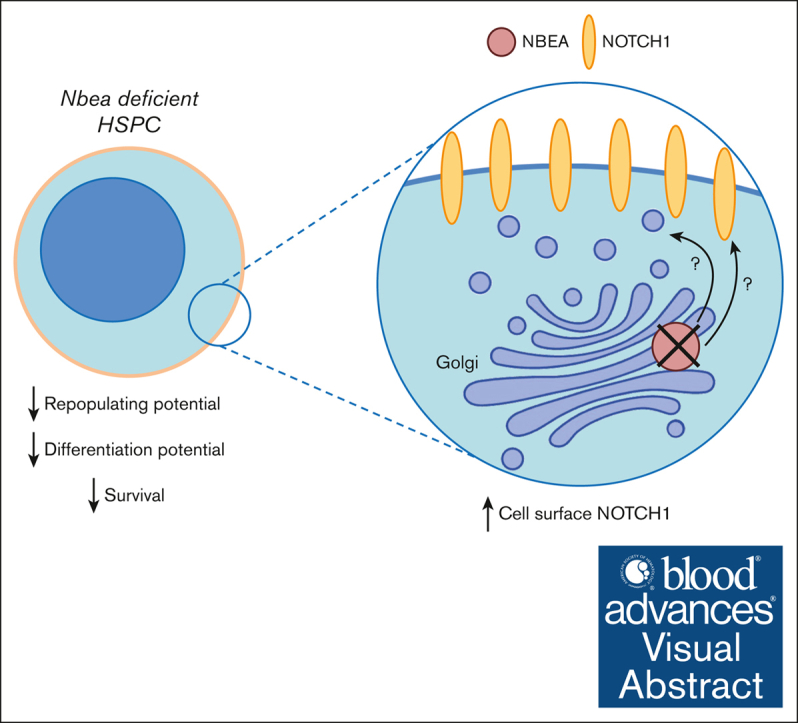
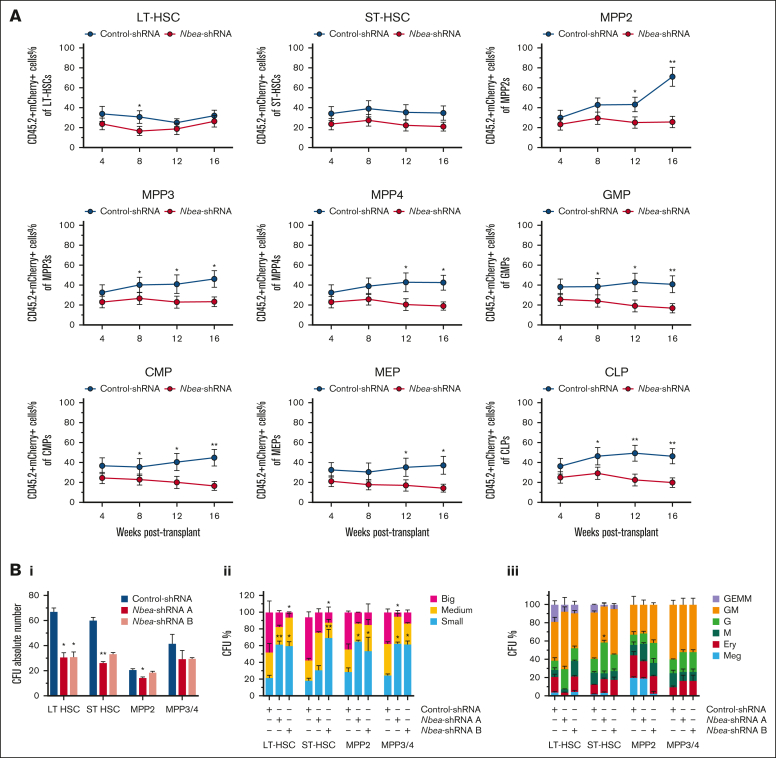
Hematopoietic stem cells (HSCs) can generate all blood cells. This ability is exploited in HSC transplantation (HSCT) to treat hematologic disease. A clear understanding of the molecular mechanisms that regulate HSCT is necessary to continue improving transplant protocols. We identified the Beige and Chediak-Higashi domain-containing protein (BDCP), Neurobeachin (NBEA), as a putative regulator of HSCT. Here, we demonstrated that NBEA and related BDCPs, including LPS Responsive Beige-Like Anchor Protein (LRBA), Neurobeachin Like 1 (NBEAL1) and Lysosomal Trafficking Regulator (LYST), are required during HSCT to efficiently reconstitute the hematopoietic system of lethally irradiated mice. Nbea knockdown in mouse HSCs induced apoptosis and a differentiation block after transplantation. Nbea deficiency in hematopoietic progenitor cells perturbed the expression of genes implicated in vesicle trafficking and led to changes in NOTCH receptor localization. This resulted in perturbation of the NOTCH transcriptional program, which is required for efficient HSC engraftment. In summary, our findings reveal a novel role for NBEA in the control of NOTCH receptor turnover in hematopoietic cells and supports a model in which BDCP-regulated vesicle trafficking is required for efficient HSCT.


Conflict of interest statement

Conflict-of-interest disclosure: The authors declare no competing financial interests.

Figures

None
Graphical abstract
Figure 1.
Figure 1.
Nbea is a positive regulator of HSPC repopulating activity. (A) qRT-PCR of Nbea expression in hematopoietic cells from adult BM, including HSC (LineageSCA-1+c-KIT+[LSK]CD150+CD48); MPPs (LSKCD150+CD48+ [MPP2] and LSKCD150CD48+ [MPP3/4]); common myeloid progenitors (CMPs; LineageSCA-1c-KIT+CD32/16LowCD34+); common lymphoid progenitors (CLPs; Lineagec-KitmedSca-1medCD127+); megakaryocyte-erythroid progenitors (MEPs; LineageSCA-1c-KIT+CD32/16CD34); granulocyte-myeloid progenitors (GMPs; LineageSCA-1c-KIT+CD32/16CD34); granulocytes, (GR-1+), B cells (B220+), and T cells (CD3+). (B) CD45.2+ “test” BM-HSPCs were transduced with control or Nbea-shRNAs. mCherry+ cells were then sorted and transplanted along with mock-transduced CD45.1+ HSPCs at a 1:1 ratio into lethally irradiated CD45.1+/CD45.2+ recipients within 44 hours after isolation. Recipient PB was examined for >16 weeks after transplant by flow cytometry for CD45.2+ mCherry+ cells. (Bi) Schematic of competitive transplantation of Nbea-deficient BM-HSPCs. (Bii) Percentage of CD45.2+mCherry+ PB at 4 to 16 weeks after transplant. (Biii) Frequency of CD45.2+mCherry+ PB lineages at 4 to 16 weeks after transplant. (Biv) Contribution of CD45.2+mCherry+ progenitors to BM progenitors. Data in panel B are from 3 experiments; 5 mice per condition per transplant. Data are represented as mean ± standard error of the mean (SEM). ∗P < .05; ∗∗P < .005; ∗∗∗P < .001, relative to recipients of control-shRNA HSPCs.
Figure 2.
Figure 2.
Nbea is required for the survival and proper differentiation of HSPC after transplantation. (A) Contribution of CD45.2+mCherry+ cells to recipient BM HSPCs over time after transplant, following the same experimental schematic as in Figure 1B. (B) CFU potential of mCherry+ HSPCs recovered from transplant recipients at 10 weeks after transplant. (Bi) Total CFUs. (Bii) Frequency of CFUs by size. (Biii) Frequency of CFU subtype. (C) Annexin V levels in CD45.2+mCherry+ cells in recipient BM HSPCs over time after transplant. All data are from 3 independent transplants with 5 mice per condition per transplant. Data are represented as mean ± SEM. ∗P < .05; ∗∗P < .005; ∗∗∗P < .001, relative to recipients of control-shRNA HSPCs. Ery, erythroid; G, granulocyte; M, monocyte; GM, granulocyte/monocyte; GEMM, granulocyte, erythrocyte, monocyte, and megakaryocyte.
Figure 2.
Figure 2.
Nbea is required for the survival and proper differentiation of HSPC after transplantation. (A) Contribution of CD45.2+mCherry+ cells to recipient BM HSPCs over time after transplant, following the same experimental schematic as in Figure 1B. (B) CFU potential of mCherry+ HSPCs recovered from transplant recipients at 10 weeks after transplant. (Bi) Total CFUs. (Bii) Frequency of CFUs by size. (Biii) Frequency of CFU subtype. (C) Annexin V levels in CD45.2+mCherry+ cells in recipient BM HSPCs over time after transplant. All data are from 3 independent transplants with 5 mice per condition per transplant. Data are represented as mean ± SEM. ∗P < .05; ∗∗P < .005; ∗∗∗P < .001, relative to recipients of control-shRNA HSPCs. Ery, erythroid; G, granulocyte; M, monocyte; GM, granulocyte/monocyte; GEMM, granulocyte, erythrocyte, monocyte, and megakaryocyte.
Figure 3.
Figure 3.
Lrba, Lyst, and Nbeal1 are positive regulators of BM-HSPC engraftment. (A) qRT-PCR of Nbea, Lrba, Lyst, Nbeal1, Nbeal2, Wdfy3, and Wdfy4 mRNA expression in the hematopoietic hierarchy of adult BM. (B) qRT-PCR of Nbea, Lrba, Lyst, Nbeal1, Nbeal2, Wdfy3, and Wdfy4 expression in Nbea+/+ and Nbea–/– E14.5 FL-HSCs. (C-E) Nbea+/+ and Nbea−/− CD45.2+ HSPCs recovered from CD45.1+/CD45.2+ recipients of E14.5- CD45.2+ FL-HSPCs 4 months after transplant were transduced with shRNAs targeting Lrba, Lyst, Nbeal1, or Nbeal2 and transplanted together with CD45.1+ HSPCs into CD45.1+/CD45.2+ (ratio 3:2). (C) Experimental schematic. (D) Percentage of mCherry+CD45.2+ PB after transplant of recipients of shRNA treated cells normalized to the average of control recipients. (E) Percentage of mCherry+CD45.2+ chimerism in the BM HSPCs at 20 weeks after transplant. Data are represented as mean ± SEM. ∗/#/•/∇P < .05; ∗∗/##/••/∇∇P < .005; ∗∗∗/###/•••/∇∇∇P < .001, relative to recipients of control-shRNA HSPCs. ∗ refers to Lrba-shRNA; # refers to Nbeal1-shRNA; • refers to Nbeal2-shRNA; and ∇ refers to Lyst-shRNA.
Figure 4.
Figure 4.
Nbea deficiency affects vesicle trafficking components at the transcriptional level. (A-B) Control and Nbea-shRNA–treated progenitors were transplanted into lethally irradiated recipients. mCherry+ cells were recovered from transplanted mice 10 weeks after transplant and subjected to bulk RNA sequencing. (A) Experimental schematic. (B) Pathway analysis based on transcriptional differences among control and Nbea-shRNA–treated progenitors in (i) biological processes and (ii) cellular components. Differences related to vesicle trafficking highlighted with an arrow. (C-D) E14.5 FL LT-HSCs were isolated from Nbea+/+ and Nbea–/ – embryos and subjected to bulk RNA sequencing. (C) Experimental schematic. (D) Pathway analysis including (i) biological processes and (ii) cellular components showing differences among Nbea+/+ and Nbea–/– E14.5 FL LT-HSCs. (E) Representative confocal images of BM HSC and NBEA/RCAS1 colocalization analysis (Pearson correlation coefficient). NBEA-A488 shown in green, RCAS1-A647 (Golgi) in red, and nuclei (DAPI) in blue. (F) qPCR analysis of NOTCH-regulated genes in E14.5 FL-HSC in Nbea+/+ and Nbea–/–. Data in panel B are from 2 independent samples. Data in panel D are from 1 sample. Data in panel F are from 3 samples, represented as mean ± SEM. ∗P < .05; ∗∗P < .005, relative Nbea+/+.
Figure 5.
Figure 5.
NBEA deficiency perturbs NOTCH proteins expression and cell localization. (A) Representative images of OPM2 cell lines expressing different NBEA-shRNAs (1 and 2) and control-shRNA. Transduced OPM2 cells for each shRNA were sorted based on mCherry+ expression. (B) Cell growth curves for OPM2 transduced cells. (C) Annexin V analysis in control- and NBEA-shRNA OPM2 cells. Percentage of annexin V+ cells is shown. (D-G) NOTCH1 and NOTCH2 cell surface and total expression in OPM2 transduced cells. (D) Experimental schematic. (E) Flow cytometry histograms showing NOTCH1 and NOTCH2 protein levels in the cell surface and total expression for each OPM2 cell line. (F) Quantification of NOTCH1 and NOTCH2 protein levels normalized to control-shRNA. (G) Ratio of cell surface and total levels of NOTCH1 and NOTCH2. (H) qRT-PCR analysis of NOTCH-regulated genes in OPM2 cell lines. Data are represented as mean ± SEM. ∗P < .05; ∗∗P < .005; ∗∗∗P < .001, relative to control-shRNA. ∗ refers to NBEA-shRNA 1; # refers to NBEA-shRNA 2. Ab, antibody.

References

    1. Ganuza M, McKinney-Freeman S. Hematopoietic stem cells under pressure. Curr Opin Hematol. 2017;24(4):314–321. - PMC - PubMed
    1. Purton LE. Adult murine hematopoietic stem cells and progenitors: an update on their identities, functions, and assays. Exp Hematol. 2022;116:1–14. - PubMed
    1. Rydstrom A, Grahn THM, Niroula A, et al. Functional and molecular profiling of hematopoietic stem cells during regeneration. Exp Hematol. 2023;127:40–51. - PubMed
    1. Sanchez-Lanzas R, Kalampalika F, Ganuza M. Diversity in the bone marrow niche: classic and novel strategies to uncover niche composition. Br J Haematol. 2022;199(5):647–664. - PMC - PubMed
    1. Holmfeldt P, Ganuza M, Marathe H, et al. Functional screen identifies regulators of murine hematopoietic stem cell repopulation. J Exp Med. 2016;213(3):433–449. - PMC - PubMed

Publication types