. 2024 Aug:177:116991.
doi: 10.1016/j.biopha.2024.116991. Epub 2024 Jun 21.

Novel selective inhibitors of macropinocytosis-dependent growth in pancreatic ductal carcinoma

Affiliations

Novel selective inhibitors of macropinocytosis-dependent growth in pancreatic ductal carcinoma

Silvia Brambillasca et al. Biomed Pharmacother. 2024 Aug.

Abstract

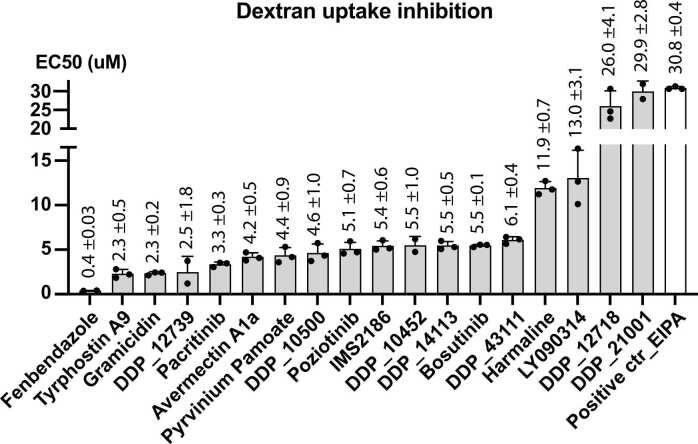
Macropinocytosis is a cellular process that enables cells to engulf extracellular material, such as nutrients, growth factors, and even whole cells. It is involved in several physiological functions as well as pathological conditions. In cancer cells, macropinocytosis plays a crucial role in promoting tumor growth and survival under nutrient-limited conditions. In particular KRAS mutations have been identified as main drivers of macropinocytosis in pancreatic, breast, and non-small cell lung cancers. We performed a high-content screening to identify inhibitors of macropinocytosis in pancreatic ductal adenocarcinoma (PDAC)-derived cells, aiming to prevent nutrient scavenging of PDAC tumors. The screening campaign was conducted in a well-known pancreatic KRAS-mutated cell line (MIAPaCa-2) cultured under nutrient deprivation and using FITC-dextran to precisely quantify macropinocytosis. We assembled a collection of 3584 small molecules, including drugs approved by the Food and Drug Administration (FDA), drug-like molecules against molecular targets, kinase-targeted compounds, and molecules designed to hamper protein-protein interactions. We identified 28 molecules that inhibited macropinocytosis, with potency ranging from 0.4 to 29.9 μM (EC50). A few of them interfered with other endocytic pathways, while 11 compounds did not and were therefore considered specific "bona fide" macropinocytosis inhibitors and further characterized. Four compounds (Ivermectin, Tyrphostin A9, LY2090314, and Pyrvinium Pamoate) selectively hampered nutrient scavenging in KRAS-mutated cancer cells. Their ability to impair albumin-dependent proliferation was replicated both in different 2D cell culture systems and 3D organotypic models. These findings provide a new set of compounds specifically targeting macropinocytosis, which could have therapeutic applications in cancer and infectious diseases.

Keywords: Drug repurposing; Drug screening; FDA-approved drugs; Ivermectin (PubChem CID: 6321424); LY2090314 (PubChem CID: 10029385); Macropinocytosis; Pancreatic ductal adenocarcinoma (PDAC); Pyrvinium Pamoate (PubChem CID: 54680693); Tyrphostin A9 (PubChem CID: 5614).


Conflict of interest statement

Declaration of Competing Interest The authors declare that they have no competing interests.

Figures

None
Created with BioRender.com
Fig. 1
Fig. 1
: Identification of new macropinocytosis inhibitors from a library of bioactive compounds.(A) Representative images of macropinocytosis uptake in MIAPaCa-2 cells, in control conditions (DMSO: negative control; EIPA: positive control, 75uM). Dextran-FITC was used as a marker of macropinosomes. Scale bar: 20 μm. Quantification of macropinocytosis as described in (A), relative to the values of DMSO negative control (as SpotDensity parameter); data are reported as mean ± SD for n=6 (DMSO) or n=3 (EIPA) biological replicates with at least 600 cells scored per condition; ****p≤0.0001 by unpaired two-tailed Student’s t-test. MP= macropinocytosis. (B) Results distribution from primary screening, depicting SpotDensity parameter at 10uM of compound; each spot represents the activity of a single compound, reported as z-score after normalization on negative (DMSO, light blue) and positive control (no dye, grey); 75uM EIPA was included in all plates as additional positive control (yellow); highlighted as candidate hits (magenta) are compounds scoring above the threshold (z-score=3) also at 2uM and/or 50uM.
Fig. 2
Fig. 2
: Inhibition efficacy of selected macropinocytosis inhibitors. EC50 values were determined via dextran uptake assay in MIAPaCa-2 cells, following SpotDensity parameter. Dose-response curves were obtained plotting inhibitors activity as percentage of dextran uptake relative to the DMSO control; the effect of EIPA is reported as a reference (white bar). EC50 values are reported as mean ± SD, n=3 biological replicates (n=2 for Fenbendazole, DDP_12739, DDP_10452 and DDP_21001).
Fig. 3
Fig. 3
: Selectivity of identified inhibitors. (A) Effect of selected inhibitors on clathrin-mediated endocytosis. MIAPaCa-2 cells were challenged with the indicated inhibitors (each at their EC50) and the extent of human Transferrin-Alexa633 internalization was obtained by image analysis upon microscopy imaging; the quantified CellMeanSignal for each compound was reported relative to the vehicle-treated control (DMSO). Dynole and Chlorpromazine were included as positive controls of Clathrin-mediated endocytosis inhibition (black bars); EIPA was included as negative control (white bar). Yellow arrowheads highlight compounds inhibiting more than 15 % the Transferrin uptake. Data are presented as mean ± SD; n=6 (Dynole, Chlorpromazine, EIPA), n=3 (Fenbendazole, DDP_12739, DDP_14113 and LY090314), n=2 (all remaining compounds) as biological replicates, with at least 450 cells scored per condition. (B) Representative images of human-Transferrin uptake assay described in (A); hTRSF-Alxa633 intracellular signal was quantified for each cell. Scale bar: 20 μm.
Fig. 4
Fig. 4
: Inhibitors impairment of BSA-dependent proliferation in nutrient-limiting conditions. (A) Proliferation of MIAPaCa-2 and BxPC-3 cells (respectively blue and grey) after 96 h of growth in starvation conditions (low serum/low glutamine) ± 4 % BSA and EIPA (50uM). Data are reported as relative to the cell number at the beginning of starvation, on the day after seeding. Values are mean ± SEM of n≥11 independent experiments performed in triplicates. (B) Effect of inhibitors on BSA-dependent proliferation during starvation, in MIAPaCa-2 and BxPC-3 cell lines (blue and grey, respectively). Data are expressed as percentage of growth after 96 h compared to DMSO-treated cells in starvation +4 % BSA. These compounds showed equal activity between the two cell lines. (C) Differential activity of inhibitors in MIAPaCa-2 versus BxPC-3 cells, experimental conditions as described in (B). In all panels, where not differently indicated, values are mean ±SEM of n≥3 independent experiments performed in triplicates. *p≤0.05, **p≤0.01, ***p≤0.001, ****p≤0.0001 by one-way ANOVA with Bonferroni post-hoc test; multiple comparisons for each cell line and each inhibitor performed separately, relative to DMSO control; n.s., not significant.
Fig. 5
Fig. 5
Chemical structures of selected compounds showing activity on MIAPaCa-2 cells.
Fig. 6
Fig. 6
:Performance of dextran uptake inhibition in different macropinocytic cell lines. (A) Representative images of dextran uptake assay on PANC-1 and MDA-MB-231 cells, respectively pancreatic and breast cancer cell lines. Cells were pre-incubated for 3 hours with DMSO or EIPA (75uM) prior to addition of dextran-FITC. Quantification of macropinocytosis was evaluated on SpotDensity parameter and is reported relative to the DMSO condition; data are reported as mean ± SD for n=6 (DMSO) or n=3 (EIPA) biological replicates with at least 400 cells scored per condition; ****p≤0.0001 by unpaired two-tailed Student’s t-test. MP= macropinocytosis. Scale bar: 20 μm. (B) EC50 concentration for dextran uptake inhibition was obtained for the three cell lines, following SpotDensity parameter. Dose-response curves were obtained plotting inhibitors activity as percentage of dextran uptake relative to the DMSO control in each cell line; EC50 values were calculated using Prism software and are reported as mean ± SD, n=3 biological replicates (n=2 for Tryphostin A9 in PANC-1 and MDA-MD-231 cells). It was not possible to determine the EC50 value for the compound LY2090314 in PANC-1 cells, due to an inhibition greater than 50 % even at the lowest tested dose (0.19uM, #).
Fig. 7
Fig. 7
:Inhibitors effect on BSA-dependent proliferation of PANC-1 cells. (A) Proliferation of PANC-1 cells after 96 h of growth in starvation conditions (low serum/low glutamine) ± 4 % BSA and EIPA (50uM). Data are reported as relative to the cell number at the beginning of starvation, on the day after seeding. Values are mean ± SEM of n=10 independent experiments performed in triplicates. ***p≤0.001, ****p≤0.0001 by one-way ANOVA with Bonferroni post-hoc test. (B) Effect of inhibitors on BSA-dependent proliferation during starvation in PANC-1 cells. Data are expressed as percentage of growth after 96 h compared to DMSO-treated cells in starvation +4 % BSA. Values are mean ±SEM of n≥3 independent experiments performed in triplicates. *p≤0.05, **p≤0.01, ***p≤0.001, ****p≤0.0001 by one-way ANOVA with Bonferroni post-hoc test; multiple comparisons for each inhibitor performed separately, relative to DMSO control.
Fig. 8
Fig. 8
:Impact of GSK3 interference on dextran uptake in MIAPaCa-2 cells. (A) Representative images of dextran-FITC uptake upon MIAPaCa-2 cells transfection with control or GSK3-siRNA. Quantification of macropinocytosis was performed using the ’Analyze Particles’ feature in ImageJ, counting the total SpotNumber and the total SpotArea in a given field and dividing for the total cell nuclei in the corresponding field. Data are reported as relative to the control-siRNA condition; values are mean ± SD of n=6 biological replicates, with a minimum of 12 fields each; **p≤0.01, ***p≤0.001 by unpaired two-tailed Student’s t-test. MP= macropinocytosis. Scale bar: 20 μm. (B) qRT-PCR analysis showing transcript levels for GSK3 α and β isoforms upon siRNA transfection. Data are reported as Calibrated Normalized Relative Quantity compared to control-siRNA. Values are mean ± SEM of n=4 biological replicates performed in triplicates. ***p≤0.001, ****p≤0.0001 by unpaired two-tailed Student’s t-test.
Fig. 9
Fig. 9
:Effect of macropinocytosis inhibitors on organotypic 3D culture growth. (A) Representative images showing evident morphological differences of MIAPaCa-2 spheroids generated after 4 days in culture with or without Cancer Associated Fibroblasts (CAF). Brightfield images were taken at Operetta with 5x air objective. Scale bar: 200 μm. (B) Spheroids viability was assessed by Acid Phosphatase Assay (APH). Pre-formed spheroids were incubated with the inhibitors for 6 days, in starvation conditions (low serum/no glutamine) in the presence of BSA. To monitor the BSA-rescue effect, DMSO control in starvation without BSA supplementation was included (white bar). Data are expressed as compared to viability of DMSO control+BSA. (C) Spheroids cell death was assessed by Lactate Dehydrogenase (LDH) cytotoxicity assay. Upon inhibitors incubation as described in (B), a fraction of the supernatant was collected to measure the LDH protein release due to cell death. Data are expressed as compared to LDH release in DMSO control+BSA condition. In both panels values are mean ± SEM with n=6 (DMSO) or n=3 independent experiments with at least 3 technical replicates. *p≤0.05, **p≤0.01, ***p≤0.001 by unpaired two-tailed Student’s t-test; n.s., not significant. (D) Representative images of spheroids generated with MIAPaCa-2 cells constitutively expressing H2B-EGFP marker and CAF cells. Images were taken in Brightfield and FITC channel at 5x, after 6 days of treatment as in (B) and (C). Quantification of total EGFP signal intensity is reported relative to the DMSO condition; data are reported as mean ± SD for minimum n=3 biological replicates; **p≤0.01, ***p≤0.001, ****p≤0.0001 by unpaired two-tailed Student’s t-test. Scale bar: 200 μm.

References

    1. Kerr M.C., Teasdale R.D. Defining macropinocytosis. Traffic. 2009;10(4):364–371. - PubMed
    1. Swanson J.A. Shaping cups into phagosomes and macropinosomes. Nat. Rev. Mol. Cell Biol. 2008;9(8):639–649. - PMC - PubMed
    1. Palm W. Metabolic functions of macropinocytosis. Philos. Trans. R. Soc. Lond. B Biol. Sci. 2019;374(1765):20180285. - PMC - PubMed
    1. Zeineddine R., Yerbury J.J. The role of macropinocytosis in the propagation of protein aggregation associated with neurodegenerative diseases. Front Physiol. 2015;6:277. - PMC - PubMed
    1. Doodnauth S.A., Grinstein S., Maxson M.E. Constitutive and stimulated macropinocytosis in macrophages: roles in immunity and in the pathogenesis of atherosclerosis. Philos. Trans. R. Soc. Lond. B Biol. Sci. 2019;374(1765):20180147. - PMC - PubMed

MeSH terms

Substances