. 2024 Jun 20;84(12):2320-2336.e6.
doi: 10.1016/j.molcel.2024.04.011.

2'-O-methylation at internal sites on mRNA promotes mRNA stability

Affiliations

2'-O-methylation at internal sites on mRNA promotes mRNA stability

Yanqiang Li et al. Mol Cell. .

Abstract

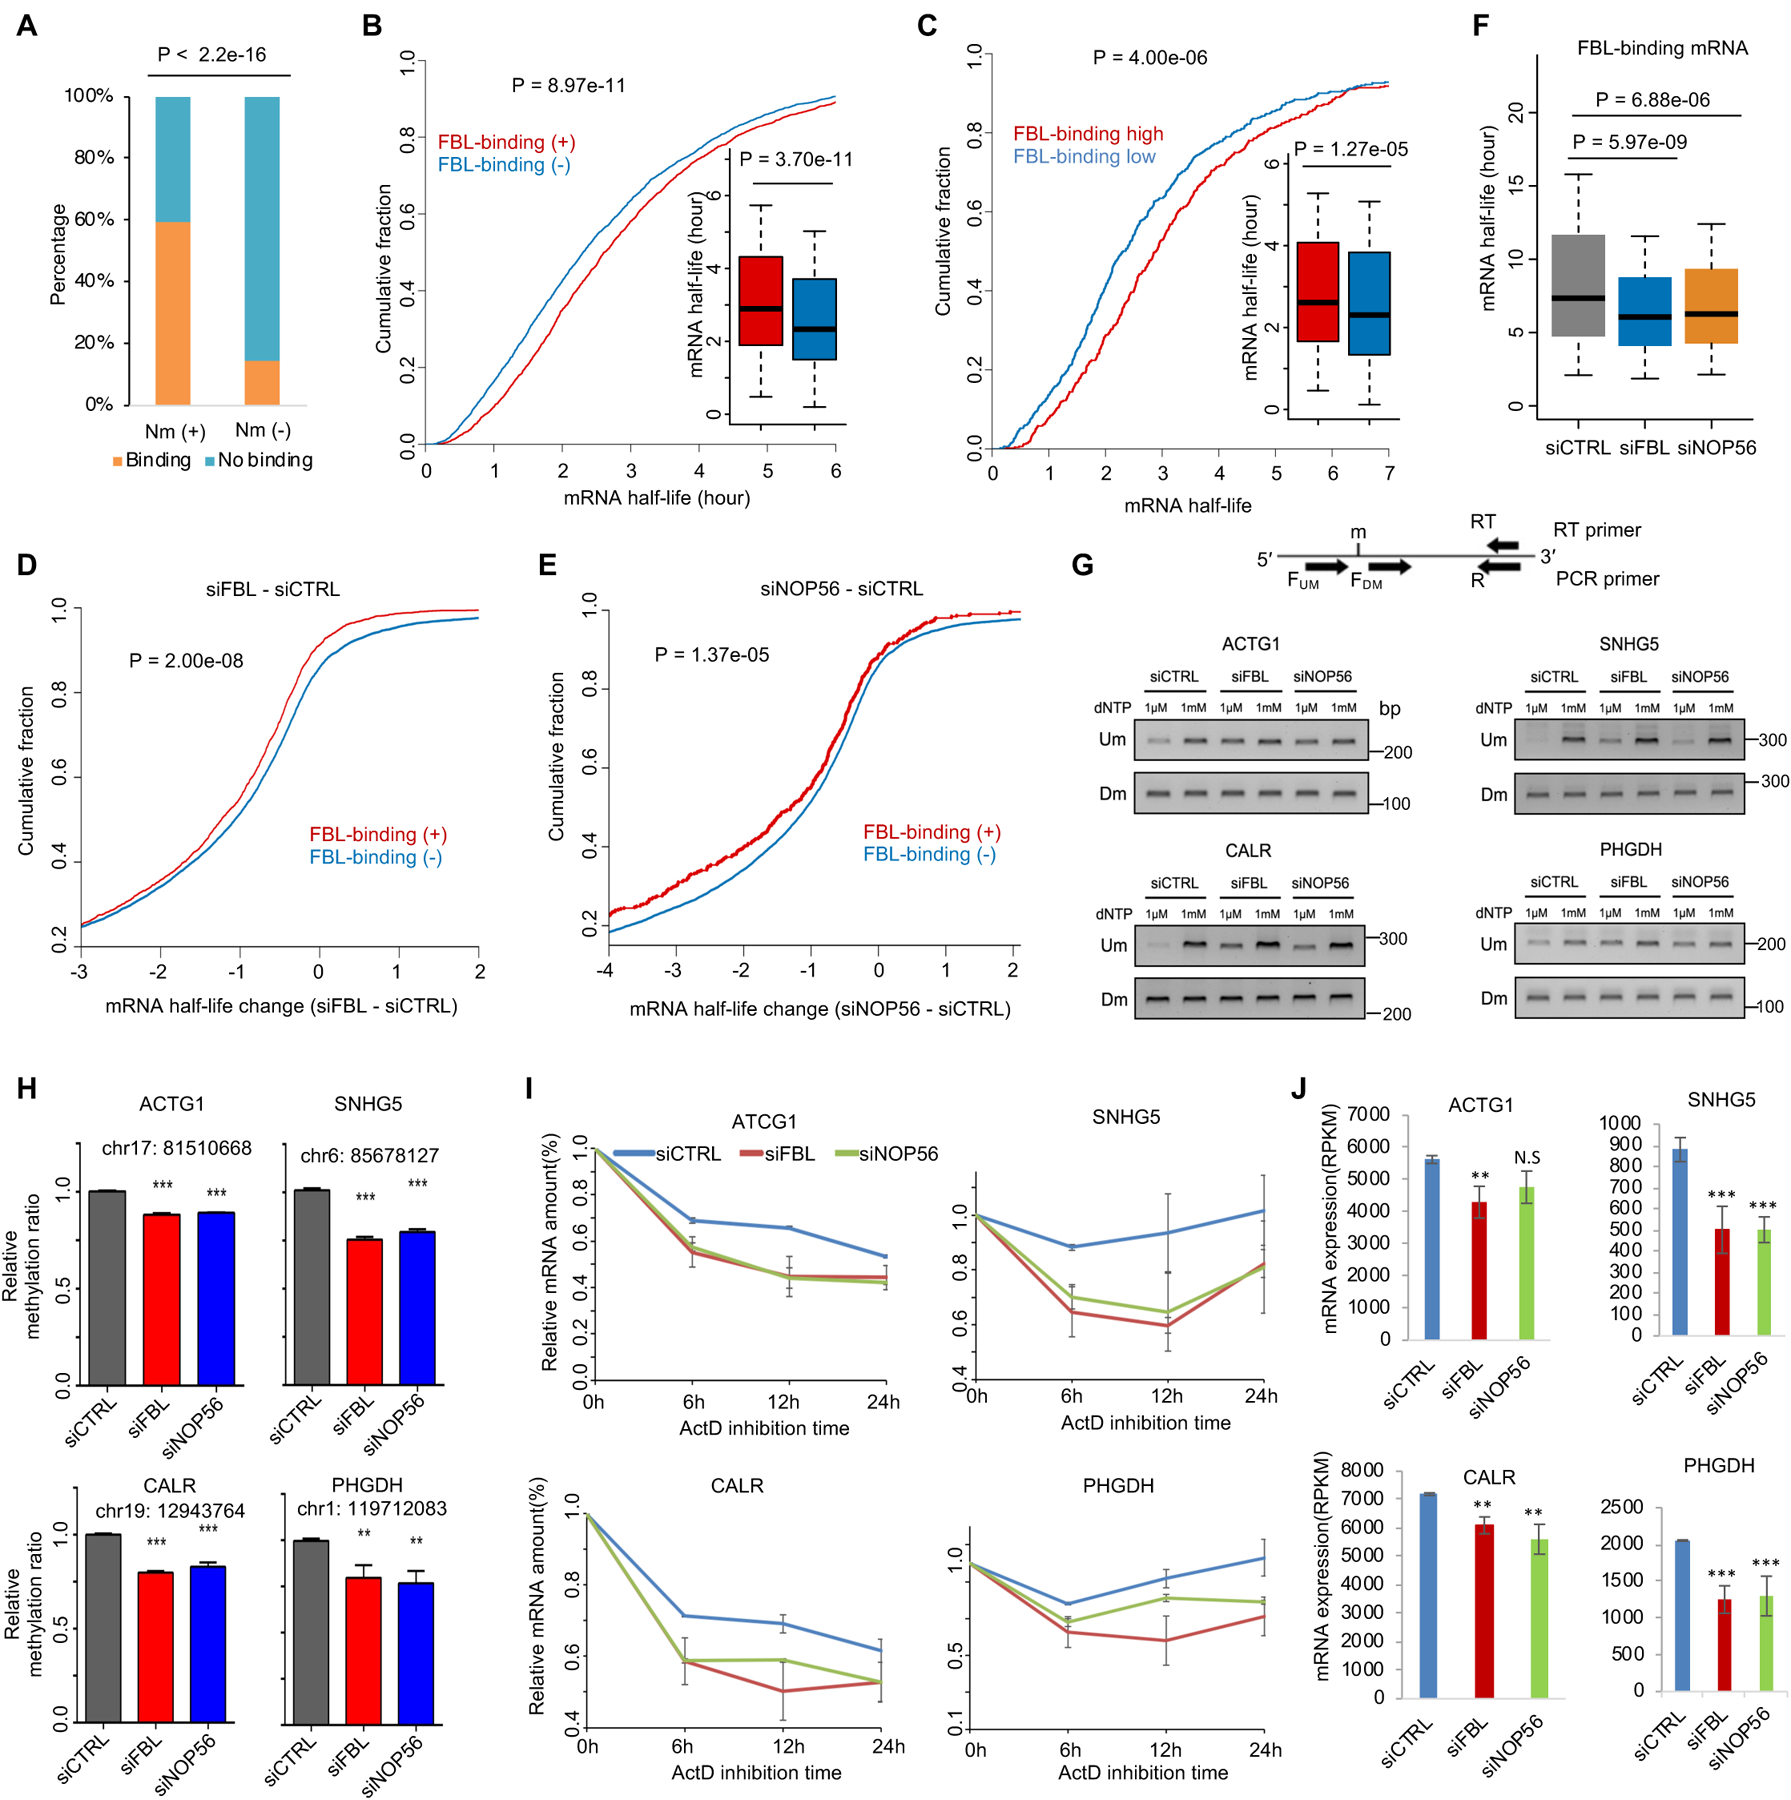
2'-O-methylation (Nm) is a prominent RNA modification well known in noncoding RNAs and more recently also found at many mRNA internal sites. However, their function and base-resolution stoichiometry remain underexplored. Here, we investigate the transcriptome-wide effect of internal site Nm on mRNA stability. Combining nanopore sequencing with our developed machine learning method, NanoNm, we identify thousands of Nm sites on mRNAs with a single-base resolution. We observe a positive effect of FBL-mediated Nm modification on mRNA stability and expression level. Elevated FBL expression in cancer cells is associated with increased expression levels for 2'-O-methylated mRNAs of cancer pathways, implying the role of FBL in post-transcriptional regulation. Lastly, we find that FBL-mediated 2'-O-methylation connects to widespread 3' UTR shortening, a mechanism that globally increases RNA stability. Collectively, we demonstrate that FBL-mediated Nm modifications at mRNA internal sites regulate gene expression by enhancing mRNA stability.

Keywords: 2′-O-methylation; CPSF7; FBL; RNA stability; alternative polyadenylation; epitranscriptomics; mRNA modification; machine learning; nanopore; prostate cancer.


Conflict of interest statement

Declaration of interests The authors declare no competing interests.

Figures

Figure 1.
Figure 1.. Nm at internal sites on mRNA and the expression of Nm writer protein FBL is required for the greater stability of 2′-O-methylated mRNAs compared to the rest of mRNAs.
(A) A cartoon to show Nm (top panel) and related questions on RNA stability (bottom). (B) GSEA showing a relationship between 2′-O-Methylation and mRNA half-life. (C) Cumulative and boxplot to show the half-life of mRNAs with or without detectable Nm. (D) Western blot to show the knockdown efficiency of FBL and NOP56 in C4–2 cells. (E-F) Cumulative fraction of mRNAs plotted against the change of mRNA half-life in response to knockdown of FBL (E) and NOP56 (F). (G) Boxplot to show the half-life of 2′-O-methylated mRNAs under individual conditions. (H) Heatmap showing half-life of top 2′-O-methylated mRNAs ranked by degree of half-life decrease upon FBL knockdown. P values were determined by two-tailed unpaired Wilcoxon’s test (boxplot in C, G) and K-S test (cumulative plot in C, E, F). All presented data were from HEK293T cells (Nm genes: n = 691). RNA half-life determined based on public (B-C) and our own (E-H) RNA-seq data generated following ActD inhibition of transcription. See also Figure S1 and Table S1.
Figure 2.
Figure 2.. The binding of FBL is required for the greater stability of FBL-binding mRNAs when compared to the rest of the mRNAs.
(A) Bar plot showing the overlap of 2′-O-methylated mRNAs and FBL-binding mRNAs. (B) Cumulative fraction of mRNAs plotted against half-life of mRNAs with (n = 2772) or without (n = 2772) detectable binding of FBL. (C) Cumulative fraction of mRNAs plotted against half-life of mRNAs with high (n = 500) or low (n = 500) binding intensity of FBL. (D-E) Cumulative fraction of mRNAs plotted against the change of mRNA half-life in response to knockdown of FBL (D) and NOP56 (E). (F) Half-life of FBL-binding mRNAs under three different conditions. (G) RTL-P assay detected Nm level on four mRNAs (ACTG1, SNHG5, CALR, PHGDH) under control, siFBL, and siNOP56 conditions. (H) Densitometric analysis of data from (G) was shown as the signal intensity ratio of PCR products at low dNTP (1 μM) over high dNTP (1 mM) conditions. The ratio in control cells was set to 1. Data represent Mean ± SD from n = 3 biologically experiments. **, P < 0.01, ***, P < 0.001. (I) Relative expression level of mRNA plotted against time after inhibition of transcription in each panel. Expression was determined by RNA-Seq (n = 2) and normalized to the 0-hour point. (J) Bar plot to show steady-state mRNA expression level determined by RNA-Seq. **, P < 0.01; ***, P < 0.001 were calculated by edgeR. P values were determined by a two-tailed K-S test (B, C, D, E) and Student’s t-test (H). All presented data were from HEK293T cells. RNA half-life determined based on public (A-C) and our own (E-F) RNA-seq data from ActD inhibition method. See also Figure S1 and Table S1.
Figure 3
Figure 3. Elevated FBL expression correlated with expression upregulation of FBL-binding and 2′-O-methylated mRNAs in PCa cells.
(A) Boxplot showing RNA expression level of FBL, NOP56, and NOP58 in prostate normal (n = 52) and cancer (n = 497) samples from the TCGA project. (B) Genome browser tracks showing RNA-Seq read density at individual gene loci. (C) A pie chart showing the distribution of FBL-binding sites in individual categories of RNAs in C4–2 cells. (D) GSEA result shows the relationship between the binding of FBL on mRNA and the expression change of mRNA in response to FBL knockdown. (E) Expression change of mRNAs in response to FBL knockdown. (F) Cumulative fraction of mRNAs plotted against the change of mRNA half-lives in response to FBL knockdown. (G) mRNA half-life of FBL-binding mRNAs under two conditions. (H) Cumulative and boxplot of half-life change of mRNAs between C4–2 and PrEC cells. (I) GSEA to show the relationship between the binding of FBL on mRNA in C4–2 cells and the expression change of mRNA between C4–2 and PrEC cells. (J) Expression of FBL-binding mRNAs between C4–2 and PrEC cells. FBL-binding mRNAs (n = 1886) in all figures were defined in the C4–2 cells. P-values were determined by two-tailed unpaired Wilcoxon’s tests (A, E, G, boxplot in H, J) and K-S test (F, cumulative curve in H). See also Figure S2 and Table S2.
Figure 4
Figure 4. A machine learning model for detection of Nm based on Nanopore direct RNAseq.
(A) Flowchart of the machine learning model to detect Nm based on Nanopore direct RNA-seq. (B) ROC curves showing the performance of the machine learning model for two different 5-mers in KTC-1 cells. (C, D) Nm modification ratio at individual sites on the 28S (C) and 18S (D) rRNAs of C4–2 cells. (E, F) Nm modification ratios at individual sites on 28S rRNA (E) and 18S rRNA (F) in siCTRL and siFBL C4–2 cells. (G) rRNA Nm modification ratio at known snoRNA-targeted Nm sites on 25S rRNA in yeast under wild type, snR60, snR61, and snR62 knockout conditions. (H, I) Nm modification ratio at individual sites on 28S rRNA (H) and 18S rRNA (I) in siCTRL and siFBL Drosophila cells. (J) Density plot of Nm modification ratio for mRNAs and rRNAs in C4–2 cells. (K) A pie chart shows the distribution of Nm sites in different sequence regions. P values were determined by two-tailed unpaired Wilcoxon’s tests (E, F, H, I). See also Figure S3 and Table S3.
Figure 5
Figure 5. Nm detected on mRNA by machine learning model based on Nanopore direct RNA-seq is downregulated by FBL knockdown.
(A) Boxplot to show the Nm ratio of Nm sites on mRNAs. (B) Scatter plot to show the Nm ratio of individual Nm sites on mRNAs in control and FBL knockdown cells. (C) Average density plot of Nm sites on mRNAs. (D) Venn diagram to show overlap between FBL-binding and 2′-O-methylated mRNAs. (E) The percentage of 2′-O-methylated mRNAs for individual gene groups ranked by mRNA expression level from the lowest to the highest. (F) GSEA shows the relationship between mRNA Nm modification and expression change upon FBL knockdown. (G) Expression change of individual mRNA groups upon FBL knockdown. (H) Boxplot showing mRNA half-life of individual mRNA groups (Hypo: n = 1088, Nm (+): n = 4586, Nm (−): n = 5852). (I) Cumulative fraction of mRNAs plotted against degree of mRNA half-life change upon FBL knockdown. (J) mRNA half-life changes of individual mRNA groups upon FBL knockdown. (K-L) Half-life change (K) and expression change (L) of 2′-O-methylated and unmethylated noncoding RNAs in C4–2 cells (Nm (+): n = 76, Nm (−): n = 480). (M) mRNA half-life of 2′-O-methylated noncoding RNAs in FBL knockdown cells. P values were determined by two-tailed unpaired Wilcoxon’s tests (A, G, H, J-M) and K-S test (I). All presented data were from C4–2 cells. See also Figure S4 and Table S3–4.
Figure 6
Figure 6. FBL expression in PCa cell C4–2 is required for the Nm modification and expression of mRNAs in cancer pathways.
(A) Heatmap to show Nm ratio of 10 Nm sites from Nanopore direct RNA-seq. (B) RTL-P assay to detect the Nm level at 7 Nm sites of mRNAs shown in (A). (C) Densitometric analysis of data from (B) was shown as signal intensity ratio of PCR products at low dNTP (1 μM) over high dNTP (1 mM) level. Methylation levels in control cells were set close to 1. Data represent Mean ± SD from n = 3 biologically independent experiments. *, P < 0.05; **, P < 0.01; ***, P < 0.001 is based on two-tailed Student’s t-test. (D) Heat map to show the mRNA expression level of the 8 example genes. (E) Expression change of C4–2 cell 2′-Omethylated mRNAs in PCa and normal patients from the TCGA project dataset. (F) Western blot showing the protein levels of PSMD13 in each group as indicated. (G-H) RTL-P assay to detect the Nm level at two Nm sites of PSMD13 in each group as indicated. (I) Expression of PSMD13 in the TCGA prostate cancer patients grouped based on nodal metastasis status. (J) Disease-free survival of patients with different PSMD13 expression levels in PCa samples from the TCGA dataset. (K) Western blot to show the knockdown efficiency of PSMD13 in C4–2 cells. (L) CellTiter assay to measure the effect of PSMD13 knockdown on cell proliferation. (M-N) Transwell assay to measure the change of cell invasion capability upon PSMD13 knockdown (n = 8), scale bar =100μm. (O-P) Wound Healing assay to determine the change of cell migratory capability upon PSMD13 suppression (n = 6), scale bar =100μm. All presented data were from C4–2 cells except the patient samples from the TCGA database. *P < 0.05, **P < 0.01, ***P < 0.001 is based on the student’s t-test unless otherwise stated. See also Figure S4–5 and Table S4.
Figure 7.
Figure 7.. mRNA stabilization by Nm is associated with 3′ UTR shortening.
(A) Cumulative fraction plot of 3′ UTR lengths of individual mRNAs in three groups (Hypo: n = 1088, Nm (+): n = 4586, Nm (−): n = 5852). (B) Number of miRNA target sites in 3′ UTR regions of individual mRNAs in three groups. (C) ARE scores for 3′ UTR regions of individual mRNAs in three groups. (D) Scatter plot to show PDUI (percentage of distal usage index) values of individual mRNAs in control and FBL knockdown conditions. The internal bar plot shows numbers of 3′ UTR lengthening and shortening events induced by FBL knockdown. (E) Venn diagram shows the overlap between genes showing lengthened 3′ UTR upon siFBL and 2′-O-methylated genes under control condition. (F) Number of overlaps observed or expected by chance between genes that show lengthened or shortened 3′ UTR upon siFBL and genes that show 2′-O-methylated mRNAs under control condition. (G) mRNA Nm ratios of individual genes that showed lengthened and shortened 3′ UTR upon FBL knockdown. The ratio of unmethylated sites in siFBL was considered to be 0. (H) Cumulative fraction plot shows mRNA half-life changes of individual gene groups that show lengthened and shortened 3′ UTRs upon FBL knockdown. (I) Genome browser overlay line tracks of RNA-seq read density at 3′ UTR of four example genes. Blue and red curve lines are plotted for control and FBL-knockdown cells, respectively. Blue vertical lines show Nm sites. (J) The percentage of Nm sites overlapping with the binding regions of 10 different RNA binding proteins (RBPs) in HEK293T cells. (K) Scatter plot showing a correlation between the PDUI changes induced by FBL and CPSF depletion in HepG2 cells. (L) RIP-qPCR to detect the change of the binding of CPSF7 to 2′-O-methylated mRNAs upon FBL knockdown. (M) Western blot shows the protein expressions under different conditions. (N) A proposed working model of Nm-dependent regulation of RNA stability. P values were determined by two-tailed unpaired K-S test (A), Wilcoxon test (B, C, G), two-tailed binomial test (D), one-tailed Fisher’s exact test, (F) one-tailed unpaired K-S test (H), Fisher exact test (J), Pearson correlation test (K), and t-test (L). All presented data are from C4–2 cells unless labeled explicitly as from HepG2 cells. Hypo, mRNAs showing hypomethylated Nm sites upon FBL knockdown; Nm (+), mRNAs showing Nm sites and Nm (−), mRNAs showing no detectable Nm sites in C4–2 cells. See also Figure S6–7 and Table S7.

References

    1. Roundtree IA, Evans ME, Pan T, and He C (2017). Dynamic RNA Modifications in Gene Expression Regulation. Cell 169, 1187–1200. 10.1016/j.cell.2017.05.045. - DOI - PMC - PubMed
    1. Boccaletto P, Stefaniak F, Ray A, Cappannini A, Mukherjee S, Purta E, Kurkowska M, Shirvanizadeh N, Destefanis E, Groza P, et al. (2022). MODOMICS: a database of RNA modification pathways. 2021 update. Nucleic Acids Res 50, D231–D235. 10.1093/nar/gkab1083. - DOI - PMC - PubMed
    1. Dominissini D, Moshitch-Moshkovitz S, Schwartz S, Salmon-Divon M, Ungar L, Osenberg S, Cesarkas K, Jacob-Hirsch J, Amariglio N, Kupiec M, et al. (2012). Topology of the human and mouse m6A RNA methylomes revealed by m6A-seq. Nature 485, 201–206. 10.1038/nature11112. - DOI - PubMed
    1. Carlile TM, Rojas-Duran MF, Zinshteyn B, Shin H, Bartoli KM, and Gilbert WV (2014). Pseudouridine profiling reveals regulated mRNA pseudouridylation in yeast and human cells. Nature 515, 143–146. 10.1038/nature13802. - DOI - PMC - PubMed
    1. Edelheit S, Schwartz S, Mumbach MR, Wurtzel O, and Sorek R (2013). Transcriptome-wide mapping of 5-methylcytidine RNA modifications in bacteria, archaea, and yeast reveals m5C within archaeal mRNAs. PLoS Genet 9, e1003602. 10.1371/journal.pgen.1003602. - DOI - PMC - PubMed

LinkOut - more resources