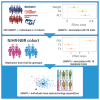
SMIM1 absence is associated with reduced energy expenditure and excess weight
- PMID: 38906141
- PMCID: PMC7617389
- DOI: 10.1016/j.medj.2024.05.015
SMIM1 absence is associated with reduced energy expenditure and excess weight
Abstract
Background: Obesity rates have nearly tripled in the past 50 years, and by 2030 more than 1 billion individuals worldwide are projected to be obese. This creates a significant economic strain due to the associated non-communicable diseases. The root cause is an energy expenditure imbalance, owing to an interplay of lifestyle, environmental, and genetic factors. Obesity has a polygenic genetic architecture; however, single genetic variants with large effect size are etiological in a minority of cases. These variants allowed the discovery of novel genes and biology relevant to weight regulation and ultimately led to the development of novel specific treatments.
Methods: We used a case-control approach to determine metabolic differences between individuals homozygous for a loss-of-function genetic variant in the small integral membrane protein 1 (SMIM1) and the general population, leveraging data from five cohorts. Metabolic characterization of SMIM1-/- individuals was performed using plasma biochemistry, calorimetric chamber, and DXA scan.
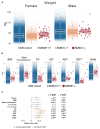
Findings: We found that individuals homozygous for a loss-of-function genetic variant in SMIM1 gene, underlying the blood group Vel, display excess body weight, dyslipidemia, altered leptin to adiponectin ratio, increased liver enzymes, and lower thyroid hormone levels. This was accompanied by a reduction in resting energy expenditure.
Conclusion: This research identified a novel genetic predisposition to being overweight or obese. It highlights the need to investigate the genetic causes of obesity to select the most appropriate treatment given the large cost disparity between them.
Funding: This work was funded by the National Institute of Health Research, British Heart Foundation, and NHS Blood and Transplant.
Keywords: BMI; SMIM1; Translation to patients; Vel; blood groups; dyslipidemia; metabolism; obesity; population genetics; weight.
Copyright © 2024 The Author(s). Published by Elsevier Inc. All rights reserved.
Conflict of interest statement
Declaration of interests J.S. is the deputy CEO and 50% owner of BLUsang AB. He holds patents on Vel genotyping (inventors: Jill Storry, Magnus Jöud, Björn Nilsson, and Martin L. Olsson). J.S. has received speaker fees, royalties, and honoraria from the following companies: Grifols Diagnostic Solutions, QuidelOrtho Inc., and Biorad Laboratories. J.S. receives an honorarium for Section Editor work, Vox Sanguinis from John Wiley & Sons Ltd. J.S. is Vice President of the International Society of Blood Transfusion and married to Professor M.L.O. M.L.O. is CEO and 50% owner of BLUsang AB. M.L.O. holds patents on Vel genotyping (inventors: Jill Storry, Magnus Jöud, Björn Nilsson, and Martin L. Olsson). M.L.O. received speaker fees, royalties, and honoraria from the following companies: Grifols Diagnostic Solutions, QuidelOrtho Inc., and Biorad Laboratories. M.L.O. is married to Adjunct Professor J.S. W.N.E. is chair of the International Council for Standardization in Haematology. W.N.E. works as advisor for Scorpio Labs and is on the editorial board of the Journal of Clinical Pathology. W.H.O. is chair of the Blood Transfusion Genomics Consortium. W.H.O. is in receipt of an educational/research grant from Thermo Fisher Scientific. N.G. offers scientific consulting services to Thermo Fisher Scientific.
Figures


References
-
- Storry JR, Jöud M, Christophersen MK, Thuresson B, Åkerström B, Sojka BN, Nilsson B, Olsson ML. Homozygosity for a null allele of SMIM1 defines the Vel-negative blood group phenotype. Nat Genet. 2013;45:537–541. - PubMed
-
- Borén T, Falk P, Roth KA, Larson G, Normark S. Attachment of Helicobacter pylori to human gastric epithelium mediated by blood group antigens. Science. 1993;262:1892–1895. - PubMed
MeSH terms
Substances
Grants and funding
LinkOut - more resources
Full Text Sources
Medical
Molecular Biology Databases
Research Materials
Miscellaneous

