. 2024 Jun 21;15(1):5300.
doi: 10.1038/s41467-024-49675-2.

PJA1-mediated suppression of pyroptosis as a driver of docetaxel resistance in nasopharyngeal carcinoma

Affiliations

PJA1-mediated suppression of pyroptosis as a driver of docetaxel resistance in nasopharyngeal carcinoma

Sheng-Yan Huang et al. Nat Commun. .

Abstract

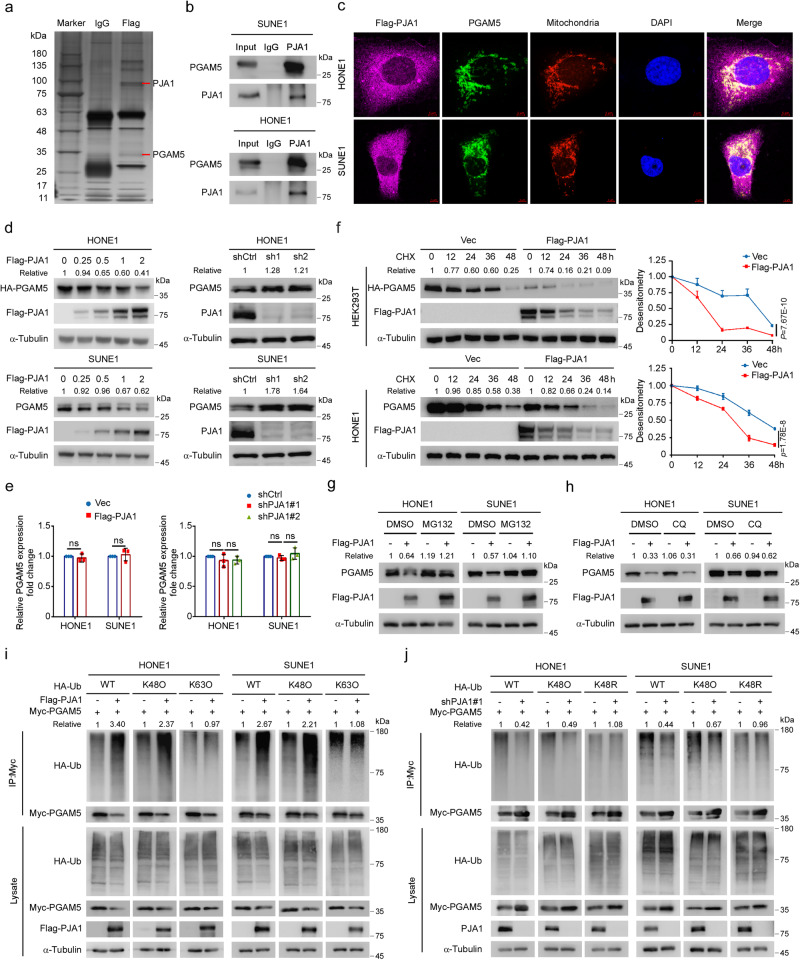
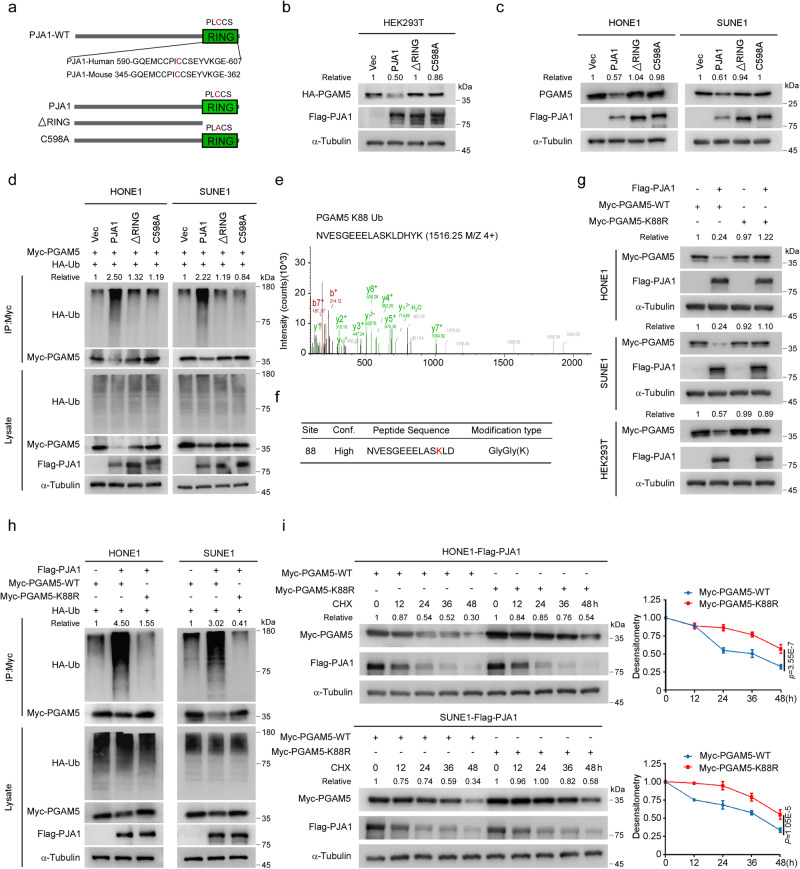
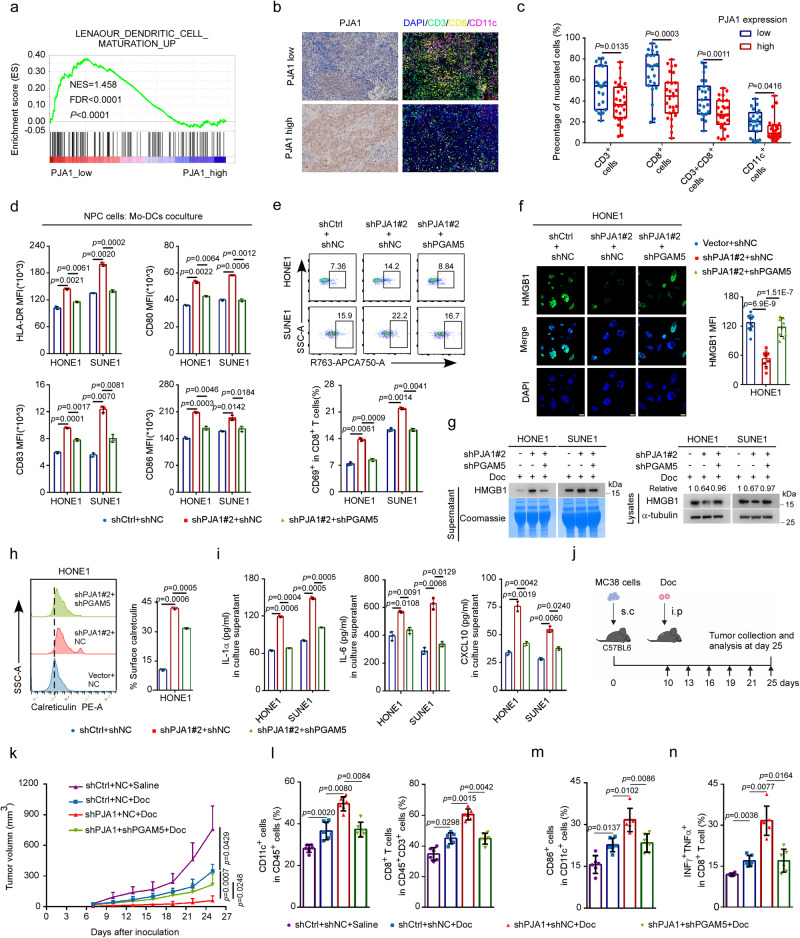
Chemoresistance is a main reason for treatment failure in patients with nasopharyngeal carcinoma, but the exact regulatory mechanism underlying chemoresistance in nasopharyngeal carcinoma remains to be elucidated. Here, we identify PJA1 as a key E3 ubiquitin ligase involved in nasopharyngeal carcinoma chemoresistance that is highly expressed in nasopharyngeal carcinoma patients with nonresponse to docetaxel-cisplatin-5-fluorouracil induction chemotherapy. We find that PJA1 facilitates docetaxel resistance by inhibiting GSDME-mediated pyroptosis in nasopharyngeal carcinoma cells. Mechanistically, PJA1 promotes the degradation of the mitochondrial protein PGAM5 by increasing its K48-linked ubiquitination at K88, which further facilitates DRP1 phosphorylation at S637 and reduced mitochondrial reactive oxygen species production, resulting in suppression of GSDME-mediated pyroptosis and the antitumour immune response. PGAM5 knockdown fully restores the docetaxel sensitization effect of PJA1 knockdown. Moreover, pharmacological targeting of PJA1 with the small molecule inhibitor RTA402 enhances the docetaxel sensitivity of nasopharyngeal carcinoma in vitro and in vivo. Clinically, high PJA1 expression indicates inferior survival and poor clinical efficacy of TPF IC in nasopharyngeal carcinoma patients. Our study emphasizes the essential role of E3 ligases in regulating chemoresistance and provides therapeutic strategies for nasopharyngeal carcinoma based on targeting the ubiquitin-proteasome system.


Conflict of interest statement

The authors declare no competing interests.

Figures

Fig. 1
Fig. 1. PJA1 facilitates docetaxel resistance by repressing pyroptosis in NPC.
ac Heatmap showing differentially expressed chemosensitivity-related genes (fold-change ≥1.5, q value <0.05) (a), Module analysis of the protein–protein interaction (PPI) network (b), and analysis of PJA1 expression (c, mean ± s.d., two-tailed unpaired t-test) in NPC tumours from patients with a response (n = 71) or nonresponse (n = 24) to induction chemotherapy (IC) with the docetaxel-cisplatin-5-fluorouracil (TPF) regimen, based on microarray data (GSE132112). d Kaplan–Meier analysis of disease-free survival in NPC patients treated with (n = 68) or without (n = 71) IC in the low PJA1 expression, and Kaplan–Meier analysis of disease-free survival in NPC patients treated with (n = 76) or without (n = 64) IC in the high PJA1 expression groups (log-rank test). e CCK8 assay measuring the chemosensitivity of NPC cells transfected with the shCtrl or sh-PJA1s plasmids and exposed to the indicated concentrations of docetaxel (Doc, mean ± s.d., two-way ANOVA). f Flow cytometry analysis of cell death in NPC cells transfected with the shCtrl or sh-PJA1s plasmids and exposed to Doc (10 nM) for 48 h (mean ± s.d., one-way ANOVA). gi SUNE1 cells stably transfected with the shCtrl or sh-PJA1 plasmids were implanted subcutaneously into BALB/c nude mice to establish a xenograft growth model, and the mice were treated with or without Doc (10 mg/kg) (g). Growth curves (h, two-tailed Student’s t-test) and weights of the excised tumours (i, two-tailed unpaired t-test) in each group (mean (n = 6) ± s.d.). jm NPC cells were transfected with the shCtrl or sh-PJA1 plasmids and exposed to Doc (10 nM). Representative images of pyroptotic morphology. The red arrow indicates pyroptotic cells. Scale bar, 25 μm. j LDH release (k, mean ± s.d., one-way ANOVA), caspase-3 and GSDME cleavage (l) and the proportion of annexin V+/PI+ cells (m, mean ± s.d., one-way ANOVA) were shown. n Gene set enrichment analysis (GSEA) indicated that the pyroptosis pathway was enriched in the low PJA1-expression group (GSE132112) (permutation test). One-way ANOVA with Dunnett’s multiple comparisons test; n = 4 (e), n = 3 (f, j, k, m) repeats from three independent experiments. Source data are provided as a Source Data file.
Fig. 2
Fig. 2. PJA1 promotes PGAM5 degradation by increasing its K48-linked ubiquitination.
a Silver staining of SDS–PAGE gels showed that the Flag-immunoprecipitants were pulled down from SUNE1 cells overexpressing Flag-PJA1. Red lines indicate the proteins of interest. b Co-IP with an anti-PJA1 antibody revealed the endogenous association of PJA1 and PGAM5 in NPC cells. c IF staining revealed the cellular localisation of exogenous Flag-PJA1 (purple), endogenous PGAM5 (green) and mitochondria (red) in NPC cells. Scale bars, 5 μm. d, e Protein (d) and mRNA (e, mean ± s.d., two-tailed unpaired t-test (left), one-way ANOVA with Dunnett’s multiple comparisons tests (right)) expression of PGAM5 in NPC cells transfected with gradient concentrations of the Flag-PJA1 plasmids, as well as in NPC cells transfected with the shCtrl or sh-PJA1s plasmids. f Immunoblot (left) and the corresponding greyscale analysis (right) of PGAM5 expression in HEK293T and HONE1 cells transfected with the HA-PGAM5 plasmids together with the empty vector or Flag-PJA1 plasmids after the CHX treatment (mean ± s.d., two-way ANOVA). g, h PGAM5 protein levels in NPC cells transfected with the empty vector or Flag-PJA1 plasmids after the treatment with MG132 (g) or CQ (h). i, j NPC cells transfected with the empty vector or Flag-PJA1 plasmids (i) or with the shCtrl or sh-PJA1 plasmids (j) together with Myc-PGAM5 and HA-WT-Ub or its mutants (HA-K48O-Ub, HA-K63O-Ub or HA-K48R-Ub) were subjected to denaturing IP with the indicated antibodies. n = 3 (e) independent experiments. Source data are provided as a Source Data file.
Fig. 3
Fig. 3. PJA1 catalyses PGAM5 polyubiquitination at K88 depending on its E3 ligase activity.
a Schematic representation of plasmids expressing Flag-tagged wild-type (WT) PJA1, its RING deletion mutant (ΔRING), or its C598A mutant. b, c PGAM5 protein levels in HEK293T cells (b) and NPC cells (c) transfected with the empty vector or the Flag-PJA1 WT, ΔRING or C598A mutant plasmids. d NPC cells transfected with the empty vector or the Flag-PJA1 WT, ΔRING or C598A mutant plasmids, together with Myc-PGAM5 and HA-WT-Ub were subjected to denaturing IP with the indicated antibodies. e, f Mass spectrometry analysis identified the ubiquitination site K88 in PGAM5. g Protein levels of PGAM5 in NPC cells cotransfected with the empty vector or Flag-PJA1 plasmids, together with the Myc-PGAM5-WT or K88R mutant plasmids. h NPC cells were transfected with the empty vector or Flag-PJA1 plasmids, together with the HA-Ub and Myc-PGAM5-WT or the K88R mutant and subjected to denaturing IP with the indicated antibodies. i Immunoblot (left) and the corresponding greyscale analysis (right) of PGAM5 expression in NPC cells transfected with the Flag-PJA1 and Myc-PGAM5-WT or the K88R mutant plasmids after CHX treatment (mean ± s.d., two-way ANOVA). N = 3 (i) repeats from three independent experiments. Source data are provided as a Source Data file.
Fig. 4
Fig. 4. PJA1 inhibits docetaxel-induced mitochondrial damage via the PGAM5-DRP1 axis.
a Diagram showing that PGAM5 recruits DRP1 and dephosphorylates DRP1 at S637 site. b IF staining revealed the cellular localisation of endogenous DRP1 (blue), PGAM5 (green) and mitochondria (red). Scale bars, 5 μm. c Co-IP with an anti-DRP1 antibody revealed the endogenous associations of DRP1 with PJA1 and PGAM5 in NPC cells. d, e Protein levels of total DRP and pDRP1ser637 in HONE1 cells transfected with the shCtrl or sh-PJA1s plasmids alone (d) or together with the Myc-PGAM5-WT or the K88R mutant plasmids (e). f Representative fluorescence images of mitochondria in NPC cells transfected with the shCtrl or sh-PJA1s plasmids and exposed to docetaxel (10 nM). Scale bar, 1 μm. More than 50 cells were counted to determine the proportions of tubular and fragmented mitochondria (mean ± s.d., one-way ANOVA). gi The mitochondrial membrane potential (g), the production of ATP (h) and mROS (i) measured by flow cytometry in NPC cells transfected with the shCtrl or sh-PJA1s plasmids and exposed to Doc (10 nM) (mean ± s.d., one-way ANOVA). j Levels of cytochrome c in the cytoplasmic (Cyto) and mitochondrial (Mito) fractions of lysates from NPC cells transfected with the shCtrl or sh-PJA1s plasmids and exposed to Doc (10 nM). k Representative images of mitochondria in HONE1 cells transfected with the shCtrl or sh-PJA1 plasmids together with shNC or shPGAM5 plasmids, and exposed to Doc (10 nM). Scale bar, 1 μm. More than 50 cells were counted to determine the proportions of tubular and fragmented mitochondria (mean ± s.d., one-way ANOVA). l, m Flow cytometric analysis of mitochondrial membrane potential (l) and the production of mROS (m) in NPC cells transfected with the shCtrl or sh-PJA1 plasmids together with shNC or shPGAM5 plasmids, and exposed to Doc (10 nM) (mean ± s.d., one-way ANOVA). One-way ANOVA with Dunnett’s multiple comparisons test; n (fi, km) = 3 independent experiments. Source data are provided as a Source Data file.
Fig. 5
Fig. 5. PJA1 degrades PGAM5 to inhibit pyroptosis and promote docetaxel resistance.
af NPC cells were transfected with the shCtrl or sh-PJA1 plasmids in combination with siNC or siPGAM5, and then exposed to docetaxel (10 nM or indicated doses). Representative images of pyroptotic morphology. The red arrow indicates pyroptotic cells. Scale bar, 25 μm. a LDH release (b mean ± s.d., one-way ANOVA), caspase-3 and GSDME cleavage (c), the proportion of annexin V+/PI+ cells (d mean ± s.d., one-way ANOVA), the chemosensitivity (e mean ± s.d., two-way ANOVA) and cell death (f mean ± s.d., one-way ANOVA) were shown. gk SUNE1 cells stably transfected with the shCtrl or sh-PJA1 plasmids together with shNC or shPGAM5 plasmids were implanted subcutaneously into the axillae of BALB/c nude mice to establish a xenograft growth model and exposed to Doc (10 mg/kg) or not (g). Macroscopic images (h), tumour growth curves (i mean (n = 6) ± s.d., one-way ANOVA) and the excited tumour weights (j mean (n = 6) ± s.d., one-way ANOVA) in each group. Representative images of IHC staining (left) and IHC scores (right) for pDRP1Ser673 expression in the tumours excised from mice in each group. Scale bars, 50 μm. (k mean (n = 6) ± s.d., one-way ANOVA). One-way ANOVA with Dunnett’s multiple comparisons test; n = 4 (b), n = 3 (a, d, e, f) repeats from three independent experiments. Source data are provided as a Source Data file.
Fig. 6
Fig. 6. PJA1 attenuates docetaxel-induced antitumour immunity.
a GSEA based on the GSE102349 dataset showing gene sets related to DC maturation enriched in PJA1-low NPC tissues (permutation test). b, c Representative images (b) and quantification results (c) of multiplex IF for analysis of infiltrated immune cells in 50 NPC tumours. Scale bar, 100 μm (mean ± s.d. two-tailed unpaired t- test). di NPC cells were treated with Doc (10 nM) for 48 h and were then cocultured with Mo-DCs for another 36 h. the levels of maturation markers on the surface of Mo-DCs were then measured by flow cytometry (d mean ± s.d., one-way ANOVA). Doc-treated NPC cells were cocultured with PBMCs for 36 h, and the percentage of CD69+CD8+ T cells was determined by flow cytometry (e mean ± s.d., one-way ANOVA). f Representative fluorescence images showing the release of HMGB1 from the nucleus into the cytoplasm in HONE1 cells. Quantitative data from ten randomly selected fields per group are shown. Scale bar, 20 μm (mean ± s.d., one-way ANOVA). g Levels of HMGB1 in the supernatant and lysates of NPC cells. Coomassie staining was used as a control to verify equal gel loading. h The expression level of calreticulin on the surface of HONE1 cells was determined by flow cytometry (mean ± s.d., one-way ANOVA). i The concentrations of IL-1α, IL-6 and CXCL10 in the supernatant were measured by ELISA (mean ± s.d., one-way ANOVA). jn MC38 cells were implanted subcutaneously into C57BL/6 mice to establish a xenograft growth model, and these mice were then treated with or without Doc (10 mg/kg) (j). Tumour growth curves (k mean (n = 6) ± s.d., two-way ANOVA), the percentages of CD11c+ DCs among CD45+ cells and the percentages of CD8+ T cells among CD45+CD3+ cells (l), the surface expression of CD86 on CD11c+ DCs (m), and the percentage of INFγ+TNFα+ T cells among CD8+ T cells (n) (mean (n = 6) ± s.d., one-way ANOVA) are shown. one-way ANOVA with Dunnett’s multiple comparisons test; n (df, h, i) = 3 independent experiments. Source data are provided as a Source Data file.
Fig. 7
Fig. 7. Pharmacological targeting of PJA1 enhances the docetaxel sensitivity of NPC.
a The binding modes of RTA402 to the PJA1 protein were analysed by in silico molecular docking simulation. be SUNE1 cells were implanted subcutaneously into BALB/C nude mice, and these mice were treated with Doc or not (6 mg/kg) together with RTA402 or not (b). Macroscopic images (c), tumour growth curves (d mean (n = 6) ± s.d., two-way ANOVA) and the excited tumour weights (e mean (n = 6) ± s.d., two-tailed unpaired t-test) in each group. fi HONE1 cells were implanted subcutaneously into humanised NSG mice, and these mice were treated with Doc or not (6 mg/kg) together with RTA402 or not (f). Tumour growth curves (g mean (n = 6) ± s.d., two-way ANOVA), the excited tumour weights (h mean (n = 6) ± s.d., two-tailed unpaired t-test) and percentages of CD45+ immune cells, CD3+ T cells, and CD8+ T cells (i mean (n = 6) ± s.d., two-tailed unpaired t-test) in tumours from mice in each group. j Proposed working model. PJA1 promoted the degradation of the mitochondrial protein PGAM5 by increasing its K48-linked ubiquitination at K88, which further facilitated the phosphorylation of DRP1 at S637 and reduced the production of mROS, resulting in the suppression of GSDME-mediated pyroptosis and induction of the antitumour immune response. PJA1 can be effectively targeted by RTA402 to enhance the docetaxel sensitivity of NPC. Source data are provided as a Source Data file.

References

    1. Chen YP, et al. Nasopharyngeal carcinoma. Lancet. 2019;394:64–80. doi: 10.1016/S0140-6736(19)30956-0. - DOI - PubMed
    1. Qiao H, et al. Association of intratumoral microbiota with prognosis in patients with nasopharyngeal carcinoma from 2 hospitals in China. JAMA Oncol. 2022;8:1301–1309. doi: 10.1001/jamaoncol.2022.2810. - DOI - PMC - PubMed
    1. Chen YP, et al. Chemotherapy in combination with radiotherapy for definitive-intent treatment of stage II-IVA nasopharyngeal carcinoma: CSCO and ASCO guideline. J. Clin. Oncol. 2021;39:840–859. doi: 10.1200/JCO.20.03237. - DOI - PubMed
    1. Tang LL, et al. The Chinese Society of Clinical Oncology (CSCO) clinical guidelines for the diagnosis and treatment of nasopharyngeal carcinoma. Cancer Commun. 2021;41:1195–1227. doi: 10.1002/cac2.12218. - DOI - PMC - PubMed
    1. Sun Y, et al. Induction chemotherapy plus concurrent chemoradiotherapy versus concurrent chemoradiotherapy alone in locoregionally advanced nasopharyngeal carcinoma: a phase 3, multicentre, randomised controlled trial. Lancet Oncol. 2016;17:1509–1520. doi: 10.1016/S1470-2045(16)30410-7. - DOI - PubMed

MeSH terms